

Abstract
We used apparent motion targets to explore how degraded visual motion alters smooth pursuit eye movements. Apparent motion targets consisted of brief stationary flashes with a spatial separation (Δx), temporal separation (Δt), and apparent target velocity equal to Δx/Δt. Changes in pursuit initiation were readily observed when holding target velocity constant and increasing the flash separation. As flash separation increased, the first deficit observed was an increase in the latency to peak eye acceleration. Also seen was a paradoxical increase in initial eye acceleration. Further increases in the flash separation produced larger increases in latency and resulted in decreased eye acceleration. By varying target velocity, we were able to discern that the visual inputs driving pursuit initiation show both temporal and spatial limits. For target velocities above 4–8°/s, deficits in the initiation of pursuit were seen when Δx exceeded 0.2–0.5°, even when Δt was small. For target velocities below 4–8°/s, deficits appeared when Δt exceeded 32–64 ms, even when Δx was small. Further experiments were designed to determine whether the spatial limit varied as retinal and extra-retinal factors changed. Varying the initial retinal position of the target for motion at 18°/s revealed that the spatial limit increased as a function of retinal eccentricity. We then employed targets that increased velocity twice, once from fixation and again during pursuit. These experiments revealed that, as expected, the spatial limit is expressed in terms of the flash separation on the retina. The spatial limit is uninfluenced by either eye velocity or the absolute velocity of the target. These experiments also demonstrate that “initiation” deficits can be observed during ongoing pursuit, and are thus not deficits in initiation per se. We conclude that such deficits result from degradation of the retino-centric motion signals that drive pursuit eye acceleration. For large flash separations, we also observed deficits in the maintenance of pursuit: sustained eye velocity failed to match the constant apparent target velocity. Deficits in the maintenance of pursuit depended on both target velocity and Δt and did not result simply from a failure of degraded image motion signals to drive eye acceleration. We argue that such deficits result from a low gain in the eye velocity memory that normally supports the maintenance of pursuit. This low gain may appear because visual inputs are so degraded that the transition from fixation to tracking is incomplete.
INTRODUCTION
Smooth pursuit eye movements are used by primates to track small moving targets. Step-ramp target trajectories, consisting of a step in target position concurrent with the onset of target motion, have become a standard approach for analyzing non-predictive features of pursuit (Lisberger and Westbrook 1985; Rashbass 1961). Shortly after the onset of target motion, the eye accelerates rapidly toward target velocity. Following this rapid acceleration, eye velocity settles near target velocity. Pursuit of step-ramp targets is thus often described as having “initiation” and “maintenance” phases.
While dividing the response into initiation and maintenance phases is descriptively useful, there is no evidence that the pursuit system makes an active transition from one phase to the other, or that its responsiveness differs between the two states. Instead, analysis of pursuit has revealed two functional mechanisms that do not map directly onto the two phases of pursuit initiation and maintenance. One mechanism, called “visuo-motor drive,” relies on visual motion inputs represented in a population code in the middle temporal area of extra-striate visual cortex (area MT), and transforms that code into commands for smooth eye acceleration (Dursteler et al. 1987; Groh et al. 1997; Morris and Lisberger 1987; Newsome et al. 1985). The other mechanism, called “eye velocity memory,” converts commands for eye acceleration into signals for desired smooth eye velocity and ensures that eye velocity will decay only slowly from its current value in the absence of image motion (Morris and Lisberger 1987; Robinson 1971; Robinson et al. 1986; Young et al. 1968). Acting as an acceleration to velocity integrator, eye velocity memory is conceptually similar to, but functionally distinct from, the well-known “neural integrator” that converts commands for eye velocity into commands for eye position (Robinson 1989). Visuo-motor drive and eye velocity memory are both active during both the initiation and maintenance of pursuit. However, for step ramp targets, changes in pursuit initiation can typically be attributed to changes in visuo-motor drive, assuming that the status of eye velocity memory remains constant. Likewise, the analysis of maintenance can be used to evaluate the status of eye velocity memory, assuming that visuo-motor drive is sufficient to drive the eye to the constant target velocity.
Recent reports from our laboratory have emphasized a third mechanism that we have previously called a “pursuit switch” or “on-line gain control” and that we will refer to here as the “engagement” of pursuit. The existence of different levels of engagement of pursuit was previously demonstrated using brief perturbations of target motion to probe the gain of visuo-motor drive (Goldreich et al. 1992; Schwartz and Lisberger 1994). The gain of the evoked pursuit response depended on whether the monkey was fixating or tracking when the probe was presented, and on the ongoing eye/target velocity during pursuit maintenance. These experiments demonstrate that the pursuit system is engaged to differing degrees during fixation and ongoing pursuit. A deficit in engagement of pursuit was also proposed as an explanation for a number of deficits in sustained eye velocity during the maintenance of pursuit (Grasse and Lisberger 1992; Kiorpes et al. 1996). We have thus assumed that both visuo-motor drive and eye-velocity memory are modulated by the state of engagement of the pursuit system. That the engagement of pursuit influences eye velocity memory was first suggested by Robinson (Luebke and Robinson 1988; Robinson et al. 1986), and is assumed by the pursuit model of Krauzlis and Lisberger (1994). Visual motion thus serves a dual role in pursuit. It is the primary input for the visuo-motor drive of eye acceleration during pursuit, but is also necessary to engage pursuit in the first place.
One approach to understanding the perception and neural processing of visual motion has been to degrade the quality of motion using “apparent motion” stimuli, consisting of flashes of a target at a sequence of positions. Studies of human perception using different types of targets have revealed very different spatial limits for “short-range” and “long-range” perception of motion (Barlow and Levick 1965; Braddick 1980; Newsome et al. 1986; Tyler 1973). Parallel analysis of human motion perception and neuronal responses in awake monkeys have revealed a broad similarity in the spatial limit of motion perception and the spatial limit of direction selectivity for MT neurons (Mikami et al. 1986; Newsome et al. 1986). Previous studies of pursuit eye movements using apparent motion along periodic trajectories have revealed tracking deficits when the flash separation was increased past 80–150 ms (Fetter and Buettner 1990; Morgan and Turnbull 1978; Schor et al. 1984; Van der Steen et al. 1983). However, the continuous nature of the target trajectories used in these prior studies makes it difficult to determine whether the deficits arose because the degraded motion failed to support normal visuo-motor drive of eye acceleration, or because the degraded motion was insufficiently convincing to fully engage pursuit.
We now report the pursuit evoked by step-ramp target trajectories consisting of apparent motion with a range of spatial and temporal separations of the flashes. Our data reveal separable effects of apparent motion on both visuo-motor drive and eye velocity memory. Effects on visuo-motor drive were manifested as changes in the latency and magnitude of eye acceleration at the initiation of pursuit, including a paradoxical facilitation of eye acceleration over a narrow range of parameters. Effects on eye-velocity memory were manifested as sustained maintenance phase eye velocities much lower than target velocity. We interpret eye-velocity memory deficits as resulting from a failure of the visual stimulus to provide a sufficiently convincing motion signal to fully engage pursuit. Our data indicate that the engagement and subsequent visuo-motor guidance of pursuit eye movements both depend on the quality of the visual motion. We suggest that the motion signals governing engagement may not be the same as those driving eye acceleration. While deficits in visuo-motor drive were independent of extra-retinal factors such as eye and target velocity, deficits in eye velocity memory were not.
METHODS
Parameterizing apparent motion stimuli
The solid line in Fig. 1A illustrates the spatio-temporal trajectory of a horizontally moving point. As time passes, the point moves rightward. The filled circles along this line illustrate the trajectory of an apparently moving spot, with spatial and temporal separations Δx and Δt, respectively. The apparent velocity is given by Δx/Δt. Smooth and apparent motion may also be represented in the frequency domain. The transform of a single spot contains a broad range of spatial frequencies. For a smoothly moving spot, each spatial frequency is associated with a different temporal frequency, where velocity = temporal frequency/spatial frequency (Adelsen and Bergen 1985; Watson and Ahumada 1985). The solid diagonal line in Fig. 1B illustrates this relationship. Apparent motion is equivalent to sampling a smoothly moving stimulus and produces aliasing. In the frequency domain aliasing produces “replicas” of the original spatio-temporal frequency content, as shown by the dashed lines in Fig. 1B.
FIG. 1.
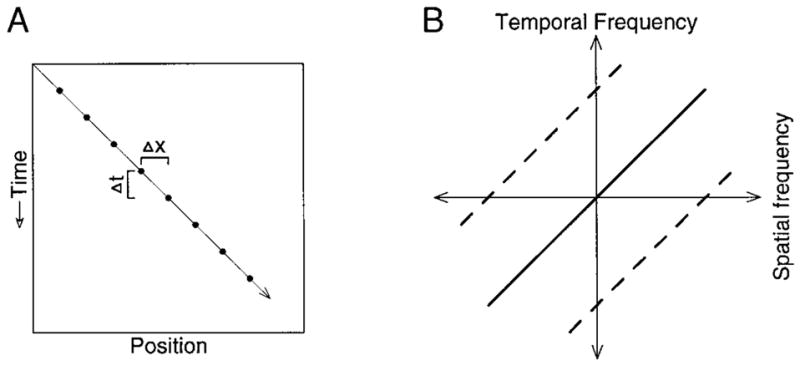
Representation of smooth and apparent motion in the space-time domain (A), and the frequency domain (B). A: time is shown on the y-axis, with downward movement along the axis reflecting the passing of time. Horizontal position is plotted on the x-axis. B: frequency domain representation of the same target motion as in A. Spatial and temporal frequency are plotted on the x- and y-axis with positive values plotted rightward and upward, respectively. The oblique solid line shows the relationship for real target motion at a given speed, while the 2 dashed oblique lines show “replicas” that appear during sampled, or apparent, motion.
The range over which apparent motion effectively emulates real motion can be described in the space-time domain in terms of the effective combinations of Δx and Δt. The same range can also be described in the frequency domain by outlining the “window of visibility”: the range of temporal and spatial frequencies to which the system of interest is sensitive. Apparent motion becomes noticeably un-smooth when the replicas produced by aliasing enter this window of visibility. We choose to describe our stimuli and the effective range of apparent motion in the space-time domain for two reasons. First, the spots we used are simply and intuitively described in the space-time domain. Second, because our stimuli were actually spots, not sine wave gratings, linearity becomes an issue when one attempts to describe the response of either pursuit or of neural motion sensors in terms of the responses to individual frequency components. As an example, some of the components of an apparently rightward moving spot are in fact moving leftward (those aliasing components in the bottom right quadrant of Fig. 1B). A leftward tuned motion sensor would, if linear, respond to these components just as surely as if the stimulus had actually been a leftward moving grating. If nonlinear, the sensor might or might not be expected to respond. Unpublished experiments from this laboratory indicate that many MT cells fail to respond in the way expected given the assumptions of linearity. We therefore choose to describe the limits of apparent motion in terms of maximum Δx and Δt, and not in terms of the border of the window of visibility. This is not to deny that the latter description could be constructed, provided that the relevant nonlinearities were understood and accounted for. Such a description is, however, outside the scope of this paper, the goal of which is to parameterize the limits of apparent motion for pursuit in a simple descriptive manner that might then be compared with a similar description of the effects of apparent motion on the response of the population of MT neurons.
Surgical procedures
Experiments were performed on six adult male rhesus monkeys that had been trained to pursue single moving targets. Our basic experimental methods have been presented before (e.g., Lisberger and Westbrook 1985). Briefly, monkeys were trained to track visual targets and were rewarded with drops of water or Tang. Eye movements were monitored using scleral search coils that had been implanted with the technique of Judge et al. (1980), using sterile procedure while the monkey was anesthetized with Isofluorane. Postsurgical analgesia was provided for a minimum of 2 days with Buprenorphine (0.01 mg/kg every 12 h). During experiments, monkeys sat in a primate chair with their heads affixed to the ceiling of the chair using a dental acrylic fixture that had been implanted at the same time as the eye coil. Experiments lasted 2–3 h. Methods had been approved in advance by the Institutional Animal Care and Use Committee at the University of California, San Francisco.
Visual stimuli and presentation of targets
Stimuli were presented on a 12-in. diagonal analog oscilloscope (Hewlett Packard model 1304, P4 phosphor) driven by the D/A converter outputs from a digital-signal-processing board in a pentium PC computer. This system provided us with a spatial resolution of 65,536 by 65,536 pixels and a maximum temporal resolution of 4 ms (2 ms in a few later experiments). We positioned the display 30 cm from the monkey so that it subtended a vertical visual angle of 40° and a horizontal visual angle of 50°.
Stimuli were sequences of flashes with a wide range of temporal flash separations (Δt) and spatial flash separations (Δx), which were systematically varied. When Δt and Δx were small, the series of flashes produced the perception of a smoothly moving target (Newsome et al. 1986). Thus we will refer to the series of flashes as a target, with a given Δt, Δx, and apparent velocity. As the apparent velocity of a target is given by Δx/Δt, the stimulus is fully defined by any two of these three parameters. To maintain a constant mean luminance of the target, the luminance of each flash was varied linearly with the time between flashes (e.g., if Δt was doubled, so was the luminance of each flash). We adopted this approach instead of the alternative (keeping individual flash luminance constant) because it rendered pursuit targets that appeared to have similar brightness regardless of Δt, and because we anticipated it would avoid changes in pursuit latency that would be a function of luminance rather than of the parameters of the apparent motion itself.
Each individual target flash was very brief. The duration increased with Δt, due to the extra time necessary to increase the luminance. For a Δt of 4 ms each flash lasted approximately 160 μs. Each doubling of Δt doubled this duration, so that for a Δt of 64 ms each flash lasted approximately 2,560 μs. The specifications of the display oscilloscope indicated that the phosphor will decay to 10% of its maximal level in 10 μs to 1 ms. The tracking target was brighter than the fixation point (see next paragraph for description of these targets). Photometer measurements revealed that the fixation target and tracking target had net luminances of approximately 1.6 and 25 cd/m2, respectively. Because targets were small, roughly 0.2° across, these luminances were bright but not dazzling. Experiments were performed in a dimly lit room. Due to the dark screen of the display, background luminance was beneath the threshold of the photometer, less than 1 mcd/m2. Subsequent to an earlier review of this paper, an error was found in the program controlling the visual stimuli. The timing of the second flash in the sequence was often erroneous: the first two flashes would occur immediately following one another, with the specified Δt occurring only between subsequent flashes. This error was not visible to the naked eye, but could certainly have influenced some of our measurements of the effect of apparent motion on the initiation of pursuit, perhaps reducing the size of the observed deficits. All experiments were replicated following correction of the error, using monkeys Na, Ka, and Mo. As all the same effects were observed, we have retained the original data and added the new data to our presentation.
Targets were presented in individual trials that began with the appearance of a fixation point 10° to either the right or left of straight-ahead gaze. The fixation point always had a Δt of 4 ms. The monkey was required to fixate this spot within 600 ms after its appearance and to maintain fixation within a 2° window of target position for 700–1,100 ms. The fixation point was then extinguished and replaced 4 ms later with a tracking target that appeared eccentric relative to the fixation point and immediately began to move toward the position of fixation (Rashbass 1961). For example, a given trial might begin with the appearance of a fixation point to the left of center. When the fixation point disappeared, the target would appear to its left and move rightward. Because of the initial 10° offset of the fixation point, targets were able to traverse up to 35° before reaching the edge of the monitor. The duration of target motion varied from 700 to 2,400 ms, depending on the speed of the target. Quickly moving targets were extinguished when they neared the edge of the screen. In some later experiments, and for velocities faster than 16°/s, the target was not extinguished at the end of its trajectory. Instead, it stepped forward 2–4° and remained stationary for 600–1,000 ms before being extinguished. This helped to minimize the decrease in sustained eye velocity that often occurred near the end of a trial.
Most experiments also included “control trials,” in which the tracking target appeared eccentric to the fixation spot and moved away from the fixation point toward the edge of the monitor that was closest to the fixation point. For all but the slowest velocities, the target neared the edge of the monitor quickly, at which point it stopped and fixation was enforced for up to 1,000 ms. These trials were not analyzed, but were intended to prevent the monkey from predicting the direction of target motion. In some later experiments, control trials were omitted. This had no discernable effect on pursuit within that experimental session, and no anticipatory eye acceleration was observed before the normal onset of pursuit.
Following the onset of target motion, the monkey was given 450 ms to bring his eyes from the initial point of fixation to the target, and was required to track the target with an accuracy of 3°. If the monkey maintained the required fixation and tracking throughout the trial, he was rewarded with a drop of juice. If fixation requirements were not met during a trial, the trial was immediately aborted. For some trials, particularly those with large values of Δx, the size of the fixation window was increased to as large as 9°, to allow the monkey to complete most trials successfully. Each experiment consisted of multiple repeats of a list of up to 132 types of trials, where each trial type presented a different stimulus. The trials were sequenced by shuffling the list and requiring the monkey to complete each trial successfully once. If he failed a trial, it was placed at the end of the list and presented again after all the other trials had been completed. After all trials had been completed once, the list was shuffled and presented again. Monkeys were allowed to work as long as they continued to complete most trials successfully, usually for 2,000–4,000 trials.
The wide range of possible parameters of apparent motion made it impossible to evaluate all parameters within a single experimental session. Instead, we varied different parameters on different days, in experiments designed to be complete along selected axes of the possible parameter space. Because each experiment type required slightly different methods for design and data analysis, we outline separately the five basic classes of experiment reported here.
Experiments using a single target velocity and varying flash separation. All trials had the same target velocity of 18°/s, and up to eight different values of Δt were used. In one later experiment we repeated this experimental design using a target velocity of 3°/s. The goal of this design was to collect large numbers of responses for each flash separation to allow the quantitative analysis of pursuit initiation shown in Fig. 5. In some early experiments additional “catch” trials were run at different velocities, but were not analyzed. Catch trials appear to have no influence on the effects we observed and were not included in all experiments. The initial step of target position relative to the fixation point was set so as to increase the latency of the first saccade (Rashbass 1961). On each experimental day, prior to collection of data, step size was optimized so that saccades were rare during the first 400 ms of pursuit. Depending on the monkey, a step between 2 and 3° was ideal for target speeds of 18°/s. The absence of saccades during the rising phase of pursuit was crucial for the analysis of initial eye acceleration, described below. A drawback of this design is that for a constant apparent velocity, Δt and Δx vary together. It is thus not possible to determine whether changes in pursuit initiation result from an excessive spatial separation or an excessive temporal separation.
Experiments using a single target velocity in which both target eccentricity and flash separation varied. These experiments were similar to those in 1) above, except we varied the size of the initial step of target position and observed the interaction of retinal eccentricity with the effects of flash separation. Within each experiment, the size of the step was randomly varied among 0.5, 3, and 7°. For steps of 0.5 and 7°, saccades were common during the first 400 ms of pursuit. When deficits were absent or small, the majority of responses nonetheless exhibited considerable presaccadic pursuit, with the first saccade occurring near the end of the rising phase of eye acceleration.
Experiments varying both target velocity and flash separation. Both apparent target velocity and Δt (and thus Δx also) were varied systematically. The goal of these experiments was to describe the combinations of Δx and Δt that produced normal initiation of pursuit, and if possible, to isolate independent temporal and spatial limits. The temporal limit would be defined as the maximum Δt for which normal pursuit is evoked, regardless of how small Δx is, and the spatial limit as the maximum Δx, regardless of Δt. As in 1) above, we attempted to optimize the initial step of target position so as to largely eliminate saccades during the rising phase of initiation. Unfortunately, the optimal step size depended strongly on target velocity. It was thus not possible to eliminate early saccades at all velocities without introducing confounding effects from varying the step size. In early experiments (those using monkeys Da and Fi), we used the same starting eccentricity for all target velocities; the tracking target always appeared 3° to one side of the fixation spot. Because targets moving at faster speeds became less eccentric more quickly, the mean eccentricity in the first 100 ms of target motion was different for different target velocities, as was the chance of early saccades. For all later experiments, we set the size of each target step so that mean image eccentricity during the first 100 ms of target motion was 1° on the same side of the fixation spot as the initial position of the moving target. Thus more swiftly moving targets started further eccentric. Both methods of determining starting position provided similar results. The latter method used initial positions that reduced the occurrence of early saccades to some degree, although not nearly as much as if eccentricity had been optimized explicitly to do so. Although these experiments were designed to study pursuit initiation, deficits in pursuit maintenance were also sometimes observed, and we took advantage of these data to examine how the maintenance deficits seen at a given Δt change with target velocity.
Experiments presenting two steps of target velocity. These experiments were designed to compare pursuit responses to a given apparent image motion presented either during fixation or during ongoing pursuit. These experiments included a) control trials in which we recorded the initiation of pursuit for apparent target motion that started at the position of fixation (with no position step) and b) experimental trials in which apparent target velocity changed after pursuit initiation. For the experimental trials, the initial target motion had a Δt of 4 ms so that stable sustained eye velocity was achieved within 400 ms after the onset of target motion. At 480 ms after the onset of target motion, the velocity of apparent target motion increased abruptly without any step of target position and, for most trials, Δt was also changed. Control trials used the same range of Δt as did experimental trials. Thus the single target velocity step of control trials and the second target velocity step of experimental trials produce nearly identical retinal image motions. In both, the target velocity step occurred at a time when the target image had been nearly stationary on the retina with a Δt of 4 ms. In both, the step produced a moving retinal image with a given apparent velocity, Δt, and Δx. Due to the lack of target position step, saccades before the end of the rising phase of pursuit were common for these experiments, although considerable presaccadic pursuit was nonetheless seen. A modification of this experiment was used to study sustained eye velocity during pursuit maintenance. For this modification only, a step of apparent target velocity at a given Δt was followed 480 ms later by a second step of the same size, with Δt held constant after the first step.
Experiments in which Δt was increased during the maintenance of pursuit. The goal of these experiments was to study the effect of Δt on pursuit maintenance after eye velocity had reached target velocity. Pursuit was evoked with steps of apparent target velocity. In experimental trials, Δt was initially 4 ms but increased to a larger value after stable tracking had been achieved. In control trials, Δt was set to the same value when the target first began to move.
FIG. 5.

Separate effects of varying Δt on peak eye acceleration and acceleration latency for 4 monkeys. ●, peak eye acceleration; ◇, acceleration latency as a function of Δt. Apparent target velocity was 18°/s for monkeys Mo, Na, and Ka and 16°/s for monkey El. Acceleration was normalized by the average value when Δt was 4 ms and is plotted relative to the left-hand vertical axis. Latency is shown as the time shift from the average value when Δt was 4 ms and is plotted against the right-hand vertical axis. Values below the dashed line indicate decreases in acceleration and increases in latency. Error bars show the standard error of the mean and are omitted when smaller than the symbol. Asterisks indicate significant changes from the values at 4 ms (2-tailed t-test, P < 0.05). Graphs for monkeys Mo, Na, and Ka show responses to rightward target motion taken from experiments using a single apparent target velocity. Both directions are shown for monkey El, who exhibited an exceptional pattern of deficits in his rightward pursuit only.
Data acquisition
Experiments were controlled and data were acquired by computer programs running on a UNIX workstation and a Pentium PC. The workstation provided a graphical user interface for the design and control of the experiment, and the PC acted as a data-server and streamed the data over the local area network for storage on the UNIX file system. We obtained voltages proportional to eye velocity by analog differentiation of the eye position outputs from the search coil electronics (DC-25 Hz, −20 dB/decade), and we sampled voltages proportional to horizontal and vertical eye position and eye velocity at rates of 1,000 samples/s per channel. In each file, we also recorded a series of codes to indicate the target motions we commanded, and we used these codes in the data analysis program to reconstruct horizontal and vertical target position and velocity.
Data analysis for the initiation of pursuit
Pursuit initiation was analyzed for experiment types 1) through 4) above. Eye velocity and position traces were initially viewed on a computer monitor and screened according to criteria that depended on the exact analysis to be done. The changes in pursuit initiation produced by apparent motion are illustrated using averages of the eye velocity response, often with eye velocity traces from individual trials superimposed. Our methods of averaging are described in more detail in a later section. Further quantification of the changes in pursuit initiation depended on the type of experiment and the prevalence of early saccades. For experiments of type 1), the great majority of saccades were delayed until after the initiation of pursuit was over. This afforded the opportunity to observe the effects of apparent motion on both peak initial eye acceleration and the latency of initial eye acceleration. For this analysis only, we smoothed the individual eye velocity traces by convolving them with a Gaussian having a standard deviation of 20 ms. For each trial we then differentiated, measured the peak eye acceleration, and estimated a value that we call “acceleration latency”: the time when eye acceleration reached 63% of its peak value. For the vigorous eye accelerations evoked by fast target velocities, measurements made using the 63% criterion were typically slightly more robust than similar measurement using the time-to-peak eye acceleration. In practice, we were interested in changes in latency, and these differed only slightly whether calculated using the peak of eye acceleration, or using the 63% point. In one experiment, when target velocity was 3°/s, we did in fact use the time-to-peak eye acceleration to calculate latency, as this measure was more robust in the presence of a low signal-to-noise ratio. We chose not to use the time of the actual onset of pursuit (when initial eye acceleration first began) as a dependent variable. Estimates of the actual onset of pursuit can be made reliably by human observers for target motions that evoke sufficiently crisp initiation of pursuit that eye velocity quickly exceeds measurement noise. However, human observers cannot make such reliable estimates for low target velocities or for parameters of apparent motion that evoke lower initial pursuit eye accelerations. Numerical algorithms suffer related drawbacks. Moreover, as we shall see, a consistent effect of apparent motion was to increase the latency to normal acceleration. Effects on absolute latency were less consistent.
For all other experiments concerning the initiation of pursuit (2–4 above), saccades during the rising phase of pursuit were common. It was therefore impossible to make the acceleration based measurements, as peak acceleration was potentially obscured by a saccade. However, at least when Δt was small, and deficits absent to moderate, most early saccades occurred near the end of the rising phase of pursuit, at least 50–100 ms after initiation. We therefore chose to assess initiation by measuring eye velocity at a fixed time, after normal pursuit onset but before saccades occurred. We defined the “normal” time of pursuit onset using the average eye velocity when Δt was 4 ms. For all trial types we then measured eye velocity at a fixed time following the normal onset. This method is illustrated in Fig. 6. The measurement time was selected to fall during the rising phase of pursuit, as close as possible to the end of the open loop interval, and before the time of most saccades. The exact time ranged from 50 to 70 ms and depended on the duration of the open loop interval of the monkey being studied. Minor errors in estimating either the duration of the open loop interval or the time of the onset of pursuit would not have had a major impact on this analysis, as the same measurement time was used for all values of Δt at a given apparent target velocity.
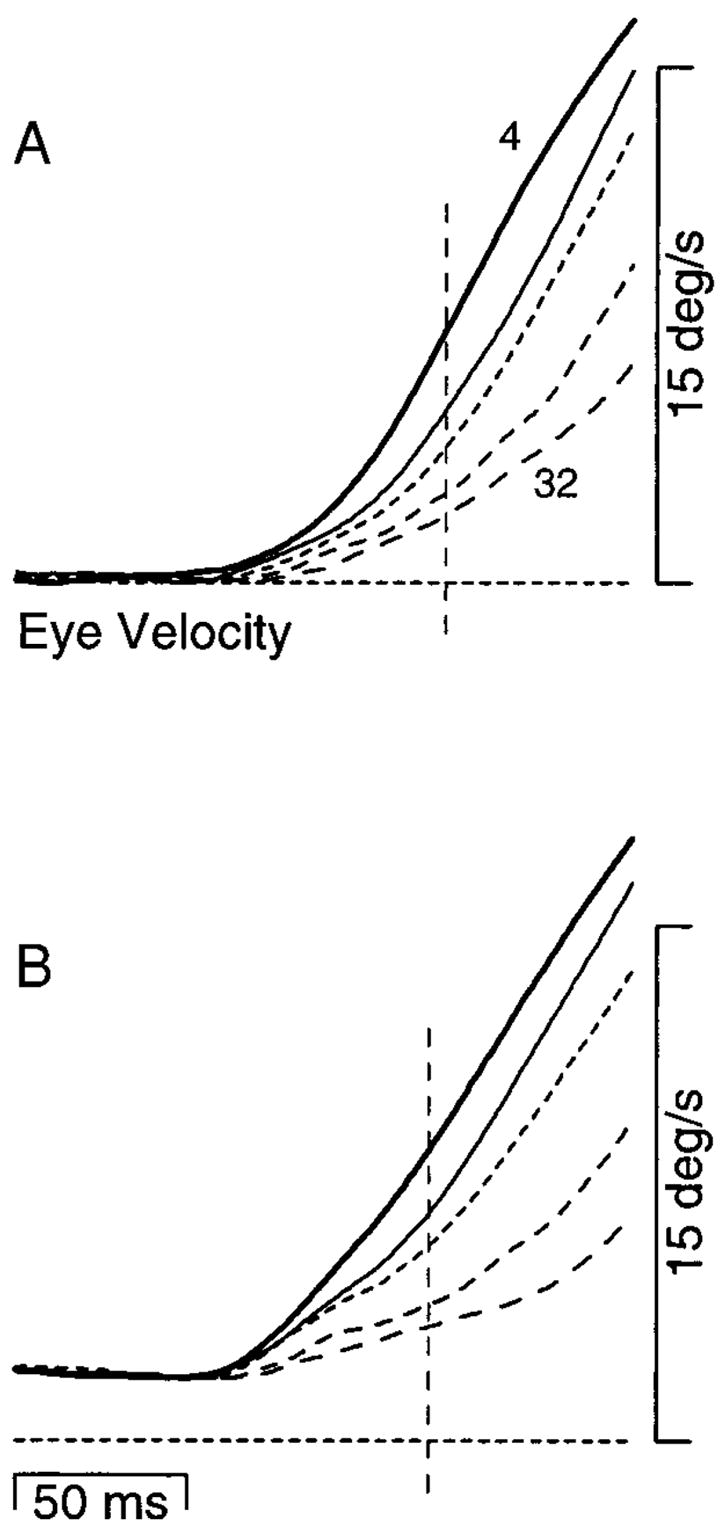
FIG. 6.
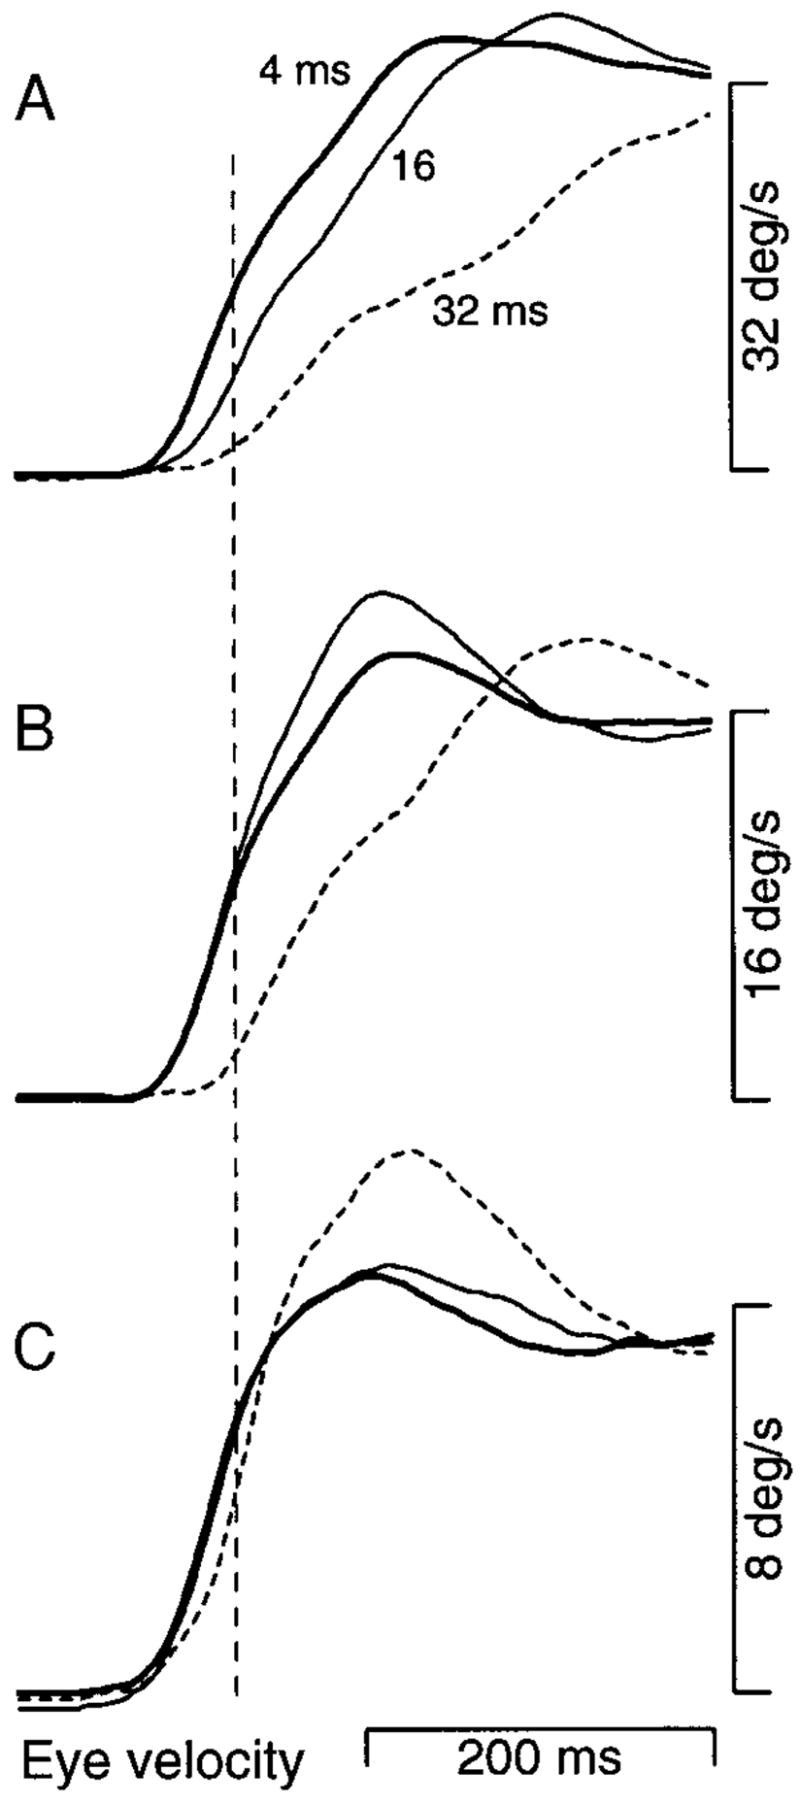
Average eye velocity traces showing how the effect of varying Δt depends on the apparent target velocity. Apparent target velocities were 32°/s (A), 16°/s (B), and 8°/s (C). The different trace types show responses for different values of Δt: bold, 4 ms; fine, 16 ms; short dashes, 32 ms. Traces begin at the onset of target motion. To allow comparison of deficits, responses are scaled relative to the target velocity that evoked them. The vertical dashed line was placed 50 ms after the onset of pursuit when Δt was 4 ms and illustrates how we selected a measurement time that was used to extract the eye velocity measure used in later figures. Data were obtained from monkey Mo in an experiment that used only 3 target velocities. Each average was constructed from at least 45 individual traces.
We discussed above three scalar measures of pursuit initiation: peak acceleration, acceleration latency, and eye velocity at a fixed time. When a given measure was made, it was made for each individual trial of a given type. Averages and standard errors were then calculated. For experiments of type 3) above, responses to target velocities below approximately 4°/s suffered from a signal-to-noise problem. Large numbers of trials (at least 20–50) were needed to make accurate measurements of eye velocity at a fixed time. As these experiments employed a range of velocities and many trial types, it was often not possible to collect more than 20 trials of each type (some of which would have to be excluded because of early saccades, as described below). Measurements at low velocities were therefore sometimes quite variable, preventing us from analyzing pursuit for target speeds slower than 2°/s.
In examining the initiation of pursuit, we were primarily interested in changes in the pursuit trajectory, rather than in the absolute values of latency, eye velocity, or eye acceleration. Thus the three measures described above are expressed in normalized form. Peak acceleration is expressed as the proportion of the average peak acceleration seen for the same target velocity when Δt was 4 ms. The eye velocity measure is normalized by the average eye velocity at the same fixed time when Δt was 4 ms. Acceleration latency is expressed as the time shift relative to the average acceleration latency measured when Δt was 4 ms. An assumption of much of our analysis is that a Δt of 4 ms produces normal pursuit, and that the pursuit response to such targets would not have changed had we been able to decrease the temporal separation further. This appears likely for two reasons. First, with the exception of the highest apparent target velocities (32–45°/s), pursuit performance was not altered by doubling the temporal separation to 8 ms. For the highest target velocity of 45°/s, a Δt of 4 ms is probably only just acceptable, as doubling Δt to 8 ms does produce a small deficit. Second, in some later experiments, we were able to test performance at a Δt of 2 ms, revealing that it was identical to performance when Δt was 4 ms, even for target motion at 45°/s.
For all analyses, the onset of target motion was defined to be coincident with the first flash of the tracking target. However, no directional information is available until after the second flash. It might therefore appear that the onset of target motion should be defined as the time of the second flash, and that effects of varying Δt should be assessed after aligning the responses at this time. However, a simple example illustrates how aligning the data on the second flash would introduce artifacts. At many target velocities, pursuit initiation was identical when Δt was 4 and 16 ms. If we had aligned these responses on the second flash by shifting the response 12 ms left when Δt was 16 ms, then we would have found that pursuit initiation was earlier when Δt was 16 ms than when Δt was 4 ms. We thus opted not to shift the timing of the responses, even though it is to be expected that initiation deficits at large values of Δt will be due at least partially to the delay in motion information until after the second flash.
Exclusion of trials with early saccades for analysis of the initiation of pursuit
In all analyses of pursuit initiation, some trials inevitably contained saccades that made the chosen measurement impossible. The analysis of acceleration described above was employed when saccades were rarely observed during the rising phase. However, the occasional saccade still fell within the rising phase. Similarly, the analysis of eye velocity at a fixed time was occasionally confounded by a saccade at or before that time. In such cases the trial was typically excluded from analysis. A sole exception was made in the analysis of acceleration. Some longer values of Δt produced initiation so delayed and slow that there were often saccades during the rising phase. Such trials were included (after interpolation of saccades, see next section) so long as saccades were delayed by at least 400 ms following target motion onset. To the degree that linear interpolation of saccades is imperfect, measurements of the precise size of large initiation deficits will be imperfect.
Trials with saccades before or during the measurement interval were excluded not only because saccades obscure pursuit eye velocity, but also because saccades are known to enhance subsequent pursuit (Lisberger 1998). If we had included measures made after the first saccade in our analyses of the initiation of pursuit, then postsaccadic enhancement of pursuit might have created effects that resulted indirectly from the relationship between different targets and the latency of the first saccade. However, exclusion of trials with early saccades raises the concern that early saccades occurred primarily when pursuit was deficient, and that the exclusion of trials with early saccades might therefore reduce the visibility of deficits. We spot-checked a handful of cases in which early saccades were common, comparing presaccadic pursuit when saccades were early in initiation to that when saccades were late. The magnitude of presaccadic eye acceleration was uninfluenced by the timing of subsequent saccades, and no consistent or statistically significant effects were seen.
In instances when the majority of responses contained early saccades, we did not attempt to analyze the data. For experiments using a range of apparent target velocities and values of Δt, the leftward pursuit of two monkeys (Fi and Ka) had to be discarded because early saccades were very common at slower apparent velocities. For experiments that varied the eccentricity of the moving targets, monkeys El and Da were unable to provide sufficient usable responses. Some monkeys had very few early saccades (Mo and Na in both directions, and Ka in the rightward direction) and were particularly useful in experiments in which eccentricity could not be optimized. We realize that the prevalence and latency of early saccades in response to step-ramp targets varies among publications from different laboratories, and we attribute the delayed saccades and excellent presaccadic pursuit in many of our monkeys to the extensive experience they have with targets that could be tracked successfully with very few saccades.
Data analysis for the maintenance of pursuit
For analysis of the maintenance of pursuit, saccades were excised from each individual eye velocity trace, either by a user-supervised and verified semi-automatic algorithm or by using a cursor to point out the start and end of each rapid deflection of eye velocity. Each rapid deflection was replaced with a line segment that connected the eye velocities before and after the excision. Eye velocity traces then were aligned on the onset of target motion, averaged, and filtered with a 25-Hz digital filter. This cutoff frequency reduced noise with no noticeable effects on the basic trajectory of either the initiation or maintenance of pursuit. For the maintenance of pursuit, our main documentation of the effects of changing the parameters of apparent motion consists of averages of eye velocity as a function of time. However, we will also show that average eye velocity traces are representative of single trial performance during both the initiation and maintenance of pursuit.
The analysis of pursuit maintenance necessarily includes epochs of pursuit that contain saccades. Nearly every pursuit response contained at least one saccade during maintenance. Experimental manipulations that impair pursuit maintenance further increase the prevalence of saccades, both in prior studies (Dursteler and Wurtz 1988; Dursteler et al. 1987) and in our data. It was thus necessary to analyze pursuit in a way that preserved as best as possible the eye velocity component produced by the pursuit system, but ignored the eye velocity component produced by the saccadic system. Inspection of our data showed relatively little change in smooth eye velocity before and after saccades during the maintenance of pursuit, implying that linear interpolation across the excised saccadic eye velocity is valid during the maintenance of pursuit. Saccades sometimes facilitated eye velocity during maintenance, but this effect was small. Another workable method is to excise each saccade, but to treat the missing time points as missing data during averaging. This approach essentially replaces each saccade with averaged data from other trials that do not have a saccade at that time. This approach only appears to avoid the necessity of interpolation. The replacement data may or may not be a good estimate of the saccade-obscured pursuit for that particular trial. Averages of excised data are particularly unlikely to provide a good estimate of the excised pursuit if maintained pursuit eye velocity varies from trial to trial, as was often the case when maintenance was impaired. In fact, both methods in practice provide very similar results during maintenance. Still, the method of saccade replacement by linear interpolation seemed better suited to our purposes. It should be noted that the maintenance deficits we observe below are large and could be neither produced nor obscured by any reasonable method of dealing with saccades.
RESULTS
Figure 2 shows a typical pursuit response for a target that moved with an apparent velocity of 22°/s and a Δt of 16 ms. Although the stimulus consisted of sequential flashes of a stationary target at the times indicated by dots, both the eye position and velocity profiles appear normal (e.g., Lisberger and Westbrook 1985). Pursuit began about 100 ms after the onset of target motion: the eye accelerated rapidly toward target velocity, and maintained eye velocity settled near target velocity with only small fluctuations. The first saccade (arrows on the eye position and velocity traces) occurred more than 200 ms after the initiation of pursuit, after the end of the initial rising phase.
FIG. 2.
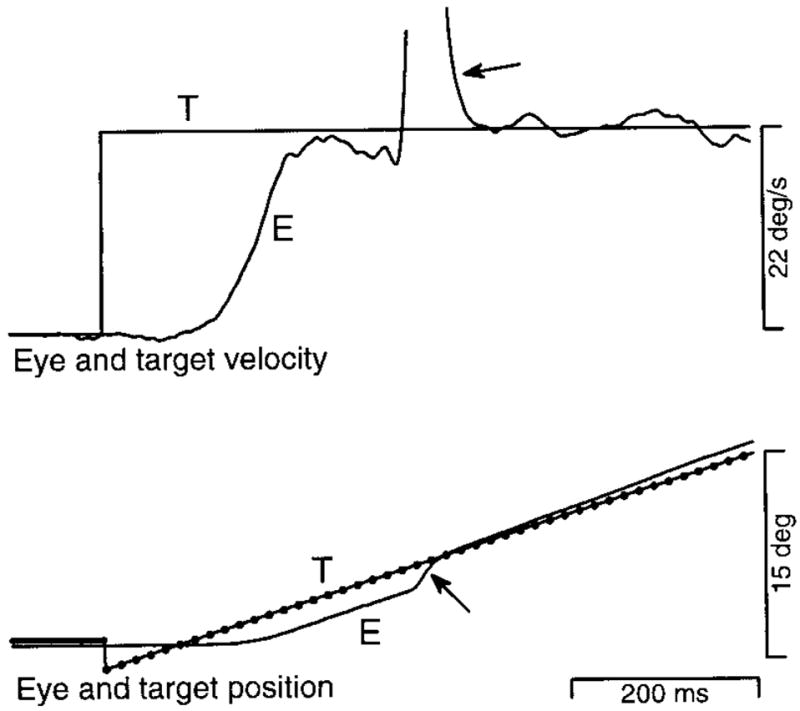
Single trial record showing a representative response to target motion at an apparent velocity of 22°/s, with a Δt of 16 ms. The top and bottom pairs of traces superimpose target (T) and eye (E) velocity and position, respectively. The dots on the target position trace indicate the time and position of each flash of the apparent motion target. The arrow on the eye position trace points out a saccade. The arrow on the eye velocity trace points out the (truncated) rapid upward deflection caused by the saccade. The traces begin 100 ms before the step-ramp of target motion, and about 1,000 ms after the onset of the trial. Upward deflections of the traces indicate rightward motion.
Pursuit initiation shows changes with increasing flash separation
In the first part of the paper, we analyze deficits in the presaccadic initiation of pursuit. In so doing, we explicitly avoid showing examples of deficits in the maintenance of pursuit, which are analyzed in the second part of the paper. Apparent motion had effects of three types on pursuit initiation: 1) increases in the latency to peak eye acceleration, 2) decreases in peak eye acceleration, and 3) unexpected increases in peak eye acceleration. The left column of Fig. 3 illustrates an effect of the first type. Figure 3A shows 10 single trial responses (thin traces) of monkey Ka to target motion with an apparent velocity of 16°/s and Δt of 4 ms. These traces are superimposed on the average response for all trials of this type (bold trace). Figure 3B shows a similar plot for target motion at the same apparent velocity but with a (longer) Δt of 32 ms. The average responses in Fig. 3, A and B, are similar in that both exhibit crisp initial eye acceleration, a small overshoot of target velocity, and a steady-state gain of near unity. Comparison of the averaged and individual traces shows that the individual traces are well represented by the averages. Superposition of the two averages of eye velocity (Fig. 3C) reveals that peak initial eye acceleration was delayed when Δt was 32 ms, although the magnitude of peak eye acceleration appears similar. Note that the latency to the onset of pursuit appears little affected: it is the latency to normal eye acceleration that increased. Subsequent figures show examples where the onset of pursuit was also delayed. Effects of apparent motion on the latency of the onset of pursuit were generally less consistent than the effects on the latency to peak eye acceleration. We term this latter measure “acceleration latency.”
FIG. 3.

Effect of varying Δt on the time course of the initiation of pursuit in one monkey. In A, B, D, and E, the fine and bold traces show 10 subsequent individual responses and averages of all 17–20 responses, respectively. A: responses to apparent target velocity of 16°/s when Δt was 4 ms. B: responses to apparent target velocity of 16°/s when Δt was 32 ms. C: the average responses from A and B are shown superimposed for comparison. Numbers next to each trace indicate the value of Δt used to obtain that average. D: responses to apparent target velocity of 32°/s when Δt was 4 ms. E: responses to apparent target velocity of 32°/s when Δt was 48 ms. F: the average responses from D and E are shown superimposed for comparison, along with the average response when Δt was 24 ms. All traces begin at the onset of target motion. Traces for individual responses are interrupted during saccades. Both target motion and the pursuit response continued for 500–1,000 ms after the portion of the response shown. These examples were drawn from experiments using multiple target velocities in monkey Ka, and not from the experiments shown in Figs. 4 or 5. Although flash separation is indicated in terms of Δt, Δx and Δt change together for target motion at a constant speed.
In addition to producing increases in the acceleration latency, increases in Δt often produced decreases in peak eye acceleration. For example, Fig. 3D shows responses of monkey Ka to target motion at an apparent velocity of 32°/s and Δt of 4 ms. Figure 3E shows a similar plot for data obtained when Δt was increased to 48 ms. Superposition of the average eye velocity traces for different values of Δt reveals a clear progression of deficits (Fig. 3F). Increasing Δt from 4 to 24 ms caused an increase in acceleration latency accompanied by a small decrement in initial eye acceleration. A further increase of Δt to 48 ms (dashed trace) caused a larger increase in acceleration latency and a clear decrement in initial eye acceleration. For all three values of Δt, eye velocity eventually reached a sustained value that was close to target velocity. Note in Fig. 3, D and E, that the averages made after linear interpolation across excised saccades provide a reasonable estimate of pursuit eye velocity during the period obscured by the saccades. Of course, there is no way of directly observing the underlying pursuit eye velocity during this period. Therefore all subsequent quantitative analysis of pursuit initiation is limited to time periods that were saccade free.
Analysis over a finer grain of values for Δt revealed that as Δt was increased, initial eye acceleration at first increased and began to decrease only for still larger values of Δt. These effects are illustrated in Fig. 4 using averages of eye velocity and acceleration. For the experiment summarized in Fig. 4A, an increase in Δt from 4 ms (bold traces) to 32 ms (fine traces) caused an increase both in acceleration latency and in peak eye acceleration. Further increases in Δt to 48 ms (dashed traces) caused the expected decrease in peak eye acceleration. For the experiment summarized in Fig. 4B, peak eye acceleration increased as Δt was increased from 4 to 16 ms. Peak eye acceleration remained above normal at a Δt of 20 ms and was reduced when Δt was 32 ms. The latency to peak acceleration increased when Δt was 20 ms or larger.
FIG. 4.

Effect of varying Δt on the time course of average eye velocity and acceleration. Top and bottom groups of superimposed traces show average eye velocity and acceleration for multiple values of Δt. A: responses of monkey Ka to an apparent target velocity of 16°/s. Numbers next to the eye velocity traces indicate the value of Δt. Data were taken from an experiment using a range of velocities. B: responses of monkey Na to an apparent target velocity of 18°/s. Data were taken from an experiment using only one target velocity. For the data shown in both A and B, saccades occurred well after the peak of eye acceleration except for the longest values of Δt when they occurred just following the peak. Traces begin at the onset of target motion.
The increases in peak eye acceleration were not due to any effects of saccades, as all the above described data were collected under conditions that produced few saccades during the initiation of pursuit, and rare trials with saccades before the peak of acceleration were excluded from the analysis. Neither do the increases in peak eye acceleration result from any compensation for the longer latency of pursuit. This explanation assumes the pursuit system knows it is “behind,” and compensates to “catch up.” This is unlikely, as the increase in acceleration was regularly observed within the open loop interval (60–80 ms), before visual feedback could have any impact. Further, the increase in acceleration cannot result from compensation for increased latency, as it occurred even when pursuit initiation was not delayed (e.g., Fig. 4B and Fig. 5, monkeys Mo and Na). We therefore postulate that the increase in initial eye acceleration results because the relevant flash separations produce a larger than normal image velocity signal. This explanation is developed further in the discussion.
As Δt increased, changes in acceleration latency and peak eye acceleration followed different trajectories. We measured peak eye acceleration and the acceleration latency for each individual trial, as described in Methods. The graphs in Fig. 5 compare the progression of changes in these two measures as a function of Δt. Target velocity is held constant within each graph. Data are shown for four monkeys. Average peak eye acceleration (●) is plotted as a fraction of that obtained when Δt was 4 ms. Average acceleration latency (◇) is plotted as the time shift from when Δt was 4 ms. Sign conventions were chosen so that the horizontal dashed line shows normal performance and deficits are plotted as decreases on either y-axis. In the three examples in the left column, latency began to increase when Δt exceeded 16 ms and increased progressively as a function of Δt. Peak eye acceleration first increased, starting with values of Δt as low as 12 ms, and then declined below normal only for relatively large values of Δt. Statistically significant latency increases, peak acceleration increases, and peak acceleration decreases were observed in the experiments using Mo, Na, and Ka. The responses of monkey El are discussed below.
The three experiments shown in the left column of Fig. 5 were designed to reveal the typically small increase in eye acceleration that occurs over a narrow range of flash separations. These experiments also illustrate a more general finding. As Δt was increased, deficits in acceleration latency were produced prior to the production of deficits in the magnitude of eye acceleration (although not necessarily before the production of increases in eye acceleration). For the plots in the left column, the open symbols denoting acceleration latency are always below the filled symbols denoting peak acceleration. This pattern was consistently observed for all experiments and all monkeys, with a single exception, illustrated in the bottom right panel. For rightward moving targets, monkey El showed the inverse pattern: as Δt increased, eye acceleration was significantly reduced at values of Δt that did not cause any increase in acceleration latency. We do not know why the changes observed in the rightward pursuit of monkey El are so atypical. However, the rightward pursuit of monkey El was unusual in a number of other respects and had an onset latency of 130 ms, nearly twice that of most monkeys and of monkey El’s own leftward pursuit. The leftward pursuit of monkey El shows the more typical pattern: deficits are observed in acceleration latency before any deficits are observed in peak eye acceleration. For the leftward pursuit of monkey El, the lack of statistically significant increases or decreases in eye acceleration were probably due to an insufficient number of trials and to the limited range of values of Δt employed, as both effects were observed in other experiments using the same monkey (data not shown).
Spatial and temporal limits on the initiation of pursuit
The above-described results reveal that apparent motion causes consistent deficits in pursuit, but do not reveal the cause of the deficits. At a given target velocity, Δt and Δx increase together. To ask whether the spatial or temporal separation between flashes is the limiting factor, we observed the effect of a given Δt at multiple target velocities. The same Δt is associated with large values of Δx at high velocities and small values of Δx at low velocities. Figure 6 shows the time course of average eye velocity during the initiation of pursuit at three apparent target velocities and three values of Δt. For a target speed of 32°/s (Fig. 6A), deficits in the initiation of pursuit were present at values of Δt as low as 16 ms and became severe when Δt was increased to 32 ms. As target speed was lowered, the deficit associated with each value of Δt was reduced. For a target speed of 16°/s (Fig. 6B), a deficit was visible only when Δt was 32 ms (dashed trace). For a target speed of 8°/s (Fig. 6C), the deficit was mild even when Δt was 32 ms. That the deficits associated with a given Δt are diminished as target velocity decreases indicates that they are related to the decreasing spatial separation.
These effects are quantified in Fig. 7, which shows the effect of target speed on the magnitude of deficits in the initiation of pursuit for two values of Δt in three monkeys. In these experiments, it was not possible to optimize all trial types so as to minimize early saccades while maintaining the same starting eccentricity across velocities (see Methods). As a result, peak eye acceleration often was obscured by saccades, especially for flash separations that produced increases in latency. To circumvent these problems, we measured average eye velocity at a fixed presaccadic time during the rising phase of pursuit (vertical dashed line in Fig. 6) and normalized by the average eye velocity evoked at the same time, by the same target velocity, when Δt was 4 ms. Normalized eye velocities less than one indicate initiation deficits. This metric does confound the effects of increases in acceleration latency and decreases in eye acceleration and indicates only the degree to which pursuit initiation is normal or abnormal without indicating the nature of the underlying deficit. However, small to moderate decreases in normalized eye velocity were caused primarily by latency deficits, as these appeared first.
FIG. 7.
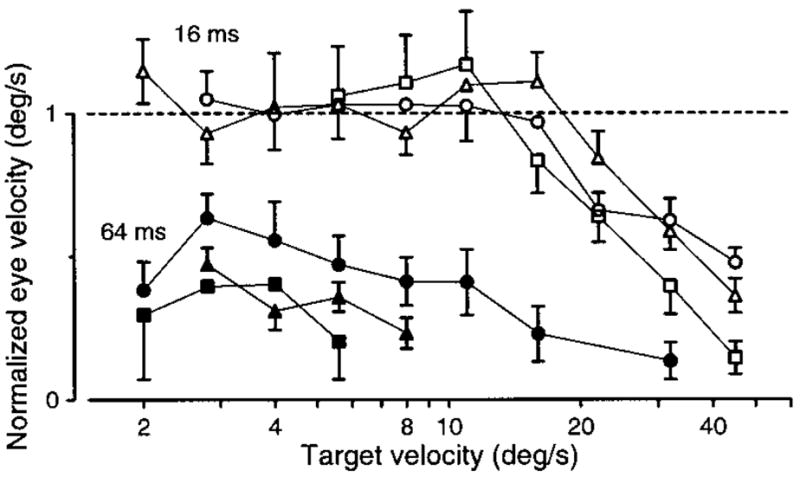
Effect of varying apparent target velocity on the initiation of pursuit at 2 values of Δt. The y-axis plots normalized average eye velocity measured 50 ms after the initiation of normal pursuit. The time of initiation of normal pursuit was measured when Δt was 4 ms and was measured separately for each apparent velocity. The average eye velocity for a given Δt is normalized by the average eye velocity for normal pursuit; i.e., when Δt was 4 ms. The horizontal dashed line shows a normalized eye velocity of one, which would indicate that eye velocity was the same as when Δt was 4 ms. Values below the dashed line indicate deficits. Open and filled symbols show responses when Δt was 16 and 64 ms. Different symbol shapes show data for monkeys Mo (triangles), Na (squares), and Ka (circles). Error bars show the standard error of the mean. Overlapping error bars have been suppressed.
Inspection of the data in Fig. 7 reveals both spatial and temporal limits on the presaccadic initiation of pursuit. When Δt was 16 ms (open symbols), eye velocity was normal for target speeds up to 12–16°/s and then declined steeply. Because Δt was fixed at 16 ms, the deficits at higher target speeds must be due to an excessive Δx. In contrast, when Δt was 64 ms (filled symbols), eye velocity was not normal even for the lowest target speeds. For such slow target speeds, the values of Δx associated with a Δt of 64 ms were sufficiently small to have evoked normal pursuit initiation when Δt was 16 ms. For example, Δx was identical when Δt was 64 ms at 2°/s and when Δt was 16 ms at 8°/s. Yet eye velocity is normal for the latter parameters and about half normal for the former. We therefore argue that the deficit in the former case cannot be due to Δx and must be due to the fact that Δt was 64 ms. In summary, although in all figures we express the flash separation in terms of Δt, the temporal separation is the limiting factor only for slow target velocities. For faster target velocities, deficits are actually produced by the associated Δx.
For values of Δt < 32 ms, the disappearance of deficits when the target is slowed rules out a tempting explanation for these deficits: that they result from the delay in motion information until after the second flash. This explanation is unlikely for another reason. Latency deficits are often too large to be explained by the separation of the first two flashes. In Fig. 6B, for example, a 16-ms increase in Δt, from 16 to 32 ms, delayed the initiation of pursuit by nearly 40 ms. In each of the graphs in the left column of Fig. 5, the rate of increase in acceleration latency at high values of Δt exceeds the rate of increase in Δt.
To visualize simultaneously the spatial and temporal limits governing pursuit initiation, we measured eye velocity during the initiation of pursuit for a range of combinations of Δt and Δx, where apparent velocity is Δx/Δt. The symbols in Fig. 8 plot normalized eye velocity as a function of Δt and Δx. The magnitude of initial eye velocity is indicated by the size of the symbol, with filled symbols denoting eye velocities within 90% of normal. Although the plots from different monkeys are quantitatively different, there is a broad qualitative pattern. In each graph, the filled symbols denoting normal or nearly normal pursuit cluster in the bottom left corner. The range of parameters that evoked nearly normal eye velocities can be exited by traveling either vertically or horizontally, indicating that normal initiation is bounded by both a spatial and a temporal limit. Traveling vertically within a graph keeps Δt constant, as in Fig. 7, while traveling horizontally keeps Δx constant. Target velocity remains constant along the diagonal lines, at values indicated by the numbers along the top and right sides of each graph. All four monkeys tested with target speeds up to 45°/s showed a limit on pursuit initiation expressed primarily in terms of Δx (Fig. 8, C–F). At lower target velocities, pursuit faltered before this spatial limit was reached, indicating that pursuit initiation is also limited by Δt. The temporal limit is particularly clear in Fig. 8B. Defined as the point at which eye velocity falls below 90% of normal, the spatial limit lay between 0.2 and 0.4° for five monkeys, and between 0.5 and 1° for the sixth (Fi). The temporal limit lay between 32 and 64 ms. The plots are somewhat noisy, especially at low target velocities, because of the large number of trial types used in these experiments.
FIG. 8.

Temporal and spatial limits of apparent motion for the initiation of normal pursuit. Each graph contains one symbol for each combination of temporal separation (Δt) and spatial separation (Δx). The symbol type expresses mean eye velocity as a percentage of that evoked by targets of the same apparent velocity but with a Δt of 4 ms: large solid circles, eye velocity within 90% of normal; large open circles, eye velocity within 80–90% of normal; progressively smaller circles indicate progressively slower eye velocities as defined by the key in B. The diagonal lines correspond to fixed values of apparent target velocity, indicated by the numbers along the top and right edges of each panel. A and B: experiments designed to tile a large range of possible values of Δt and Δx (monkeys Da and Fi). C–F: experiments using a closer spacing of values of Δt and Δx over a more limited range, to allow a more complete sampling of the range where pursuit initiation becomes impaired (monkeys El, Mo, Na, and Ka). Each point is based on the mean eye velocity in a 20-ms interval centered 70 ms after the initiation of normal pursuit for monkeys Da, Fi, and El, and centered 50 ms after the initiation of pursuit for monkeys Mo, Na, and Ka.
Deficits observed when Δx becomes too large are assumed to arise because the spatial integration ability of neural motion sensors is exceeded. Are the deficits observed when Δt becomes too large related to the temporal integration time of neural motion sensors? We concluded above that deficits seen when Δt was 32 ms or less were not due to the delay in motion information until the second flash, as they disappeared when the target was slowed. However, this conclusion does not apply to the deficits observed when Δt is large, which persist at slow target velocities. In the extreme, delays in the arrival of motion information obviously must contribute: a monkey with a pursuit latency of 80 ms could not initiate normal pursuit when Δt is 96 ms. Still, there is some reason to believe that initiation deficits seen when Δt is large result in part from a failure of neural motion sensors. Figure 9 plots peak eye acceleration and acceleration latency as a function of Δt for monkey Ka at a target velocity of 3°/s. Little or no deficit is observed when Δt is 32 ms, while a large latency deficit is observed when Δt is 64 ms. Latency increased 55 ms, while Δt increased only 32 ms. The deficit is 23 ms larger than expected if the latency increase were due solely to the additional 32-ms delay between the first and second flash. As Δx is 0.192° when Δt is 64 ms, just below the spatial limit of 0.2–0.4° seen for Ka in Fig. 8, the additional 23 ms of delay are probably not the result of excessive spatial separation. This suggests that while a Δt of 32 ms is within the integration time of the neural motion sensors driving pursuit, a Δt of 64 ms produces deficits in part because it exceeds the temporal integration time. A similar argument can be based on the deficits in eye acceleration seen in Fig. 9. These deficits appeared when Δt was 64 ms or longer, corresponding to a Δx of 0.19°. At higher target velocities, a Δx of at least 0.58° was necessary to produce deficits in eye acceleration. Thus it appears likely that, at least to some degree, deficits produced by large Δt’s result because the stimulus exceeds the temporal integration abilities of neuronal motion sensors. These conclusions should, however, be viewed as tentative, in part because they rest on the assumption that the spatial limit is similar across velocities. This assumption may be true only to a first approximation. Figure 9 shows data only for monkey Ka because only this monkey produced sufficiently regular pursuit at low velocities to allow an analysis of eye acceleration in individual trials. However, similar effects were observed in the averaged eye velocity traces of other monkeys (data not shown).
FIG. 9.
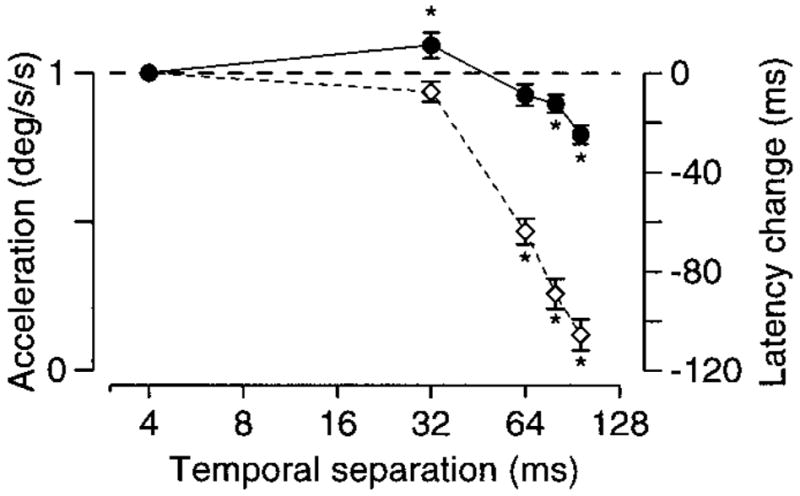
Effect of varying Δt on the initiation of pursuit for a target velocity of 3°/s. Filled symbols show eye acceleration, normalized to the average value when Δt was 4 ms and plotted relative to the left-hand vertical axis. Open symbols show latency, calculated as the time-to-peak eye acceleration and plotted relative to the right-hand vertical axis as the time shift from the average value when Δt was 4 ms. Values below the dashed line indicate decreases in acceleration and increases in latency. Asterisks mark data points that differed significantly from the value when Δt was 4 ms (2-tailed t-test, P < 0.05). Error bars show the standard error of the mean and are omitted when obscured by the symbols. Data are from monkey Ka.
Spatial limit is eccentricity dependent
In humans, the spatial limit governing the perception of short range apparent motion has been shown to increase with eccentricity (Braddick and Baker 1985). The spatial limit governing the direction selectivity of MT neurons shows a similar increase with eccentricity (Mikami et al. 1986). To determine whether the spatial limit governing pursuit initiation was eccentricity dependent, we measured the effect of changing Δx on the initiation of pursuit for three values of initial target eccentricity. Target velocity was 18°/s. Different eccentricities were created using initial target position steps of different sizes. The three sets of traces in the left column of Fig. 10 show averaged eye velocity as a function of time and illustrate typical deficits. Flash separation is expressed in terms of Δt, but, given the results described in previous figures, it is presumed that, for Δt < 32 ms, deficits arise from the associated value of Δx. When eccentricity was 0.5° (Fig. 10A), deficits in the initiation of pursuit appeared when Δt increased from 4 ms (bold, solid trace) to 16 ms (fine, solid trace) and worsened when Δt was increased further to 24 ms (dashed trace). When eccentricity was 3° (Fig. 10B), deficits were observed only when Δt increased from 16 to 24 ms. When eccentricity was 7° (Fig. 10C), there was little deficit in the initiation of pursuit even when Δt was 24 ms.
FIG. 10.

Effect of target eccentricity on the initiation of pursuit to apparent motion. Each row of traces and bar graphs shows data for a single starting target eccentricity. A and D: 0.5°. B and E: 3°. C and F: 7°. A–C: average eye velocity responses of monkey Na to apparent target velocity at 18°/s. Bold, fine, and dashed traces show responses when Δt was 4, 16, and 24 ms, respectively. Traces begin at the onset of target motion. Vertical dashed lines show the measurement time used to create the bar graphs, 50 ms after the initiation of pursuit when Δt was 4 ms. Each trace is an average constructed from at least 40 responses to a given apparent target motion. D–F: bar graphs showing eye velocity, measured at the time of the dashed line, as a function of Δt for 3 monkeys. In each panel, the 3 groups of histogram bars show data from 3 monkeys. Each group of 4 bars summarizes the effect of Δt for a given monkey at one eccentricity. Numbers below each bar indicate the value of Δt used to obtain those data. Error bars show the standard error of the mean.
Using the methods described earlier, we quantified the effects of eccentricity in three monkeys by measuring average eye velocity 50 ms after the normal time of initiation. This measurement time is indicated by the dashed vertical lines in Fig. 10, A–C. The histograms at the right of Fig. 10 show how changes in flash separation affected the initiation of pursuit for targets presented at different eccentricities. Each panel represents a given eccentricity and contains three groups of histogram bars, one group for each monkey. The four bars within each group correspond to four values of Δt. All monkeys showed the same basic effects. When eccentricity was 0.5° (Fig. 10D), initial eye velocity declined consistently as a function of Δt, starting when Δt increased from 4 to 16 ms. When eccentricity was 3° (Fig. 10E), initial eye velocity did not decline until Δt was at least 24 ms. When eccentricity was 7° (Fig. 10F), the only clear declines in initial eye velocity occurred when Δt increased from 24 to 32 ms. Thus the effect of increasing the flash separation was reduced at larger eccentricities. Again, although flash separation is expressed in terms of Δt, most deficits are expected to be due to the spatial flash separation. Deficits first appeared at values of Δx around 0.29° (Δt = 16 ms) when starting eccentricity was 0.5°, and around 0.57° (Δt = 32 ms) when starting eccentricity was 7°.
Effect of imposing steps of apparent target velocity during ongoing pursuit
A number of previous papers have pointed out that image motion plays a dual role in pursuit. It must both 1) engage pursuit by initiating the active transition from fixation to pursuit and 2) provide the primary feed-forward drive producing eye acceleration (Goldreich et al. 1992; Kawano and Miles 1986; Luebke and Robinson 1988; Morris and Lisberger 1985; Robinson 1965). The effects of apparent motion on the initiation of pursuit could arise either because the pursuit system takes longer to become fully engaged when a degraded motion signal is present, or because the motion signals driving eye acceleration are delayed and weakened. To distinguish between these two possibilities, we compared pursuit initiation from fixation with pursuit responses to changes in target velocity, after pursuit had been engaged. Control trials were used to study initiation, and provided a single step of target velocity with different values of Δt. To allow comparison of pursuit initiation with responses to changes in target velocity, the onset of target motion was not accompanied by a position step. As with all the above experiments, Δt was 4 ms during fixation and was changed only when the target began to move. Experimental trials provided two steps of apparent target velocity. The first target velocity step retained a Δt of 4 ms, while the second step increased target speed and provided the Δt of interest. This design enabled the monkey to achieve nearly perfect tracking so that the image velocity produced by the second step was nearly equal to the change in target velocity. We were thus able to compare the response to a given image motion seen during fixation with the response to the same image motion seen during active pursuit. We expected one of two outcomes for this experiment. If apparent motion causes the initiation of pursuit to suffer because pursuit engagement is delayed, then responses to changes in target velocity should exhibit reduced deficits, as pursuit is already engaged. If deficits are due to degradation of the motion signals driving eye acceleration, then deficits in the responses to target velocity changes during pursuit should be identical to deficits produced in pursuit initiation. An assumption of this approach is that pursuit, once engaged by the first step, is not disengaged by the second step.
Figure 11A shows averages of eye velocity illustrating the effect of Δt on the response to a 30°/s target velocity step. At the time of the target velocity step, the animal was fixating the stationary target. As Δt progressed from 4 to 32 ms (trace weights moving from solid to short dashes to long dashes), pursuit initiation became progressively more impaired. Figure 11B shows the same progression of deficits in response to a 30°/s step of target velocity that was imposed during maintained pursuit at 2°/s (i.e., from 2 to 32°/s). Every Δt that produced a deficit in the response from fixation produced a similar deficit in the response to a change in target velocity. Deficits in the response to the velocity step were not reduced by prior engagement of pursuit. Furthermore, the second step did not cause any decline in sustained eye velocity prior to the pursuit response for any of the values of Δt used. The absence of any decline argues that pursuit remained engaged when the second step was presented.
FIG. 11.
Effect of initial target velocity on responses to a 30°/s step of apparent target velocity using multiple values of Δt. A: initial target velocity was 0°/s and the step took target velocity to 30°/s. B: initial target velocity was 2°/s and the step took target velocity to 32°/s. Different trace types show average eye velocity for different values of Δt: bold traces, 4 ms; thin traces, 12 ms; small dashes, 16 ms; medium dashes, 24 ms; long dashes, 32 ms. The horizontal dashed lines mark 0°/s. Vertical dashed lines are placed 50 ms after the start of the response when Δt was 4 ms and show when the eye velocity measurements plotted in Fig. 12 were made.
These and related data are quantified in Fig. 12. The three graphs show data for three different monkeys and plot average eye velocity, measured 50 ms after the relevant step of target velocity, as a function of Δt. Different symbol types plot responses for different initial and final target velocities. Deficits in the response to 30°/s steps of target velocity were the same whether that step took velocity from 0 to 30°/s (filled circles) or 2 to 32°/s (open circles). Similar experiments were performed using target velocity steps of 10°/s. Again, deficits were very similar whether the steps took velocity from 0 to 10°/s (filled squares), from 2 to 12°/s (open squares), or from 20 to 30°/s (open diamonds). Prior engagement of the pursuit system did not diminish deficits. What we have referred to as “initiation deficits” are not therefore deficits in the initiation of pursuit per se, but rather are deficits in the visuo-motor processing of image motion for the purpose of producing eye acceleration.
FIG. 12.
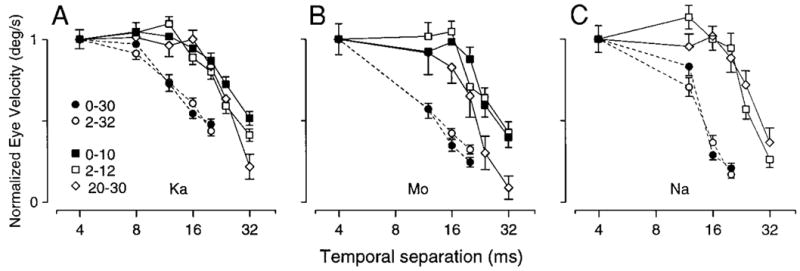
Quantitative analysis of the effect of initial target/eye velocity on the response to steps of target velocity as a function of Δt. The 3 graphs show data from 3 monkeys. Each graph plots the normalized eye velocity response as a function of Δt for steps of apparent target velocity imposed both at the initiation and during maintenance of pursuit. Each response was normalized by dividing the mean eye velocity response by that for the same conditions when Δt was 4 ms. When steps of target velocity were imposed at the initiation of pursuit, we measured eye velocity 50 ms after the onset of the response when Δt was 4 ms. When steps of target velocity were imposed during the maintenance of pursuit, we measured the change in eye velocity by subtracting eye velocity 10 ms before the start of the response from that measured 50 ms after. Different symbols indicate different initial target velocities and velocity step sizes. Filled symbols plot responses to target steps imposed during fixation of a stationary target: 10°/s (filled squares) and 30°/s (filled circles). Open symbols plot responses to target velocity steps imposed during pursuit of a moving target: from 2 to 32°/s (open circles), from 2 to 12°/s (open squares), and from 20 to 30°/s (open diamonds). Error bars show the standard error of the mean.
Figure 12 also addresses an assumption of some models of smooth pursuit eye movements: that the visuo-motor processing that produces eye acceleration occurs in retinal coordinates (Goldreich et al. 1992; Krauzlis and Lisberger 1994; Ringach 1995). If deficits recorded at the initiation of pursuit result from the impairment of motion processing in retinal coordinates, then the deficits should be independent of target and eye velocity, and of the absolute spatial separation of the flashes. They should depend only on the retinal flash separation. Figure 12 shows that this was indeed the case. When targets changed velocity, deficits were linked to the retinal Δx produced by the second step, and not to the spatial Δx. For example, all 10°/s velocity steps from the three different initial target velocities produced similar retinal image velocities and similar values of retinal Δx, and all three produced similar deficits at a given Δt. If the absolute Δx were the relevant factor, then deficits in the responses to steps that take target velocity from 20 to 30°/s should occur at values of Δt one-third those needed to produce deficits for steps of target velocity from 0 to 10°/s. Instead, deficits became apparent when Δt approached 20 ms regardless of the final target speed. These data also indicate that the underlying eye and target velocity have little effect on the magnitude of visuo-motor deficits produced by a given retinal flash separation. These conclusions might seem inevitable, but they are in contrast with the clear influence of extra-retinal factors on maintenance deficits, described in the next section.
In two monkeys (Fig. 12, A and B), final eye/target speed did have a small effect on the magnitude of deficits at larger values of Δt: open diamonds are below the two square symbols when Δt is 32 ms. At least for monkey Mo (Fig. 12B), this is probably because the gain of his pursuit maintenance was slightly less than one when target velocity was 20°/s. Image velocity was actually 12°/s when target velocity stepped from 20 to 30°/s, rather than the intended 10°/s, yielding a slightly larger retinal Δx. Alternately, we present evidence below that deficits in pursuit maintenance do depend on extra-retinal factors, are produced primarily at fast eye/target velocities and large flash separations, and involve deficits in processes other than visuo-motor drive. None of the stimulus parameters used produced maintenance deficits in these experiments. Nonetheless, when Δt was 32 ms, the slight increase in deficit size at the highest eye/target velocity suggests that the deficit in visuo-motor drive is compounded with further deficits that are related to extra-retinal factors. An extreme example of such a compound deficit can be seen in Fig. 17, described later. For all other stimulus configurations presented in Fig. 12, the consistency of deficit size despite changes in absolute target velocity implies that extra-retinal factors have negligible impact on deficits in visuo-motor drive.
FIG. 17.

Experiments demonstrating that the appearance of maintenance deficits does not depend solely on the retinal image motion. Each panel shows average eye velocity for apparent target velocities that stepped 1st from 0 to 15°/s and subsequently from 15 to 30°/s. A: responses of monkey Mo. B: responses of monkey Na. Bold traces show average eye velocity when Δt was 4 ms. Fine traces show average eye velocity when Δt was 60 ms (A) or 96 ms (B). Each average was computed from 30 or more trials. Neither the 1st nor the 2nd step of target velocity was accompanied by a step of target position.
Maintenance deficits were produced by large flash separations
All the deficits discussed so far have been deficits in pursuit initiation, with no concurrent deficits in pursuit maintenance. However, for some large flash separations, pursuit maintenance was impaired. For example, Fig. 13 shows pursuit responses of monkey Na to 30°/s targets when Δt was 4 and 96 ms. When Δt was 4 ms (Fig. 13A), the initiation of pursuit was brisk and sustained eye velocity reached target velocity. When Δt was 96 ms (Fig. 13B), initial eye acceleration was both delayed and weak. Eye acceleration ceased before target velocity was reached, and the target was tracked with a combination of deficient pursuit and frequent saccades. To show that the averages of eye velocity are consistent with the responses in individual trials, the eye velocity responses from individual trials (fine traces) are superimposed on the averages (bold traces). Inspection of the individual traces, in which intervals where saccades were excised have not been replaced with line segments, also shows that our method for analyzing eye velocity neither created nor obscured these deficits. Because saccades would confound any averages of eye position, we have superimposed the eye position traces from many individual trials in the bottom half of Fig. 13. These traces reveal that the eye was consistently behind the target in Fig. 13B, so that retinal image position was a few degrees eccentric, just as it was during the initiation of pursuit.
FIG. 13.

Examples of the time course of eye velocity and position during apparent motion that caused deficits in the maintenance of pursuit. The top and bottom sets of traces show eye and target velocity and position when Δt was 4 ms (A) and 96 ms (B). Bold eye velocity traces show averages made after replacing saccades with straight line interpolations. Averages were made from 31 trials for A and 16 trials for B. Fine velocity and position traces show responses from 10 consecutive individual trials. In the individual eye velocity traces, the blank intervals indicate the times of saccades. The dots on the target position trace in B indicate the time and position of each flash of the apparent motion target. Data are from monkey Na.
The most obvious explanation for the observed deficits in pursuit maintenance is that they, like deficits in pursuit initiation, result from a failure of the motion signals driving eye acceleration. If eye acceleration is weak, then target velocity cannot be reached during the course of the trial. A number of lines of evidence argue that this explanation is incorrect. First, maintenance deficits were sometimes observed despite considerable initial eye acceleration. In Fig. 14A, target velocity was 32°/s and Δt was 48 ms. Had it been maintained, initial eye acceleration (prior to the saccade) would have been sufficient in most trials to bring eye velocity to target velocity. In fact, eye acceleration fails before target velocity is reached; eye velocity actually reaches a peak and then decays somewhat, both in the average (bold trace) and in most of the responses from individual trials (fine traces). Figure 14B shows averages of eye velocity from the same experiment when the value of Δt was 4, 32, 48, and 64 ms, revealing a progression of deficits in both the initiation and maintenance of pursuit. A mild maintenance deficit could be seen even when Δt was 32 ms. Although not shown, in this experiment a Δt of 64 ms produced deficits in initiation but not maintenance for target velocities of 8°/s or slower.
FIG. 14.
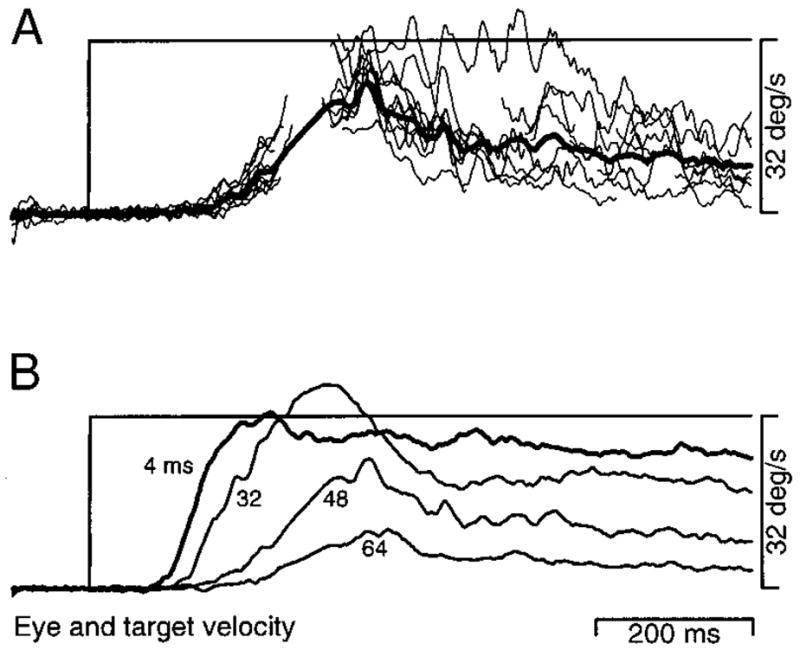
Effect of varying Δt on deficits in the maintenance of pursuit for target motion at 32°/s. A: eye velocity traces showing responses when Δt was 48 ms. Fine traces show 10 consecutive individual responses, with saccades replaced by blank intervals. Bold trace shows the average eye velocity after saccadic deflections of eye velocity had been replaced with straight line segments. B: average eye velocity when Δt was 4, 32, 48, and 64 ms. Averages were computed from 10 to 15 trials taken from the same experiment on monkey Fi that produced Fig. 8B.
One might reason, in Fig. 14A, that the presence of saccades is partially responsible for the decline in eye acceleration. However, saccades typically enhance postsaccadic eye velocity at the initiation of pursuit (Lisberger 1998). Even if saccades were disruptive rather than facilitory, eye acceleration would be expected to resume following the saccade, especially as the retinal Δx is less during defective pursuit maintenance that during the target motion that initiates pursuit. The most likely explanation for the data in Fig. 14 is that maintenance deficits result from a failure of eye velocity memory to support eye velocity and to integrate eye acceleration commands. As discussed in the introduction, eye velocity memory is a postulated mechanism that integrates eye acceleration commands and maintains current eye velocity if no acceleration command is given. For a number of reasons, including the quick decline of eye velocity following target offset, eye velocity memory is presumed to be modulated with the engagement state of pursuit. The state of engagement of pursuit may in turn be modulated by the quality of the motion stimulus provided by the target.
The experiment shown in Fig. 15 further bolsters the conclusion that deficits in the maintenance of pursuit result from a partial failure of eye velocity memory. Each of the two experiments shown consisted of three trial types. When Δt was 4 ms (solid traces labeled “4 ms”), initiation was brisk and the steady-state gain was near one. When Δt was 64 ms (Fig. 15A, dashed traces) or 96 ms (Fig. 15B, dashed traces), eye acceleration was weak at the initiation of pursuit and maintained smooth eye velocity was about half of target velocity. If Δt was initially 4 ms and was then changed to the longer value at the time indicated by the vertical arrows (solid traces labeled “4 → 64” and “4 → 96”), then eye velocity settled quickly into a maintenance deficit following the increase in Δt. In both examples in Fig. 15, the final eye velocity was very close to that obtained when the longer Δt was used from the outset. Thus large values of Δt produced maintenance deficits even after eye velocity had reached target velocity, confirming that maintenance deficits result from a failure of eye velocity memory, and not simply from a failure of initial eye acceleration.
FIG. 15.

Demonstration that deficits in the maintenance of pursuit result from a failure of eye velocity memory. Each panel shows a step of target velocity and 3 averages of eye velocity. A: responses of monkey Da when apparent target velocity was 32°/s. B: responses of monkey Mo when apparent target velocity was 30°/s. Different line types show different sequences of Δt: bold traces, Δt was 4 ms throughout the trial; dashed traces, Δt was 64 ms (A) or 96 ms (B) throughout the trial; fine traces, Δt was initially 4 ms, then increased to 64 ms (A) or 96 ms (B) at the times marked by the arrows. Each average trace was computed from at least 15 trials.
Deficits in the maintenance of pursuit are not in retinal coordinates
When we examined deficits in the initiation of pursuit, we expressed the limits of normal eye acceleration in terms of Δt and the retinal Δx. It is natural to wish to do the same for pursuit maintenance, but it does not appear that the limits on normal maintenance can be expressed in these terms. Figure 16 shows the initiation and maintenance of pursuit for two monkeys when Δt was 4 or 64 ms and apparent target velocity was 16°/s (bottom panels) or 32°/s (top panels). When Δt was 64 ms, deficits in the maintenance of pursuit were present at an apparent target velocity of 32°/s (Fig. 16, A and C), but were reduced or absent at 16°/s (Fig. 16, B and D). These examples make a number of points. First, like many initiation deficits, maintenance deficits cannot result simply from an excessive Δt. Second, it is equally difficult to link maintenance deficits to a particular spatial limit, at least in retinal terms. In Fig. 16, B and D, when target velocity was 16°/s, a Δx of 1° (associated with a Δt of 64 ms) produced impaired but still reasonable eye acceleration during initiation of pursuit. The same retinal Δx of 1° (also associated with a Δt of 64 ms) is achieved during the impaired pursuit of the 32°/s target (at the times indicated by arrows in Fig. 16, A and C), yet there is little further eye acceleration toward target velocity. In general, any deficit linked solely to the retinal Δx should be reduced as the eye accelerates, facilitating further eye acceleration. During maintenance deficits, just the reverse happens. Last, if we accept the conclusion argued above that the spatial and temporal limits of visuo-motor drive are expressed in retinal terms, then these examples illustrate that maintenance deficits do not result solely from a failure to convert retinal motion signals into eye acceleration commands. The retinal Δt and Δx of 64 ms and 1° are sufficient to produce considerable eye acceleration in Fig. 15, B and D. The failure of these same retinal parameters to produce eye acceleration in Fig. 15, A and C, suggests that eye velocity memory is not properly integrating eye acceleration commands.
FIG. 16.

Examples demonstrating that during deficient maintenance of pursuit, eye acceleration is much less than expected given the residual retinal image motion. A and B: results of an experiment using monkey El. For these panels, upward deflections represent leftward motion. C and D: results of an experiment using monkey Da. The 4 panels show averages of eye velocity for targets moving at apparent velocities of 32°/s (A and C) and 16°/s (B and D). Bold traces show responses when Δt was 4 ms and fine traces show responses when Δt was 64 ms. The arrows on the fine traces show the moments when image velocity (the difference of target and eye velocity) was 16°/s, so that the physical stimulus on the retina was the same at this point in the top and bottom panels. Each average trace was computed from about 15 trials.
A final experiment further illustrates a number of these points. Figure 17, A and B, show data for two monkeys. Pursuit target velocity was increased twice, first from 0 to 15°/s and then from 15 to 30°/s, while Δt was held constant for the duration of target motion. Neither velocity step was accompanied by a position step. When Δt was 4 ms (bold traces), both monkeys showed brisk eye acceleration in response to both the first and second 15°/s step of target velocity. When Δt was 60 ms in Fig. 16A and 96 ms in Fig. 16B (fine traces), the initiation of pursuit was delayed and showed clear deficits in eye acceleration. However, eye velocity neared or reached target velocity, implying that the apparent motion seen during the first step leads to a deficit in visuo-motor drive without a deficit in eye velocity memory. Because maintained eye velocity was close to target velocity, the second step of target velocity, to 30°/s, provided another 15°/s step of apparent image velocity, with the same Δt and retinal Δx as the first. Both monkeys showed little eye acceleration in response to this second step of target velocity. If one accepts that visuo-motor drive depends on the retinal rather than absolute Δx, then visuo-motor drive is expected to be similar for the first and second step of target velocity. That the observed acceleration is very weak after the second step argues that 1) eye velocity memory is not operating normally and/or 2) the visuo-motor commands for eye acceleration are being gated. Additionally, this experiment further illustrates that the effect of a given Δt on pursuit maintenance depends on target velocity.
Taken together, Figs. 13–17 strongly argue two points. First, maintenance deficits result primarily from a failure of eye velocity memory. Maintenance deficits persist under conditions where visuo-motor drive ought to be sufficient to accelerate the eye toward target velocity. Maintenance deficits can be produced even after eye velocity has reached target velocity, when no further eye acceleration is needed. We discuss below the likelihood that this failure of eye velocity memory is due to partial engagement of pursuit. A secondary contribution to maintenance deficits may arise if partial engagement gates visuo-motor drive, although our data do little to address this possibility. Second, the conditions that produce deficits in the maintenance of pursuit are not tied solely to the retinal image motion in retinal coordinates. The impact of apparent retinal image motion depends on the absolute velocity of the target and/or eye.
DISCUSSION
Pursuit of step-ramp targets is generally described as having separate initiation and maintenance phases. While apparent motion does produce deficits in both pursuit initiation and maintenance, a full account of the deficits we have observed requires a more mechanistic description of pursuit. Behavioral (Morris and Lisberger 1987; Robinson 1971; Young et al. 1968), lesion (Dursteler and Wurtz 1988; Dursteler et al. 1987; Newsome et al. 1985), and modeling (Goldreich et al. 1992; Krauzlis and Lisberger 1994; Ringach 1995) studies argue that pursuit eye velocity is created by two mechanisms. The first is visuo-motor drive, which converts retinal image motion into commands for eye acceleration. The second is eye velocity memory, which integrates the eye acceleration commands into commands for eye velocity, and maintains those eye velocity commands until subsequent visual inputs provoke renewed eye acceleration, or until pursuit is disengaged. Each of these mechanisms contributes to both the initiation and maintenance of pursuit. The role of visuo-motor drive is minimized (although not eliminated) during maintained pursuit of constant velocity targets, but this would not be true for the majority of natural pursuit targets. In addition, several lines of evidence reviewed in the Introduction have suggested that the gain of visuo-motor drive and eye velocity memory are under on-line control by a mechanism governing pursuit engagement. Both visuo-motor drive and eye velocity memory may operate at full gain only when pursuit is maximally engaged. The level of engagement may depend on “cognitive” factors such as motivation and expectation, sensory factors such as the speed and direction of the target, and, we will argue, the quality of the visual motion. In the first part of the Discussion, we will outline how our results fit with this more mechanistic view of the organization of the pursuit system.
Separable deficits in visuo-motor drive and eye velocity memory
We have reported deficits in the latency and magnitude of initial pursuit eye acceleration that depended on retinal parameters such as the spatial separation of flashes on the retina and retinal eccentricity, and were independent of extra-retinal parameters such as eye velocity, target velocity, and the prior level of engagement of the pursuit system. We conclude that the deficits we have recorded at the initiation of pursuit are due to a failure of visuo-motor drive, presumably subsequent to the failure of apparent motion stimuli to evoke normal responses in the sensory end of the pathways that convert image motion into eye acceleration.
In contrast, the deficits we measured in pursuit maintenance cannot be attributed simply to a failure of visuo-motor drive and instead appear to result from a failure of eye velocity memory. A failure of visuo-motor drive alone is insufficient to explain the data in Figs. 13–17. We suggest that the gain of eye velocity memory is influenced by the state of engagement of the pursuit system and that maintenance deficits result from a failure of highly degraded motion signals to fully engage pursuit. The idea that pursuit engagement may influence the gain of eye velocity memory has been suggested before, by Robinson et al. (1986) and Krauzlis and Lisberger (1994).
Origin of deficits in visuo-motor drive
Cortical area MT is known to be a key part of the visuo-motor pathway driving eye acceleration, and there are a number of parallels between the factors influencing deficits in visuo-motor drive and those influencing the responses of cells in MT. These parallels provide some support for the obvious interpretation that deficits in visuo-motor drive result from a failure of the relevant apparent motion stimuli to evoke normal responses in MT. First, deficits in visuo-motor drive were tied to the retinal Δx rather than the absolute or spatial Δx. Current data imply the same retinal coordinate frame for neurons in MT. Second, visuo-motor drive during the initiation of pursuit was able to withstand larger values of Δx when the target started more eccentrically. Cells in area MT with more eccentric, and therefore larger, receptive fields are also able to withstand larger values of Δx before losing directionality (Mikami et al. 1986). Third, as described below, there is general agreement between the maximum Δt and Δx that produce normal initiation of pursuit and the maximum Δt and Δx that evoke strongly directional responses in area MT. There is no such agreement for primary visual cortex. Thus although the first parallel drawn above clearly applies to V1, and the second likely does, the third does not.
To allow comparison of our data with neural responses recorded in previous studies, we defined the spatial and temporal limits on pursuit as the maximum values of Δx and Δt that produced pursuit initiation within 90% of normal (Fig. 8). The spatial limit on pursuit varied among monkeys from 0.2 to 0.5° for targets that appeared between 1.1 and 3.5° eccentric. For neural responses, we defined strong direction selectivity as a directional index >0.8. Extrapolation along the curve used in Fig. 5 of Mikami et al. (1986) to fit their neural recording data suggests that MT neurons have a spatial limit of 0.55° at an eccentricity of 2°. In contrast, the same figure shows that the spatial limit for V1 cells is only 0.1° at an eccentricity of 2°. These comparisons imply that pursuit initiation is dependent on strongly directional responses in area MT but not on strongly directional responses in V1. Because both neural and pursuit responses degrade quickly once the spatial limits are exceeded, the qualitative conclusions drawn in this paragraph do not depend strongly on the precise criteria chosen to define the spatial limits.
Comparison of the effect of Δt on pursuit initiation and on responses in MT is more difficult. Figure 6 of Mikami et al. (1986) implies that neurons in MT maintain strong direction selectivity for values of Δt up to 90 ms. The latency to initiate pursuit was typically <90 ms, and the maximum Δt for normal pursuit initiation was of necessity less than this, falling between 32 and 64 ms. Measurements of the effect of Δt on initial eye acceleration afford a better opportunity for comparison but were difficult to make at the low velocities required to remain below the spatial limit for normal pursuit initiation. The only experiment in which we were able to make these measurements is shown in Fig. 9 and indicates that the temporal limit on normal acceleration was between 64 and 80 ms, in rough agreement with the temporal limits of responses of MT neurons.
Despite the agreement between the temporal and spatial limits for MT and for pursuit, a number of factors make it risky to compare our pursuit data with the available physiological data. 1) Mikami et al. (1986) recorded from cells with receptive fields more eccentric than our pursuit stimuli, requiring estimates made by extrapolation of linear fits. 2) Mikami et al. (1986) analyzed mean firing rate over the full 1,000-ms duration of their stimulus while the initiation of pursuit would be driven by approximately the first 100 ms of the response. 3) Mikami et al. (1986) quantified responses in terms of the directionality of the responses. Their analysis was entirely appropriate given the issues they considered, but does not directly address the question of how an estimate of target speed extracted from the population code in MT would change with Δx and Δt. To better compare the changes induced in MT responses and pursuit initiation, one would wish to pay particular attention to the initial 100 ms of the neural responses, and to observe the magnitude and time course of a reconstruction of target speed from the population response in MT.
Such an approach is also needed to understand the presence of the different deficit types we observed in the visuo-motor drive for pursuit. Deficits in acceleration latency could conceivably result either from changes in the latency of MT responses, or from decreases in firing rates. Deficits in the magnitude of eye acceleration could result either from decreases in firing rate across the population of MT neurons, or from shifts in the population vector. Any of the deficits could be related either to decreases in the responses of neurons that prefer motion in the direction of target motion, or to increases in the responses of neurons with null directions that correspond to the direction of target motion.
Interestingly, the seemingly paradoxical facilitation of eye acceleration can be explained by a property of motion sensitive cells described by Mikami et al. (1986): cells tuned for lower speeds lose their directional selectivity at smaller values of Δx. This was true both for MT and V1. If we consider a population representation of speed within MT or V1, at a given target speed some values of Δx will suppress only the responses of cells with slower preferred speeds. This will effectively shift the peak of the population code to a speed higher than the veridical speed. If the population code is converted to commands for eye acceleration by a neural computation that depends on which cells are firing most, then this shift in the population code would be construed as an increase in image speed.
Origin of deficits in eye velocity memory
Our interpretation of the deficits in the maintenance of pursuit is that pursuit is incompletely engaged when visual motion is insufficiently convincing, and that eye velocity memory does not therefore operate at full gain. Previous observations of deficits in the maintenance of pursuit in other contexts have ascribed such deficits to incomplete engagement, poor velocity memory, or both. These observations include 1) a monkey who showed weak initiation of pursuit and poor tracking of upward target motion with normal upward visual motion processing (Grasse and Lisberger 1992); 2) two monkeys with early-onset artificially induced strabismus who had weak initiation and maintenance of pursuit for temporalward target motion, normal responses to temporalward image motion presented during nasalward pursuit, and normal direction selectivity and velocity tuning in visual area MT (Kiorpes et al. 1996); and 3) monkeys with unilateral lesions of the medial superior temporal area (visual area MST) (Dursteler and Wurtz 1988), the frontal pursuit area (Keating 1991; Lynch 1987; MacAvoy et al. 1991), or the dorsolateral pontine nucleus (May et al. 1988). Our data extend these results by suggesting that pursuit engagement and the resulting recruitment of eye velocity memory are gated by visual motion and are sensitive to the quality of that motion.
Deficits in the maintenance of pursuit did not depend solely on the retinal properties of the moving image but were influenced by factors such as absolute target or eye velocity. We see two possible interpretations of this finding. 1) Engagement and the resulting gating of eye velocity memory may be influenced by extra-retinal signals related to eye velocity or absolute target velocity. Such a mechanism might ensure that large values of Δt were not tolerated at high target velocities, perhaps as they imply a large spatial Δx. That the engagement of pursuit should involve extra-retinal parameters is not necessarily surprising. To detect a cessation of target motion (which typically results in the disengagement of pursuit), retinal image velocity would have to be compared with eye velocity. 2) The degree of engagement of pursuit may be dependent only on retinal features of the stimulus, but the gain of eye velocity memory may be nonlinear. When incompletely engaged, eye velocity memory may be more prone to “leak” at higher velocities. Effects of incomplete engagement on pursuit maintenance would then be small at low eye velocities, but would become noticeable at high velocities. In fact, eye velocity memory does appear to be more prone to leaking at higher velocities even under nearly optimal conditions of target motion. For some monkeys small “maintenance deficits” were observed for higher target velocities even when Δt was 4 ms (Figs. 13–16). However, Δt’s that produced large maintenance deficits at high apparent target velocities often produced perfectly normal, or even supra-normal maintenance at lower target velocities (Figs. 15B and 16B). Thus, for this explanation to succeed, the gain of eye velocity memory would have to be very nonlinear.
In addition to the impairment of eye velocity memory, there are two other classes of explanations for deficits in pursuit maintenance that we consider unlikely. 1) The prevalence of saccades during deficient pursuit maintenance disturbs pursuit, preventing normal maintenance. As discussed above, saccades potentiate subsequent smooth eye velocity, presumably by enhancing incomplete engagement (Lisberger 1998), and should tend to ameliorate deficits in the maintenance of pursuit. In addition, severe deficits in initiation, accompanied by frequent saccades, were often followed by normal maintenance. Further, an explanation based on interference by saccades would also have difficulty accounting for the data in Figs. 15 and 17. Thus saccades appear to be a consequence rather than a cause of the deficits. 2) Target image eccentricity is different during the maintenance and initiation of normal pursuit. A given spatial flash separation produced larger deficits in visuo-motor drive for more foveal targets. As our pursuit targets started eccentrically, but were foveated during the maintenance of pursuit, this effect might have quelched visuo-motor drive as eye velocity neared target velocity. In practice, however, eye position lagged target position by a couple of degrees during deficient maintenance of pursuit, so that the actual retinal eccentricities of targets that failed to evoked eye acceleration during pursuit maintenance were similar to those of targets that evoked convincing eye acceleration at the initiation of pursuit (see Fig. 13B). Furthermore, maintenance deficits could be observed when a step of apparent target velocity was presented in the absence of an initial position step (data not shown). Under such conditions the target image becomes progressively more eccentric during the initiation of pursuit. Last, this explanation cannot account for the data in Figs. 15 or 17, nor can it explain why maintenance deficits were worse at higher target velocities, as in Fig. 16.
A failure of processing in any number of cortical areas could produce the eye velocity memory deficits we observed. The presence of eye velocity memory deficits following lesions of visual area MST, which is thought to be the next level of motion processing for pursuit eye movements after area MT, suggests that the deficits we have observed may result because the relevant apparent motion stimuli fail to evoke normal responses in MST. Due to the presence of extra-retinal signals, MST has previously been suggested as a site mediating corollary feedback of the type required for eye velocity memory (Newsome et al. 1988). Alternately, it is also possible that maintenance deficits result when weakened inputs from MT fail to properly excite neurons in the frontal pursuit area or the dorsolateral pontine nucleus, lesions of which also lead to maintenance deficits.
Comparison with previous studies
Previous studies of pursuit of apparent motion in humans have found seemingly normal pursuit for values of Δt up to 150 ms, which produced large initiation deficits in our monkeys (Fetter and Buettner 1990; Morgan and Turnbull 1978; Schor et al. 1984; Van der Steen et al. 1983). However, these studies employed either continuously moving or low-frequency periodic stimuli and examined pursuit gain during steady-state tracking. Under these conditions, deficits in the latency and magnitude of visuo-motor drive are expected to have minimal impact. Deficient pursuit will be observed only when visuo-motor drive becomes very weak, or when eye velocity memory suffers. The studies that produced the largest tolerable Δt’s (Morgan and Turnbull 1978, 150 ms; Van der Steen et al. 1983, at least 100 ms) did so at relatively low apparent target velocities (2 and 7.85°/s, respectively). These values of Δt were at the limit of what produced normal pursuit maintenance in our monkeys at these velocities. The predictable nature of the targets used in these studies may also have contributed to the relatively normal performance at large values of Δt. Finally, our preliminary data (unpublished observations) do not support the possibility that human visual processing is much more resistant to apparent motion than that of monkeys.
Comparison with perception of apparent motion
Comparison of pursuit and perception for apparent motion stimuli offers an opportunity to address the open question of whether the motion signals driving pursuit are identical to those that mediate perception. Baker and Braddick (1985) used random dot displays to probe the spatial limits of perception involving the short-range apparent motion process. They found that the maximum Δx increased with eccentricity and was approximately 0.2 and 1.3° for eccentricities of 1 and 8°. In reasonable agreement, the maximum Δx for normal pursuit initiation was approximately 0.2 and 0.5° for starting eccentricities of 0.5 and 7° (Fig. 10). Comparison of the maximum Δt for pursuit initiation and for perception of short range apparent motion is more difficult, as pursuit necessarily suffers at any Δt that approaches the latency of pursuit. Nevertheless, we note that the maximum Δt for normal initial eye acceleration was 64–80 ms, in good agreement with the maximum Δt for perception of 40–80 ms.
Studies of short-range apparent motion used random dot stimuli, and psychophysical performance was measured as the ability to discern the direction of motion. A better approximation to our discrete target is the bar-shaped target used by Newsome et al. (1986) in their evaluation of the perceptual limits of apparent motion. Unlike random dot stimuli, however, a single bar moves unambiguously in a given direction even at very large values of Δx. Newsome et al. (1986) therefore asked subjects to give their subjective impression of the smoothness of motion. The five subjects reported that smooth motion was absent when Δx exceeded 0.6 to 1.5°, for target velocities of 10–40°/s at an eccentricity of 5°. In reasonable agreement, the maximum Δx for pursuit was 0.5° for a starting eccentricity of 7°.
The broad agreement between the parameters of apparent motion that support pursuit and perception at least suggests common inputs to the two systems. However, there are some serious caveats to this conclusion. First, pursuit in humans may have somewhat different spatial and temporal limits than pursuit in monkeys. Second, our stimuli were different from those previously used to study perception. Last, the metrics used to study perception (subjective quality of motion, discrimination of direction) are not obviously parallel to the metric we used for pursuit (latency and magnitude of eye acceleration during pursuit initiation). A more detailed comparison necessarily awaits new experiments designed to study pursuit and perception in parallel.
Acknowledgments
We acknowledge the efforts of K. Logan, who completed a preliminary version of these experiments using now-outdated technology but obtained many of the same results reported here. We thank Dr. J. Anthony Movshon, the members of the Lisberger laboratory, and an anonymous reviewer for insightful comments on the manuscript. S. G. Lisberger is an Investigator of the Howard Hughes Medical Institute.
This research was supported by National Eye Institute Grant EY-03878. M. M. Churchland was supported by a pre-doctoral fellowship from the Department of Defense.
References
- Adelson EH, Bergen JR. Spatiotemporal energy models for the perception of motion. J Opt Soc Am A. 1985;2:284–299. doi: 10.1364/josaa.2.000284. [DOI] [PubMed] [Google Scholar]
- Baker CJ, Braddick OJ. Temporal properties of the short-range process in apparent motion. Perception. 1985;14:181–192. doi: 10.1068/p140181. [DOI] [PubMed] [Google Scholar]
- Barlow H, Levick WR. The mechanism of directionally selective units in rabbit’s retina. J Physiol (Lond) 1965;178:477–504. doi: 10.1113/jphysiol.1965.sp007638. [DOI] [PMC free article] [PubMed] [Google Scholar]
- Barnes GR, Asselman PT. Pursuit of intermittently illuminated moving targets in the human. J Physiol (Lond) 1992;445:617–637. doi: 10.1113/jphysiol.1992.sp018943. [DOI] [PMC free article] [PubMed] [Google Scholar]
- Boussaoud D, Desimone R, Ungerleider LG. Subcortical connections of visual areas MST and FST in macaques. Vis Neurosci. 1992;9:291–302. doi: 10.1017/s0952523800010701. [DOI] [PubMed] [Google Scholar]
- Braddick OJ. Low-level and high-level processes in apparent motion. Philos Trans R Soc Lond B Biol Sci. 1980;290:137–151. doi: 10.1098/rstb.1980.0087. [DOI] [PubMed] [Google Scholar]
- Braddick OJ, Baker CL., Jr Eccentricity-dependent scaling of the limits for short-range apparent motion perception. Vision Res. 1985;25:803–812. doi: 10.1016/0042-6989(85)90188-9. [DOI] [PubMed] [Google Scholar]
- Castet E. Apparent speed of sampled motion. Vision Res. 1995;35:1375–1384. doi: 10.1016/0042-6989(95)98717-n. [DOI] [PubMed] [Google Scholar]
- Dursteler MR, Wurtz RH. Pursuit and optokinetic deficits following chemical lesions of cortical areas MT and MST. J Neurophysiol. 1988;60:940–965. doi: 10.1152/jn.1988.60.3.940. [DOI] [PubMed] [Google Scholar]
- Dursteler MR, Wurtz RH, Newsome WT. Directional pursuit deficits following lesions of the foveal representation within the superior temporal sulcus of the macaque monkey. J Neurophysiol. 1987;57:1262–1287. doi: 10.1152/jn.1987.57.5.1262. [DOI] [PubMed] [Google Scholar]
- Fetter M, Buettner UW. Stimulus characteristics influence the gain of smooth pursuit eye movements in normal subjects. Exp Brain Res. 1990;79:388–392. doi: 10.1007/BF00608249. [DOI] [PubMed] [Google Scholar]
- Fuchs AF, Robinson FR, Straube A. Participation of the caudal fastigial nucleus in smooth-pursuit eye movements. J Neurophysiol. 1994;72:2714–2728. doi: 10.1152/jn.1994.72.6.2714. [DOI] [PubMed] [Google Scholar]
- Glickstein M, Cohen JL, Dixon B, Gibson A, Hollins M, Labossiere E, Robinson F. Corticopontine visual projections in macaque monkeys. J Comp Neurol. 1980;190:209–229. doi: 10.1002/cne.901900202. [DOI] [PubMed] [Google Scholar]
- Goldreich D, Krauzlis RJ, Lisberger SG. Effect of changing feedback delay on spontaneous oscillations in smooth eye movements of monkeys. J Neurophysiol. 1992;67:625–638. doi: 10.1152/jn.1992.67.3.625. [DOI] [PubMed] [Google Scholar]
- Gottlieb JP, MacAvoy MG, Bruce CJ. Neural responses related to smooth-pursuit eye movements and their correspondence with electrically elicited smooth eye movements in the primate frontal eye field. J Neurophysiol. 1994;72:1634–1653. doi: 10.1152/jn.1994.72.4.1634. [DOI] [PubMed] [Google Scholar]
- Grasse KL, Lisberger SG. Analysis of a naturally occurring asymmetry in vertical smooth pursuit eye movements in a monkey. J Neurophysiol. 1992;67:164–179. doi: 10.1152/jn.1992.67.1.164. [DOI] [PubMed] [Google Scholar]
- Groh JM, Born RT, Newsome WT. How is a sensory map read out? Effects of microstimulation in visual area MT on saccades and smooth pursuit eye movements. J Neurosci. 1997;17:4312–4330. doi: 10.1523/JNEUROSCI.17-11-04312.1997. [DOI] [PMC free article] [PubMed] [Google Scholar]
- Judge SJ, Richmond BJ, Chu FC. Implantation of magnetic search coils for measurement of eye position: an improved method. Vision Res. 1980;20:535–538. doi: 10.1016/0042-6989(80)90128-5. [DOI] [PubMed] [Google Scholar]
- Kawano K, Miles FA. Short-latency ocular following responses of monkey. II. Dependence on a prior saccadic eye movement. J Neurophysiol. 1986;56:1355–1380. doi: 10.1152/jn.1986.56.5.1355. [DOI] [PubMed] [Google Scholar]
- Keating EG. Frontal eye field lesions impair predictive and visually-guided pursuit eye movements. Exp Brain Res. 1991;86:311–323. doi: 10.1007/BF00228954. [DOI] [PubMed] [Google Scholar]
- Kiorpes L, Walton PJ, O’Keefe LP, Movshon JA, Lisberger SG. Effects of early-onset artificial strabismus on pursuit eye movements and on neuronal responses in area MT of macaque monkeys. J Neurosci. 1996;16:6537–6553. doi: 10.1523/JNEUROSCI.16-20-06537.1996. [DOI] [PMC free article] [PubMed] [Google Scholar]
- Komatsu H, Wurtz RH. Modulation of pursuit eye movements by stimulation of cortical areas MT and MST. J Neurophysiol. 1989;62:31–47. doi: 10.1152/jn.1989.62.1.31. [DOI] [PubMed] [Google Scholar]
- Krauzlis RJ, Lisberger SG. A model of visually-guided smooth pursuit eye movements based on behavioral observations. J Comp Neurol. 1994;1:265–283. doi: 10.1007/BF00961876. [DOI] [PubMed] [Google Scholar]
- Langer T, Fuchs AF, Scudder CA, Chubb MC. Afferents to the flocculus of the cerebellum in the Rhesus macaque as revealed by retrograde transport of horseradish peroxidase. J Comp Neurol. 1985;235:1–25. doi: 10.1002/cne.902350102. [DOI] [PubMed] [Google Scholar]
- Lisberger SG. Postsaccadic enhancement of initiation of smooth pursuit eye movements in monkeys. J Neurophysiol. 1998;79:1918–1930. doi: 10.1152/jn.1998.79.4.1918. [DOI] [PubMed] [Google Scholar]
- Lisberger SG, Fuchs AF. Role of primate flocculus during rapid behavioral modification of vestibuloocular reflex. I. Purkinje cell activity during visually-guided horizontal smooth pursuit eye movements and passive head rotation. J Neurophysiol. 1978;41:733–763. doi: 10.1152/jn.1978.41.3.733. [DOI] [PubMed] [Google Scholar]
- Lisberger SG, Westbrook LE. Properties of visual inputs that initiate horizontal smooth pursuit eye movements in monkeys. J Neurosci. 1985;5:1662–1673. doi: 10.1523/JNEUROSCI.05-06-01662.1985. [DOI] [PMC free article] [PubMed] [Google Scholar]
- Luebke AE, Robinson DA. Transition dynamics between pursuit and fixation suggest different systems. Vision Res. 1988;28:941–946. doi: 10.1016/0042-6989(88)90103-4. [DOI] [PubMed] [Google Scholar]
- Lynch JC. Frontal eye field lesions in monkeys disrupt visual pursuit. Exp Brain Res. 1987;68:437–441. doi: 10.1007/BF00248811. [DOI] [PubMed] [Google Scholar]
- MacAvoy MG, Gottlieb JP, Bruce CJ. Smooth pursuit eye movement representation in the primate frontal eye field. Cereb Cortex. 1991;1:95–102. doi: 10.1093/cercor/1.1.95. [DOI] [PubMed] [Google Scholar]
- May JG, Keller EL, Suzuki DA. Smooth-pursuit eye movement deficits with chemical lesions in the dorsolateral pontine nucleus of the monkey. J Neurophysiol. 1988;59:952–977. doi: 10.1152/jn.1988.59.3.952. [DOI] [PubMed] [Google Scholar]
- McKee SP. A local mechanism for differential velocity detection. Vision Res. 1981;21:491–500. doi: 10.1016/0042-6989(81)90095-x. [DOI] [PubMed] [Google Scholar]
- Mikami A, Newsome WT, Wurtz RH. Motion selectivity in macaque visual cortex. II. Spatiotemporal range of directional interactions in MT and V1. J Neurophysiol. 1986;55:1328–1339. doi: 10.1152/jn.1986.55.6.1328. [DOI] [PubMed] [Google Scholar]
- Morgan MJ, Turnbull DF. Smooth eye tracking and the perception of motion in the absence of real movement. Vision Res. 1978;18:1053–1059. doi: 10.1016/0042-6989(78)90034-2. [DOI] [PubMed] [Google Scholar]
- Morris EJ, Lisberger SG. Different responses to small visual errors during initiation and maintenance of smooth-pursuit eye movements in monkeys. J Neurophysiol. 1987;58:1351–1369. doi: 10.1152/jn.1987.58.6.1351. [DOI] [PubMed] [Google Scholar]
- Newsome WT, Mikami A, Wurtz RH. Motion selectivity in macaque visual cortex. III. Psychophysics and physiology of apparent motion. J Neurophysiol. 1986;55:1340–1351. doi: 10.1152/jn.1986.55.6.1340. [DOI] [PubMed] [Google Scholar]
- Newsome WT, Wurtz RH, Dursteler MR, Mikami A. Deficits in visual motion processing following ibotenic acid lesions of the middle temporal visual area of the macaque monkey. J Neurosci. 1985;5:825–840. doi: 10.1523/JNEUROSCI.05-03-00825.1985. [DOI] [PMC free article] [PubMed] [Google Scholar]
- Newsome WT, Wurtz RH, Komatsu H. Relation of cortical areas MT and MST to pursuit eye movements. II. Differentiation of retinal from extraretinal inputs. J Neurophysiol. 1988;60:694–620. doi: 10.1152/jn.1988.60.2.604. [DOI] [PubMed] [Google Scholar]
- Rashbass C. The relationship between saccadic and smooth tracking eye movements. J Physiol (Lond) 1961;159:326–338. doi: 10.1113/jphysiol.1961.sp006811. [DOI] [PMC free article] [PubMed] [Google Scholar]
- Ringach DL. A tachometer feedback model of smooth pursuit eye movements. Biol Cybern. 1995;73:561–568. doi: 10.1007/BF00199548. [DOI] [PubMed] [Google Scholar]
- Robinson DA. The mechanics of human smooth pursuit eye movement. J Physiol (Lond) 1965;180:569–591. doi: 10.1113/jphysiol.1965.sp007718. [DOI] [PMC free article] [PubMed] [Google Scholar]
- Robinson DA. Models of oculomotor neural organization. In: Bach-y Rita P, Collins CC, Hyde JE., editors. The Control of Eye Movements. New York and London: Academic; 1971. pp. 519–538. [Google Scholar]
- Robinson DA. Integrating with neurons. Annu Rev Neurosci. 1989;12:33–45. doi: 10.1146/annurev.ne.12.030189.000341. [DOI] [PubMed] [Google Scholar]
- Robinson DA, Gordon JL, Gordon SE. A model of the smooth pursuit eye movement system. Biol Cybern. 1986;55:43–57. doi: 10.1007/BF00363977. [DOI] [PubMed] [Google Scholar]
- Schor CM, Lakshminarayanan V, Narayan V. Optokinetic and vection responses to apparent motion in man. Vision Res. 1984;24:1181–1187. doi: 10.1016/0042-6989(84)90173-1. [DOI] [PubMed] [Google Scholar]
- Schwartz JD, Lisberger SG. Initial tracking conditions modulate the gain of visuo-motor transmission for smooth pursuit eye movements in monkeys. Vis Neurosci. 1994;11:411–424. doi: 10.1017/s0952523800002352. [DOI] [PubMed] [Google Scholar]
- Shi D, Friedman HR, Bruce CJ. Deficits in smooth-pursuit eye movements after muscimol inactivation within the primate’s frontal eye field. J Neurophysiol. 1998;80:458–464. doi: 10.1152/jn.1998.80.1.458. [DOI] [PubMed] [Google Scholar]
- Tusa RJ, Ungerleider LG. Fiber pathways of cortical areas mediating smooth pursuit eye movements in monkeys. Ann Neurol. 1988;23:174–183. doi: 10.1002/ana.410230211. [DOI] [PubMed] [Google Scholar]
- Tyler CW. Temporal characteristics in apparent movement: omega movement vs. phi movement. Q J Exp Psychol. 1973;25:171–181. doi: 10.1080/14640747308400337. [DOI] [PubMed] [Google Scholar]
- Ungerleider LG, Desimone R, Galkin TW, Mishkin M. Subcortical projections of area MT in the macaque. J Comp Neurol. 1984;223:368–386. doi: 10.1002/cne.902230304. [DOI] [PubMed] [Google Scholar]
- Van der Steen J, Tamminga EP, Collewijn H. A comparison of oculomotor pursuit a target in circular real, beta or sigma motion. Vision Res. 1983;23:1655–1661. doi: 10.1016/0042-6989(83)90180-3. [DOI] [PubMed] [Google Scholar]
- Watson AB, Ahumada AJ., Jr Model of human visual-motion processing. J Opt Soc Am A. 1985;2:322–341. doi: 10.1364/josaa.2.000322. [DOI] [PubMed] [Google Scholar]
- Young LR, Forster JD, Van Houtte N. Fourth Annual NASA-University Conference on Manual Control. Ann Arbor: University of Michigan; 1968. A revised stochastic sampled data model for eye tracking movements. [Google Scholar]