Abstract
The fungal respiratory pathogen Histoplasma capsulatum evades the innate immune response and colonizes macrophages during infection. Although macrophage production of the antimicrobial effector nitric oxide (NO) restricts H. capsulatum growth, the pathogen is able to establish a persistent infection. H. capsulatum contains a P450 nitric oxide reductase homologue (NOR1) that may be important for detoxifying NO during infection. To characterize the activity of this putative P450 enzyme, a 404 amino acid fragment of Nor1p was expressed in Escherichia coli and purified to homogeneity. Spectral characterization of Nor1p indicated that it was similar to other fungal P450 nitric oxide reductases. Nor1p catalyzed the reduction of NO to N2O using NADH as the direct reductant. The KM for NO was determined to be 20 μM and the kcat to be 5,000 min−1. Together, these results provide evidence for a protective role of a P450 nitric oxide reductase against macrophage-derived NO.
Keywords: Histoplasma capsulatum, Nitric Oxide, Nitric Oxide Detoxification, Cytochrome P450, Cytochrome P450 Nitric Oxide Reductase, Flavohemoglobin
INTRODUCTION
The survival of a pathogen within its host is dependent on evasion of the host’s immune response, including macrophage-mediated killing. During cell-mediated immunity, macrophages are activated by cytokines to produce high concentrations of nitric oxide (NO)1, a potent antimicrobial compound, via inducible nitric oxide synthases (iNOS and NOS2) [1–3]. NO is reactive under biological conditions and the observed toxicity results from this reactivity. For example, NO interacts with metals such as iron and copper, and depending on the metal oxidation state can result in the formation of stable complexes or in redox chemistry with the metal. Additionally, NO can react with oxygen or superoxide to form highly reactive species that cause oxidative and so-called nitrosative damage to the cell [4–6]. The ability to withstand this oxidative damage is likely an important process during microbial pathogenesis. Recent studies suggest that many pathogens including S. enterica, C. neoformans, and C. albicans, are able to detoxify immune system-derived NO by producing flavohemoglobins that can oxidize NO to the less toxic nitrate (NO3−) [7–9].
Histoplasma capsulatum is a fungal respiratory pathogen that infects macrophages and is able to evade macrophage killing [10–12]. It exists in two morphological states: a mycelial form in the soil and a yeast form inside the host. Upon inhalation of the mycelial spores, H. capsulatum converts into a yeast form that then infects and multiplies within macrophages. Subsequently, the infection can spread to other organs, including the spleen, liver, and bone marrow. Although previous studies report that macrophage production of NO is important for restricting H. capsulatum growth, the effect of NO is fungistatic rather than fungicidal [13]. Therefore, H. capsulatum can persist in a latent state in the host for many years, which is likely due to NO resistance.
Although H. capsulatum does not appear to have a flavohemoglobin, previous work done by Nittler et al. using a shotgun genomic microarray, identified NOR1, a gene that encodes for a protein with high sequence similarity to P450 nitric oxide reductases (P450nor) [14]. A number of P450nors have been identified in denitrifying fungi, including some that are pathogenic [15–20]. Denitrification is a microbial process of dissimilatory nitrate reduction to produce energy [21, 22]. During denitrification, NO is produced from NO2− by nitrite reductases. The conversion of NO to nitrous oxide (N2O) renders NO nontoxic. The P450nors have relatively high sequence and structural similarity with other P450 enzymes. Although cytochrome P450 proteins catalyze a vast array of reactions, the primary amino acid sequences and tertiary structures are well conserved [23–25]. Therefore, the reaction catalyzed by a P450 enzyme cannot be necessarily predicted based on sequence homology. Although P450 enzymes typically catalyze monooxygenase reactions, the P450nors are unique in that they catalyze the reduction of NO. The overall reaction catalyzed by P450nors is shown in equation 1.
| (eq.1) |
The two electrons required for NO reduction are directly transferred as a hydride from NAD(P)H to the P450nor–NO complex, in contrast to other P450 enzymes where the electrons are donated one at a time via redox partners involving flavins and iron-sulfur centers [18].
NOR1 expression is constitutively expressed in mycelial cultures, which is not surprising given that the mycelial form of the organism lives in the soil where denitrification normally occurs. However, NOR1 expression is induced in the parasitic yeast form only when NO is present, suggesting that the organism may have adapted a P450nor for detoxifying NO during infection. Indeed, ectopic overexpression of NOR1 in yeast cells appears to provide some protection against NO-related stress [14].
Given that H. caspulatum lacks a flavohemoglobin, along with previous work by Nittler et. al clearly showing an association of this putative NO reductase with pathogen exposure to NO, we sought to determine if Nor1p was indeed, a P450 NO reductase. In this work, we describe the spectral characteristics and enzymatic activity of Nor1 and compare it to other P450nors as well as the flavohemoglobins that have been shown to be important for protection against NO during infection.
MATERIALS AND METHODS
Construction of Expression Plasmid
DNA encoding the H. capsulatum NOR1 coding sequence was obtained from A. Sil (University of California, San Francisco) [14]. Nor1p(47-450) was cloned with a C-terminal His6-tag into the pCW vector. The following primers were used: forward primer 5′-TGAATTCCATATGTCCACCGAGGCCGCCC-3′, reverse primer #1 5′-TTAGTGGTGGTGGTGGTGGTGCCAAACAACAGGAAGCTC-3′, and reverse primer #2 5′ CCCAAGCTTTTAGTGGTGGTGGTGGTGGTG-3′. Reverse primer #1 was used to add the C-terminal His6-tag and reverse primer #2 was used to add a HindIII restriction site. The forward primer contained a NdeI restriction site. The Nor1p(47-450) His6-tag PCR fragment was then cloned into pCW and the construct was confirmed by DNA sequencing.
Protein Expression and Purification
The pCW/Nor1p(47-450) plasmid was transformed into E. coli JM109 cells for protein expression. A single colony was used to inoculate 50 mL of TB medium containing 50 μg/mL ampicillin and then grown with shaking at 37°C. After overnight growth, three 1 L flasks of fresh medium were inoculated with the overnight culture. The cultures were grown at 250 rpm at 37°C to an OD600 of ~0.5. The cultures were then cooled to 25°C and expression was induced by addition of 1 mM IPTG. The cultures were shaken for another 18 h before the cells were harvested by centrifugation and stored at −80°C.
Protein purification was carried out in two steps using nickel chelate and anion exchange chromatography. Frozen pellets were thawed and suspended in buffer A [50 mM Na2HPO4 (pH 7.5), 300 mM NaCl, 20 mM imidazole, 5 mM β-mercaptoethanol, 5% glycerol] containing 1 mM Pefabloc (Pentapharm), 1 mM benzamidine, and 50 μL DNase I (5μg/mL). The cell suspension was then lysed with an Emulsiflex-C5 high-pressure homogenizer (Avestin, Inc) and pelleted at 140,000g for 45 min. After centrifugation, the supernatant was applied to a 3 mL column of Ni-NTA Superflow resin (Qiagen) equilibrated with buffer A. The column was washed with five column-volumes of buffer A and one column volume of buffer A containing 1 M NaCl and 30 mM imidazole. Bound protein was eluted with 250 mM imidazole in buffer A. The eluted protein was concentrated using a Vivaspin 20 10K filter (Vivascience) before it was buffer-exchanged into buffer B [20 mM HEPES (pH 7.5), 1 mM DTT, 5% glycerol] using a PD-10 column (GE Healthcare) and applied to a POROS HQ 20 μm (10mm × 100 mm) anion-exchange column (Applied Biosystems) that was equilibrated with buffer B. The flow-thru was collected, concentrated, and stored at −80°C. Purity of the protein was assessed by SDS-PAGE.
UV/Vis Spectroscopy
All spectra were collected in an anaerobic cuvette on a Varian Cary 3E Bio UV/vis spectrometer equipped with a Neslab RTE-100 temperature controller containing 50% ethylene glycol as an anti-freezing agent. Spectra were recorded from protein samples that were diluted in 50 mM TEA (pH 7.5), 20 mM NaCl, 5% glycerol, and 0.1 mM DTT (buffer C). Nor1p-Fe3+-NO was prepared by the addition of NO gas (99.5%, Praxair, Inc.) after bubbling it through a 50% w/v KOH solution. Nor1p-Fe2+-CO was prepared by reducing Nor1p-Fe3+ with dithionite and flushing the headspace with CO gas (99.5%, Praxair, Inc.).
N2O gas analysis
N2O production by Nor1p was monitored by gas chromatography. The reactions were carried out in 15 mL anaerobic tubes (Supelco) containing 2 mL of 100 mM potassium phosphate (pH 7.5), 5 mM NADH, 0.5 μM DEA-NONOate (Cayman Chemical), and ~120 nM enzyme. The reaction was first incubated at 37°C for 30 min to allow the DEA-NONOate to fully react, and then initiated with enzyme at 25°C. Headspace (5 μL) was sampled and injected into anaerobic 2 mL vials after the reaction was initiated with enzyme. N2O production was analyzed on a Shimadzu GC14A Gas Chromatograph with an Electron Capture Detector (ECD) (Silver Lab, UC Berkeley). To identify N2O, a 10.2 ppm N2O standard was used (Praxair, Inc.).
Nitric Oxide Analysis
NO reduction by Nor1p was assayed anaerobically in 5 mL screw cap vials sealed with silicone/TFE septa (Supelco). The reaction mixtures (2 mL) consisted of buffer C, 3 mM NADH, 10 nM enzyme, and varying amounts of NO gas (0 to 40 μM NO). The NADH/buffer C mixtures were prepared in an anaerobic glovebag. Varying amounts of NO gas were injected using a gas-tight Hamilton syringe. The reactions were then initiated with enzyme at 25°C and shaken frequently so that equilibrium between the gas and liquid phases could be reached rapidly. The headspace was sampled using a gas-tight Hamilton syringe and injected directly into a Sievers Nitric Oxide Analyzer NOA 280i (GE Analytical Instruments). The initial rates were obtained from data fit between 1 and 4 min.
To quantify the amount of NO consumed, buffer C saturated with NO gas was used to generate a NO calibration curve. The standards were generated in 5 mL vials containing 2 mL of buffer C. The samples were flushed with NO gas for 20 min and a 5 μL sample of headspace was taken to make a 1:1000 dilution in a 5 mL anaerobic vial. Different volumes of headspace (2.5, 5, 7,5, 10 μL) were sampled from this vial and injected into the NOA. Using Henry’s Law and the Henry’s Law Constant for NO (2 mM at 25°C), the calibration curve was plotted based on moles of NO versus observed peak area [26].
RESULTS AND DISCUSSION
Although P450nor enzymes serve important energetic and NO detoxification roles in denitrifying fungi, it is also possible that these proteins have protective roles during infection. In the work reported here a putative cytochrome P450nor from H. capsulatum, NOR1, was expressed and purified. Spectral and kinetic studies were then carried out to determine whether Nor1p would be a good candidate for detoxifying NO in vivo.
Expression and Purification of Nor1p
With the exception of Fusarium oxysporum P450nor (FoP450nor), which has been expressed in E. coli [27], all previously characterized P450nors were purified directly from the fungus [16, 20, 28]. Unfortunately, NOR1 is only expressed in H. capsulatum in either its highly infectious mycelial form or under nitric oxide-induced stress in its less infectious yeast form [14]. Thus, purifying large enough quantities of Nor1 protein for biochemical characterization directly from its source was not practical.
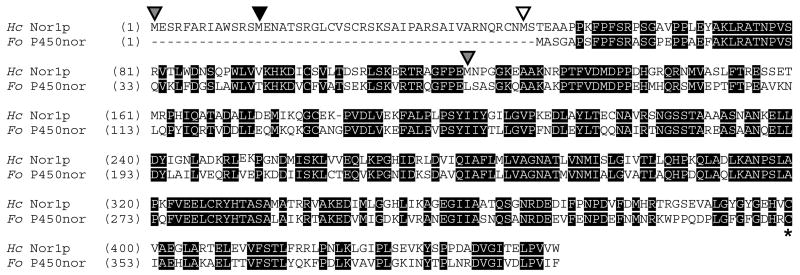
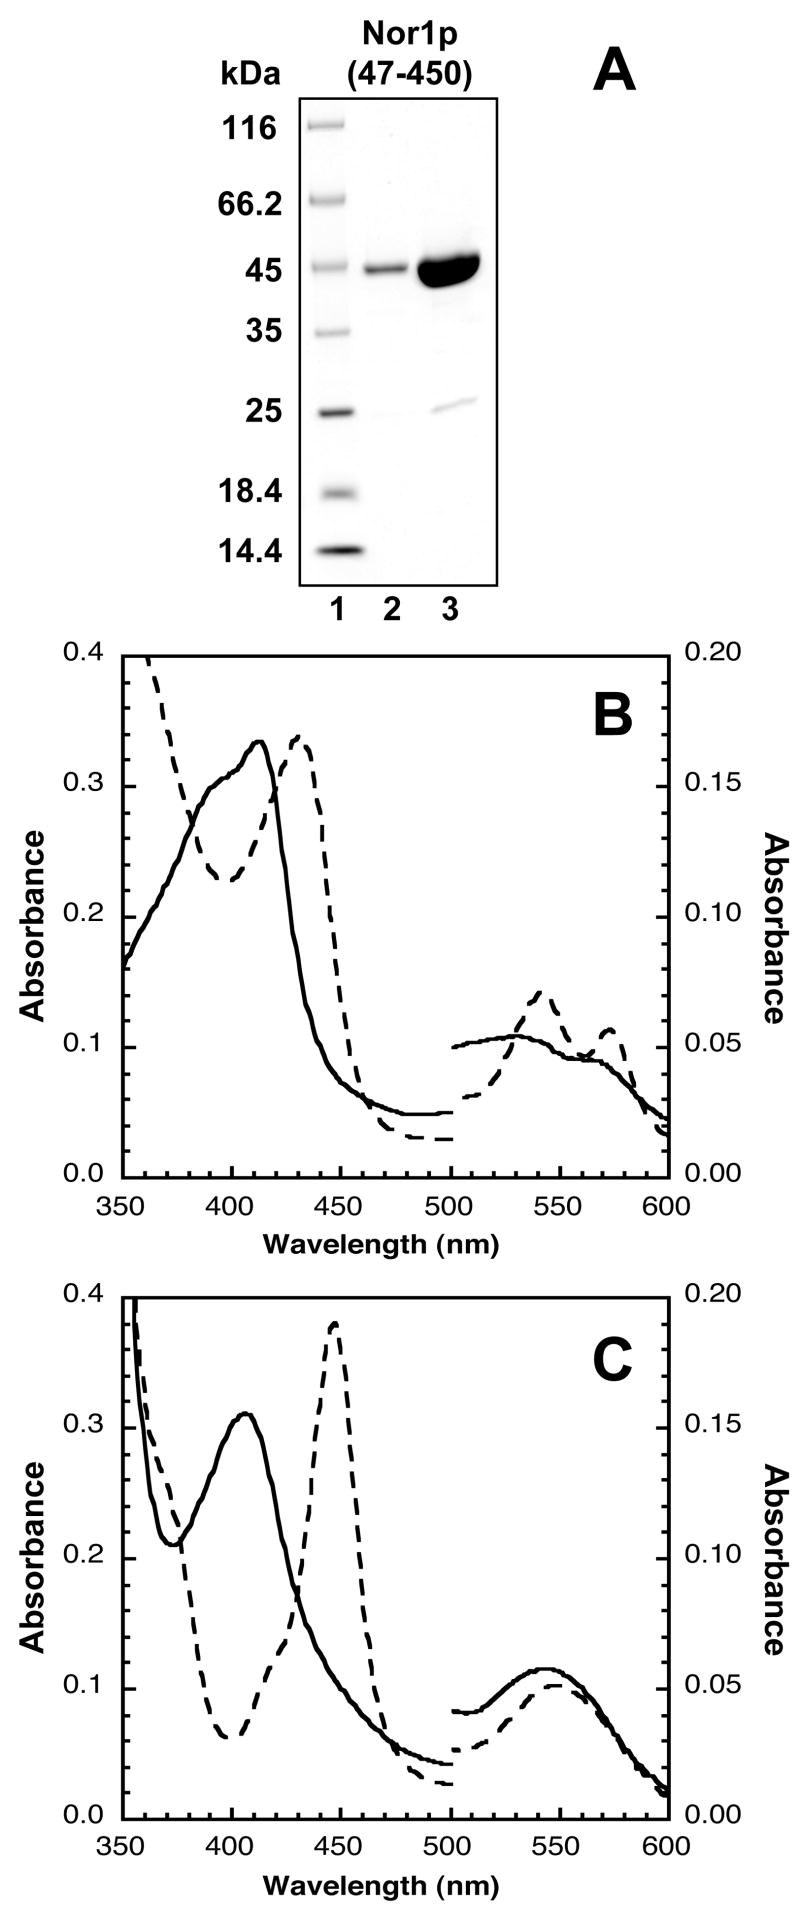
Cytochrome P450 proteins such as FoP450nor have been successfully expressed at high levels in E. coli JM109 cells using the pCW vector, which contains a Ptac-tac promoter that allows for direct induction by IPTG [27, 29]. This approach was also taken to isolate Nor1p. At least two NOR1 transcripts have been mapped, one 50 amino acids longer (Nor1p(1-450)) and one 69 amino acids shorter (Nor1p(120-450)) than FoP450nor (Figure 1). Additionally, there are at least another two potential transcription start sites, 40, and 139 bp downstream of the longer NOR1 transcript. Both Nor1p(137-450) and Nor1p(69-450) were expressed, but the shorter construct did not express in JM109 cells and the longer construct was truncated and had a low heme Soret maximum to 280 nm ratio (data not shown). However, Nor1p(47-450), which was similar to FoP450nor in length and sequence (61% identity; 79% similarity), was expressed and purified to > 95% homogeneity for characterization (Figure 1; Figure 2A). All other experiments were conducted with this construct. Typically, 1 mg/L of Nor1p(48-450) was isolated. The heme Soret absorbance maximum to 280 nm absorbance maximum ratio for the purified protein was ~1.7.
Figure 1.
Alignment between predicted H. capsulatum Nor1p (Hc Nor1p) and F. oxysporum P450nor (Fo P450nor). Identical residues are shaded in black. Gray arrowheads mark the start of the two predicted Nor1 proteins. The start of the Nor1(47-450) protein that was characterized in this study is marked with a white arrowhead. Another potential start that was not examined here is marked with a black arrowhead. The cysteine that ligates the heme is marked with a star. The alignment was generated using AlignX from Vector NTI®(Invitrogen).
Figure 2.
Electronic absorption spectra of Nor1p(47-450) in various oxidation/ligation states. (A) SDS-PAGE gel analysis of Nor1p(47-450). Protein samples were mixed with SDS loading dye with reductant, boiled and run on a 10–20% Tris-glycine gel. Lane 1, Unstained Protein Molecular Weight Marker (Fermentas); Lane 2, Nor1p (~2 μg); Lane 3, Nor1p (~10 μg). (B) Solid line, ligand-free Fe3+-Nor1p; dashed line, NO-bound Fe3+-Nor1p. (C) Solid line, dithionite-reduced Fe2+-Nor1p; dashed line, CO-bound Fe2+-Nor1p.
Nor1p Spectral Characteristics
The UV/vis absorption spectra of Nor1p in various oxidation/ligation states were obtained under anaerobic conditions. The spectra were similar to those previously described for other fungal P450nors Table 1. Nor1p was isolated in the Fe3+-unligated state which was characterized by Soret absorbance maximums at 390 and 412 nm, and split α/β bands at 530 and 564 nm. This spectrum indicated that the Fe3+ heme was a mixture of high-spin and low-spin states (Figure 2B). The Soret absorbance maximum shifted to 432 nm and the α/β bands shifted to 542 and 573 nm when NO was bound. The dithionite-reduced form of Nor1p had absorbance peaks at 407 and 544 nm, and its CO-ligated form yielded a spectral species with peaks at 447 and 546 nm that was characteristic of P450 proteins (Figure 2C).
Table 1.
Electronic absorption peak positions for various iron-ligand states of P450 nitric oxide reductasesa b,
| Protein | Iron-ligand | Soret | α/β | ref |
|---|---|---|---|---|
| HcNor1p | Fe3+ | 390/412 | 530/564 | This work |
| FoP450nor | 414 | 533/565 | [15, 30] | |
| AoAnor | 390/414 | 535/568 | [16] | |
| TcP450nor | 390/412 | 532/570 | [20] | |
| HcNor1p | Fe3+-NO | 432 | 542/573 | This work |
| FoP450nor | 431 | 539/572 | [15, 30] | |
| HcNor1p | Fe2+ | 407 | 544 | This work |
| FoP450nor | 406 | 540 | [15, 30] | |
| AoAnor | 412 | 541 | [16] | |
| TcP450nor | 408 | 542 | [20] | |
| HcNor1p | Fe2+-CO | 447 | 546 | This work |
| AoAnor | 446 | 548 | [16] | |
| TcP450nor | 447 | [20] | ||
| CtNor2 | 447 | [28] |
Absorbances are in nanometers.
Activity of Purified Nor1p
Nittler et al. showed that NOR1 expression is sufficient to confer resistance to NO and so we assessed the activity of Nor1p using a combination of UV/vis spectroscopy, GC-ECD, and NO analysis to determine if this predicted P450nor could play a role in the detoxification of NO.
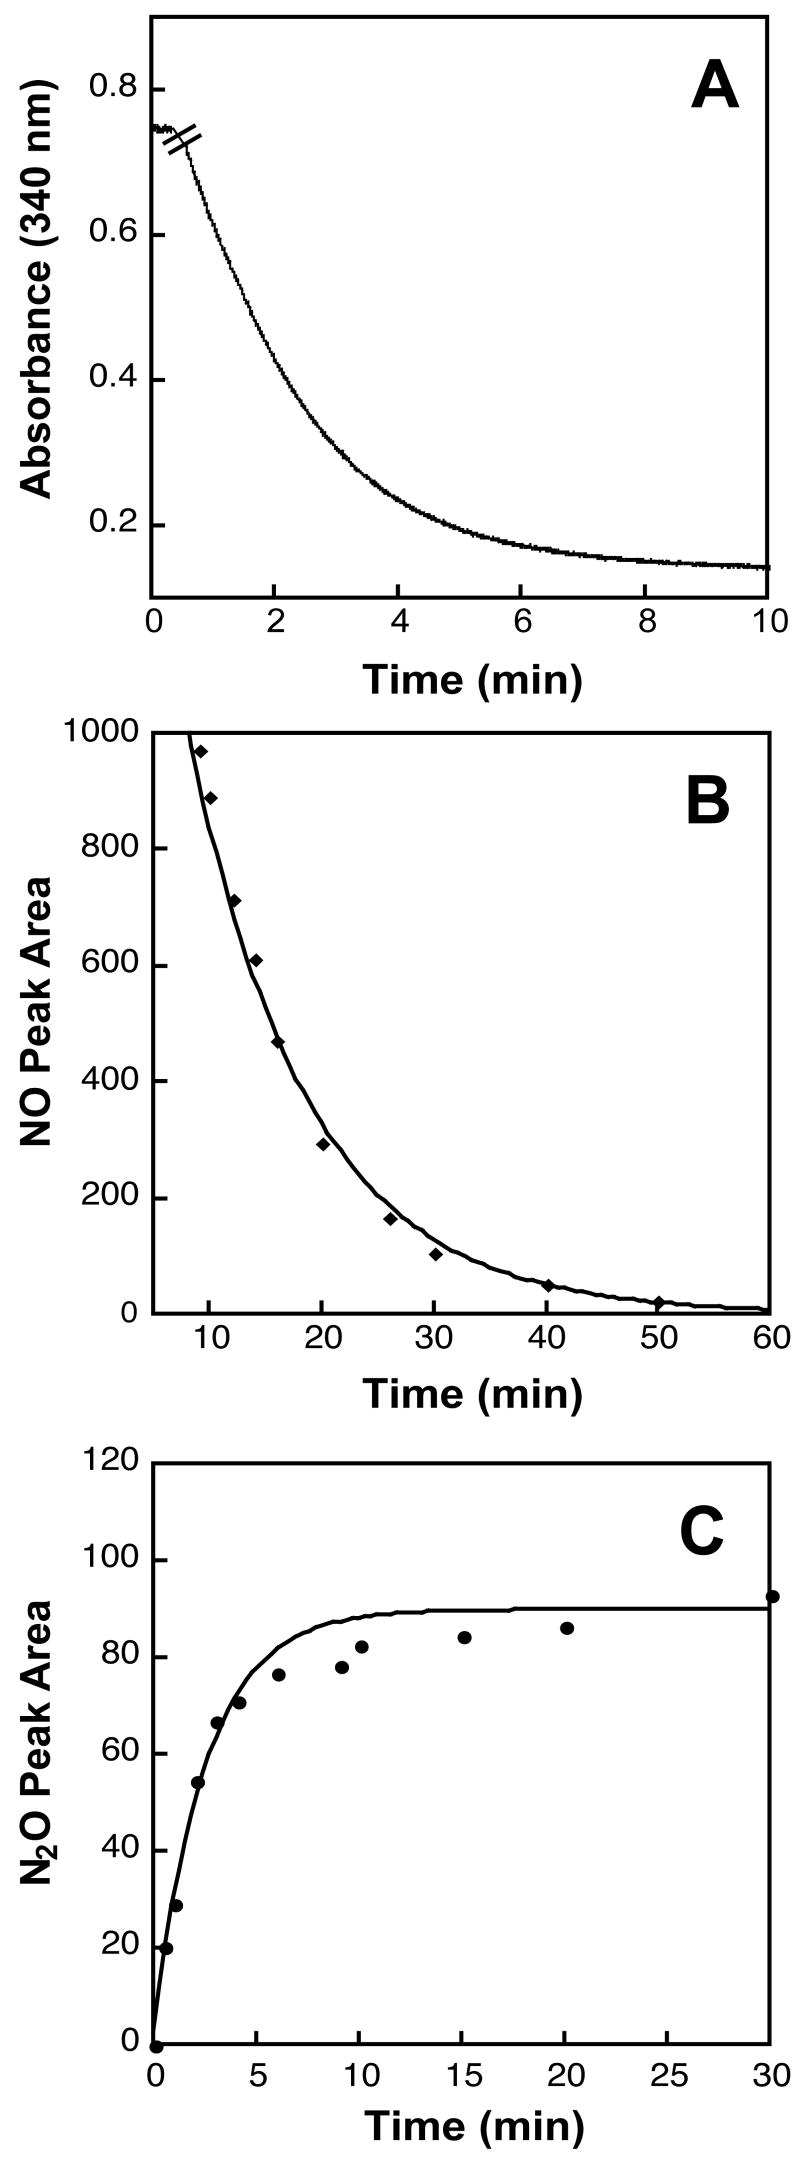
Unlike other cytochrome P450 proteins, the fungal P450nors are unique in that they do not require a protein partner to deliver electrons to the heme iron. Instead hydride transfer occurs directly from NAD(P)H. P450nors from Aspergillus oryzae (AoAnor), Cylindrocarpon tonkinense (CtNor1, Nor2), and Trichosporon cutaneum (TcP450nor) are capable of utilizing both NADH and NADPH, whereas the P450nor from F. oxysporum (FoP450nor) greatly prefers NADH over NADPH [15, 16, 19, 20]. The ability of Nor1p to oxidize NADH and NADPH was examined by UV/vis spectroscopy under saturating NO buffer conditions. Similar to FoP450nor, Nor1p oxidized NADH but had no activity with NADPH (Figure 3A); NADH oxidation was NO dependent and the specific activity was ~ 5000 moles μg−1 min−1. GC-ECD analysis indicated that Nor1p produced N2O when both NADH and NO are present in the reaction, verifying that Nor1p produces N2O from NO (Figure 3B). Additionally, a nitric oxide analyzer (NOA) was used to monitor NO consumption over time (Figure 3C).
Figure 3.
Activities of purified Nor1p(48-450). (A) Time course of the absorbance change of NADH (~0.13 mM) at 340 nm in the presence of saturated NO. The hatch mark indicates the time when enzyme (~130 nM) was added to the sample. There was no oxidation observed with NADPH. (B) Time course change of NO peak area measured by NOA. DEA-NONOate (1mM) was allowed to react in 100 mM phosphate buffer, pH 7.5, 5 mM NADH for 30 min at 37°C. The reaction sample (2 mL in a 5 mL gas-tight vial) was then cooled to 25°C before enzyme (~130 nM) was added. Headspace (15 μL) was sampled every few minutes. In the absence of enzyme, there was no significant change in the NO concentration (data not shown). (C) Time course change of N2O peak area measured by GC-ECD. DEA-NONOate (500 μM) was allowed to react with 2 mL NADH/phosphate buffer in a 15 mL gas-tight vial before enzyme (~40 nM) was added to initiate the reaction. Headspace (5 μL) was sampled every few minutes. Each time point represents duplicate samples and the error bars represent ranges.
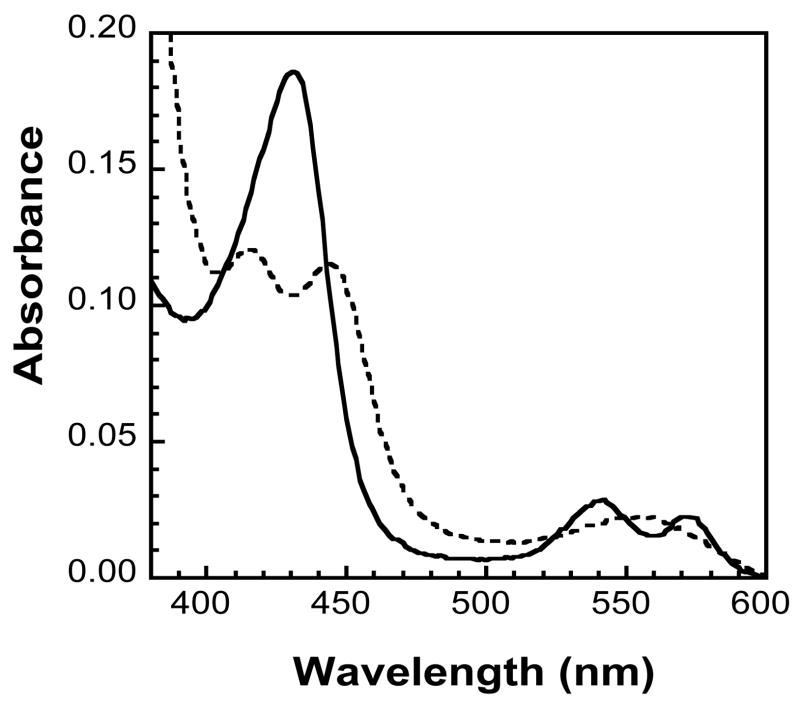
The reduction of the Fe3+–NO state of Nor1p with NADH was also examined by UV/vis spectroscopy. Previous mechanistic studies indicate that the reduction of NO to N2O occurs via an as yet to be determined intermediate with a characteristic absorbance maximum at 444 nm [30]. This intermediate was also observed when NADH is added to Fe3+–NO Nor1p at −10°C (Figure 4). Upon addition of NADH to the NO–bound Fe3+-Nor1 protein, the absorbance maximum shifts from 432 nm to a 442 nm intermediate; the Fe3+-enzyme was concomitantly observed at 414 nm, similar to what has been previously observed. Together these results confirmed that the activity of this P450nor was similar to other P450nors in that it reduced NO to N2O and that this activity was NADH dependent.
Figure 4.
Electronic absorption spectra of NO-bound Fe3+-Nor1p (solid line) and its intermediate NADH reduced product (dotted line) observed at −10°C. The NO and NADH concentrations were both ~100 μM and the amount of Nor1p protein was ~2 μM.
NO turnover
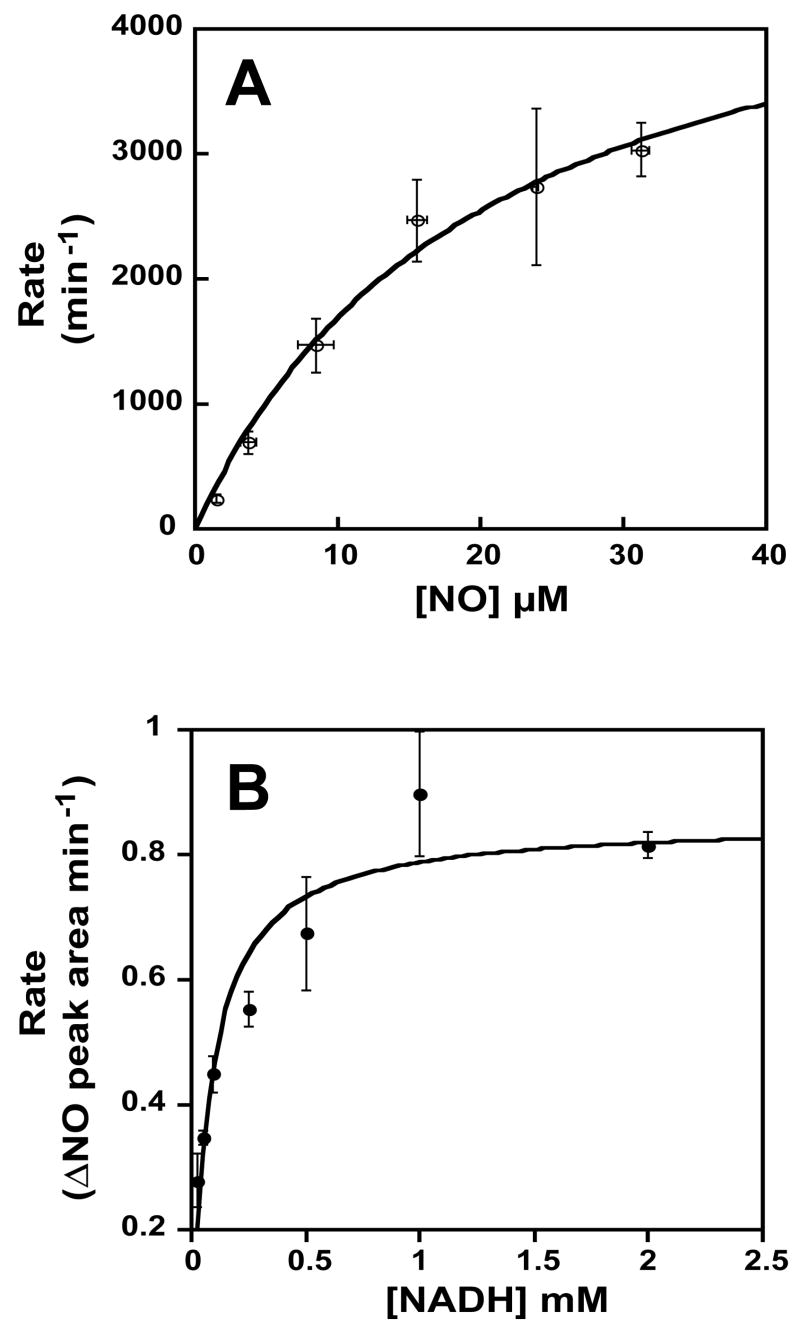
NO consumption was monitored using a NOA in order to characterize the catalytic turnover of NO by Nor1p at 25°C as a function of NO concentration. As was shown in Figure 3B, the NO consumption was dependent on the addition of Nor1p. The initial rate of NO consumption was obtained from the slope at t = 0 at various NO concentrations (0–32 μM), plotted, and fitted to a Michaelis-Menten equation (Figure 5A). From this plot, the NO turnover number was estimated to be 5000 min−1 and the KM to be 20 μM. This KM value was similar to CtNor1 (~20 μM), but 3- to 8-fold lower than other P450nors [19]. In contrast, the turnover for H. capsulatum Nor1p was approximately 6.5-fold less, but within an order of magnitude of CtNor1 (32,000 min−1). The estimated KM for NADH was 80 μM (Figure 5B), which was about 3.5-fold lower than that of all the other P450nors. This discrepancy was probably due to the fact that all other fungal P450nor turnover rates were determined under different reaction conditions by GC-MS, and not by NO consumption. Additionally, the kinetic parameters for the other fungal P450nors were determined via double reciprocal plots. This procedure may misrepresent the error distribution; hence, it is a less reliable method for determining KM and turnover rates. Nevertheless, given that both methods yield apparent results, the true KM and turnover rate may be lower in vivo, where other cellular factors may also contribute to the overall P450nor activity. It should also be noted that only one potential isoform of H. capsulatum Nor1p was characterized in this study. There are probably other Nor1 isoforms with varying activities.
Figure 5.
Kinetics of NO consumption by Nor1p. (A) Activity in the presence of increasing concentrations of NO. The data were fit to a Michaelis-Menten equation to yield the estimated KM and maximum turnover number for NO. (B) Activity in the presence of increasing concentrations of NADH. The data were fit to a Michaelis-Menten equation to yield the estimated KM for NADH.
Nevertheless, the rate at which Nor1p turns over NO was similar to other P450nors. Compared with the flavohemoglobins that have been implicated in NO detoxification during infection, the P450nors also have similar NO turnover rates [5,000–40,000 min−1 (P450nors) versus 200–40,000 min−1 (flavohemoglobins)]. In contrast, the P450nor KM values for NO are generally lower (20–150 μM), in comparison to the flavohemoglobins (130–250 μM), indicating that they are likely more efficient at metabolizing NO [19, 31, 32].
In summary, H. capsulatum Nor1p exhibited NO reductase activity similar to other previously characterized fungal P450nors. H. capsulatum is the first reported fungal pathogen to contain a P450nor that may be important in conferring resistance to NO during infection without the aid of a flavohemoglobin [14]. Although the fungal P450nors are generally considered to be important for detoxifying NO during denitrification, which is an anaerobic process, it is possible that fungal P450nors, including H. capsulatum Nor1 may also function in micro-aerobic or -anaerobic environments of infected tissue. Indeed, there is evidence for a protective role of flavorubredoxin-type NO reductases against NO in pathogenic bacteria during microaerobic growth [33–35]. Due to their ability to metabolize NO as efficiently as the flavohemoglobins, the P450nors are good candidates for future experiments addressing their role in fungal virulence.
Acknowledgments
We thank Emily Derbyshire, Joshua Woodward, Steven Reece, Emily Weinert, and Rosalie Tran for critical reading of this manuscript. We also thank Anita Sil, Paige Nittler, Jacquin Niles, Stephen Mills and members of the Marletta, Rine, and Sil labs for useful discussion.
Funding was provided by grants from the NIH (GM31105 & GM35827, J.R.).
Abbreviations: NO, nitric oxide; RNS, reactive nitrogen species; P450nor, P450 nitric oxide reductase; IPTG, isopropyl β-D-thiogalactopyranoside; HEPES, 4-(2-hydroxyethyl)piperazine-1-ethanesulfonic acid; DTT, dithiotheitol; DEA-NONOate, 1,1-diethyl-2-hydroxy-2-nitrosohydrazine; NADH, nicotinamide adenine dinucleotide, reduced; NOA, nitric oxide analyzer; FoP450nor, F. oxysporum P450nor; CtNor1, C. tonkinense P450nor isoform 1; CtNor2, C. tonkinense P450nor isoform 2; AoAnor, A. oryzae P450nor; TcP450nor, T. cutaneum P450nor
Publisher's Disclaimer: This is a PDF file of an unedited manuscript that has been accepted for publication. As a service to our customers we are providing this early version of the manuscript. The manuscript will undergo copyediting, typesetting, and review of the resulting proof before it is published in its final citable form. Please note that during the production process errors may be discovered which could affect the content, and all legal disclaimers that apply to the journal pertain.
References
- 1.Marletta MA. J Biol Chem. 1993;268:12231–12234. [PubMed] [Google Scholar]
- 2.Moncada S, Palmer RM, Higgs EA. Pharmacol Rev. 1991;43:109–142. [PubMed] [Google Scholar]
- 3.Wienberg JB. In: Nitric oxide and infection. Fang FC, editor. Kluwer Academic/Plenum Publishers; New York: 1999. pp. 95–150. [Google Scholar]
- 4.Dedon PC, Tannenbaum SR. Arch Biochem Biophys. 2004;423:12–22. doi: 10.1016/j.abb.2003.12.017. [DOI] [PubMed] [Google Scholar]
- 5.DeGroote MA, Fang FC. In: Nitric oxide and infection. Fang FC, editor. Kluwer Academic/Plenum Publishers; New York: 1999. pp. 231–261. [Google Scholar]
- 6.Miranda KM, Espey MG, Wink DA. J Inorg Biochem. 2000;79:237–240. doi: 10.1016/s0162-0134(99)00241-x. [DOI] [PubMed] [Google Scholar]
- 7.de Jesus-Berrios M, Liu L, Nussbaum JC, Cox GM, Stamler JS, Heitman J. Curr Biol. 2003;13:1963–1968. doi: 10.1016/j.cub.2003.10.029. [DOI] [PubMed] [Google Scholar]
- 8.Stevanin TM, Poole RK, Demoncheaux EA, Read RC. Infect Immun. 2002;70:4399–4405. doi: 10.1128/IAI.70.8.4399-4405.2002. [DOI] [PMC free article] [PubMed] [Google Scholar]
- 9.Ullmann BD, Myers H, Chiranand W, Lazzell AL, Zhao Q, Vega LA, Lopez-Ribot JL, Gardner PR, Gustin MC. Eukaryot Cell. 2004;3:715–723. doi: 10.1128/EC.3.3.715-723.2004. [DOI] [PMC free article] [PubMed] [Google Scholar]
- 10.Bullock WE. Arch Med Res. 1993;24:219–223. [PubMed] [Google Scholar]
- 11.Eissenberg LG, Goldman WE. Clin Microbiol Rev. 1991;4:411–421. doi: 10.1128/cmr.4.4.411. [DOI] [PMC free article] [PubMed] [Google Scholar]
- 12.Woods JP. Fungal Genet Biol. 2002;35:81–97. doi: 10.1006/fgbi.2001.1311. [DOI] [PubMed] [Google Scholar]
- 13.Nakamura LT, Wu-Hsieh BA, Howard DH. Infect Immun. 1994;62:680–684. doi: 10.1128/iai.62.2.680-684.1994. [DOI] [PMC free article] [PubMed] [Google Scholar]
- 14.Nittler MP, Hocking-Murray D, Foo CK, Sil A. Mol Biol Cell. 2005;16:4792–4813. doi: 10.1091/mbc.E05-05-0434. [DOI] [PMC free article] [PubMed] [Google Scholar]
- 15.Daiber A, Shoun H, Ullrich V. J Inorg Biochem. 2005;99:185–193. doi: 10.1016/j.jinorgbio.2004.09.018. [DOI] [PubMed] [Google Scholar]
- 16.Kaya M, Matsumura K, Higashida K, Hata Y, Kawato A, Abe Y, Akita O, Takaya N, Shoun H. Biosci Biotechnol Biochem. 2004;68:2040–2049. doi: 10.1271/bbb.68.2040. [DOI] [PubMed] [Google Scholar]
- 17.Kudo T, Tomura D, Liu DL, Dai XQ, Shoun H. Biochimie. 1996;78:792–799. doi: 10.1016/s0300-9084(97)82538-2. [DOI] [PubMed] [Google Scholar]
- 18.Nakahara K, Tanimoto T, Hatano K, Usuda K, Shoun H. J Biol Chem. 1993;268:8350–8355. [PubMed] [Google Scholar]
- 19.Toritsuka N, Shoun H, Singh UP, Park SY, Iizuka T, Shiro Y. Biochim Biophys Acta. 1997;1338:93–99. doi: 10.1016/s0167-4838(96)00193-8. [DOI] [PubMed] [Google Scholar]
- 20.Zhang L, Takaya N, Kitazume T, Kondo T, Shoun H. Eur J Biochem. 2001;268:3198–3204. doi: 10.1046/j.1432-1327.2001.02206.x. [DOI] [PubMed] [Google Scholar]
- 21.Averill BA. Chem Rev. 1996;96:2951–2964. doi: 10.1021/cr950056p. [DOI] [PubMed] [Google Scholar]
- 22.Zumft WG. Microbiol Mol Biol Rev. 1997;61:533–616. doi: 10.1128/mmbr.61.4.533-616.1997. [DOI] [PMC free article] [PubMed] [Google Scholar]
- 23.Coon MJ. Annu Rev Pharmacol Toxicol. 2005;45:1–25. doi: 10.1146/annurev.pharmtox.45.120403.100030. [DOI] [PubMed] [Google Scholar]
- 24.Guengerich FP. Chem Res Toxicol. 2001;14:611–650. doi: 10.1021/tx0002583. [DOI] [PubMed] [Google Scholar]
- 25.Park SY, Shimizu H, Adachi S, Nakagawa A, Tanaka I, Nakahara K, Shoun H, Obayashi E, Nakamura H, Iizuka T, Shiro Y. Nat Struct Biol. 1997;4:827–832. doi: 10.1038/nsb1097-827. [DOI] [PubMed] [Google Scholar]
- 26.R. Sander, in, 1999.
- 27.Okamoto N, Tsuruta K, Imai Y, Tomura D, Shoun H. Arch Biochem Biophys. 1997;337:338–344. doi: 10.1006/abbi.1996.9786. [DOI] [PubMed] [Google Scholar]
- 28.Usuda K, Toritsuka N, Matsuo Y, Kim DH, Shoun H. Appl Environ Microbiol. 1995;61:883–889. doi: 10.1128/aem.61.3.883-889.1995. [DOI] [PMC free article] [PubMed] [Google Scholar]
- 29.Barnes HJ, Arlotto MP, Waterman MR. Proc Natl Acad Sci USA. 1991;88:5597–5601. doi: 10.1073/pnas.88.13.5597. [DOI] [PMC free article] [PubMed] [Google Scholar]
- 30.Shiro Y, Fujii M, Iizuka T, Adachi S, Tsukamoto K, Nakahara K, Shoun H. J Biol Chem. 1995;270:1617–16123. doi: 10.1074/jbc.270.4.1617. [DOI] [PubMed] [Google Scholar]
- 31.Gardner PR. J Inorg Biochem. 2005;99:247–266. doi: 10.1016/j.jinorgbio.2004.10.003. [DOI] [PubMed] [Google Scholar]
- 32.Gardner PR, Gardner AM, Martin LA, Dou Y, Li T, Olson JS, Zhu H, Riggs AF. J Biol Chem. 2000;275:31581–31587. doi: 10.1074/jbc.M004141200. [DOI] [PubMed] [Google Scholar]
- 33.Anjum MF, Stevanin TM, Read RC, Moir JW. J Bacteriol. 2002;184:2987–2993. doi: 10.1128/JB.184.11.2987-2993.2002. [DOI] [PMC free article] [PubMed] [Google Scholar]
- 34.Gomes CM, Giuffre A, Forte E, Vicente JB, Saraiva LM, Brunori M, Teixeira M. J Biol Chem. 2002;277:25273–25276. doi: 10.1074/jbc.M203886200. [DOI] [PubMed] [Google Scholar]
- 35.Householder TC, Fozo EM, Cardinale JA, Clark VL. Infect Immun. 2000;68:5241–5246. doi: 10.1128/iai.68.9.5241-5246.2000. [DOI] [PMC free article] [PubMed] [Google Scholar]


