Abstract
Purpose
Angiographic endpoints for transcatheter arterial chemoembolization (TACE) of hepatocellular carcinoma (HCC) are subjective, and optimal endpoints remain unknown. Transcatheter intraarterial perfusion magnetic resonance imaging (TRIP-MRI), when performed in a combined MR-interventional radiology (MR-IR) suite, offers an objective method to quantify intra-procedural tumor perfusion changes, but was previously limited to two spatial dimensions. We prospectively tested the hypothesis that a new volumetric acquisition over time, 4D TRIP-MRI, can measure HCC perfusion changes during TACE.
Materials and Methods
Seven men (mean age 53 years, range 42-65 years) with eight tumors (mean size 2.5×2.4 cm2, diameter range 1.5-5.2 cm) underwent TACE in an MR-IR suite between 2/2007-12/2007, with intra-procedural tumor perfusion reductions monitored using 4D TRIP-MRI. Microcatheter TACE was performed using 1:1 chemotherapy:emulsifying contrast mixture followed by gelatin microspheres. Pre- and post-TACE time-intensity curves were generated for each tumor. Semi-quantitative measures of tumor perfusion, including area under curve (AUC), peak signal intensity (SI), time to peak SI, and maximum upslope (MUS), were calculated, and mean differences pre- and post-TACE were compared using paired t-tests.
Results
4D TRIP-MRI monitored TACE was successful in all cases. Calculated pre- and post-TACE AUC (439 versus 221, P=0.004, 50% reduction), peak SI (32 versus 19, P=0.012, 41% reduction), and MUS (11 versus 3, P=0.028, 73% reduction) showed statistically significant reductions after TACE. Time to peak SI did not significantly change (23 versus 36 seconds, P=0.235, 57% increase).
Conclusions
4D TRIP-MRI can successfully measure semi-quantitative changes in HCC perfusion during MR-IR monitored TACE. Future studies may correlate changes in these objective functional parameters with tumor response.
Introduction
Although transcatheter arterial chemoembolization (TACE) is an established treatment for unresectable hepatocellular carcinoma (HCC) (1, 2), the optimal angiographic endpoints for this procedure remain unknown. Currently, there is no definitive literature consensus regarding the preferable degree of tumor embolization (3), either stasis (complete cessation of antegrade blood flow to tumor) or substasis (reduction of antegrade blood flow to tumor). Furthermore, the relationship between angiographic endpoints and tumor therapeutic response is at present undetermined. In general, substasis angiographic endpoints are endorsed to reduce potential complications and obstacles presented by complete or over-embolization. These include accelerated liver failure (4, 5), elimination of future arterial access to tumor should repeat liver directed intraarterial therapy be necessary, and possible induction of cancer angiogenesis and tumor recurrence (6, 7). As subjective angiographic endpoints for TACE have been shown to vary widely between operators (8), accurate and objective determination of substasis endpoints remains a challenge for interventional radiologists.
In contrast to digital subtraction angiography (DSA), magnetic resonance (MR) imaging allows more objective and reliable assessment of tumor function during transcatheter liver directed embolotherapies (9). We previously demonstrated that transcatheter intraarterial perfusion magnetic resonance imaging (TRIP-MRI), which utilizes direct catheter-based intraarterial injections of gadolinium (Gd) contrast, may be employed to measure functional changes in first pass perfusion during hepatic tumor embolization in rabbits (10, 11). This technology has recently undergone clinical translation in a combined magnetic resonance / digital subtraction angiography unit (termed MR-IR suite) for intra-procedural monitoring and quantification of tumor perfusion changes during TACE (8, 12), but was limited by two dimensional (2D) acquisition protocols. We have since implemented an improved approach termed 4D TRIP-MRI, which serially monitors perfusion levels during TACE using three spatial and one time dimension by imaging a volume of treated liver every two seconds using MR fluoroscopy. In this study, we tested the hypothesis that 4D TRIP-MRI can be used to measure semi-quantitative perfusion changes in HCC during MR-IR monitored TACE.
Materials and Methods
This prospective study was approved by our hospital’s Institutional Review Board, and was in compliance with the Health Insurance Portability and Accountability Act. All patients provided written informed consent.
Clinical setting, patients, and tumors
Between February and December 2007, seven patients with surgically unresectable HCC presenting for TACE at a single University affiliated hospital in a large metropolitan area were enrolled for study. All patients were deemed candidates for TACE based on discussion at a weekly institutional multi-disciplinary conference. TACE inclusion and exclusion criteria were modified from Brown et al (13). Inclusion criteria consisted of (a) age greater than 18 years, (b) Eastern cooperative oncology group (ECOG) performance status ≤ 2, (c) Child-Pugh class A or B, (d) focal or multi-focal HCC, (e) estimated glomerular filtration rate > 30 mL/min, (f) no contraindications to MR imaging, and (g) submission of informed consent. No patients met exclusion criteria of (a) life expectancy less than six months, (b) ECOG performance status ≥ 3, (c) Child-Pugh class C, (d) uncorrectable coagulopathy (international normalized ratio greater than 1.5), (e) total bilirubin greater than 4.0 mg/dL, (f) serum creatinine greater than 2.0 mg/dL, (g) uncorrectable thrombocytopenia (platelet count less than 50,000 per μL), or (h) contraindications to MR imaging. Patients with portal vein thrombosis were included if superselective segmental TACE was technically feasible.
The diagnosis of HCC was established non-invasively, based upon the presence of a hepatic mass ≥ 2 cm diameter with characteristic imaging findings in the setting of liver cirrhosis (14). Surgical unresectability was determined by attending transplant surgery physicians, and consisted of portal vein thrombosis in two patients. The remaining patients underwent TACE to maintain eligibility for future intended liver transplantation.
Patient demographics and tumor characteristics
Seven patients (all men; mean age 53 years, range 42-65 years) were included. Underlying liver disease included alcoholic (n = 2), hepatitis C virus (n = 3), and hepatitis B virus (n = 1) cirrhosis, as well as cirrhosis related to hemochromatosis (n = 1). Liver disease included both Child-Pugh class A (n = 2) and B (n = 5) disease. Mean model for end-stage liver disease (MELD) score was 12 (range 7-19). Eastern Cooperative Oncology Group performance status was 0 (n = 1) or 1 (n = 6). Okuda stages included stage 1 (n = 2) and stage 2 (n = 5), and Cancer of the Liver Italian Program stages were early (n = 1) and intermediate (n = 6).
Eight total tumors were treated. All tumors were focal and circumscribed in nature, and were located in segments 2 (n = 1), 4 (n = 1), 6 (n = 1), 7 (n = 2), or 8 (n = 3). Mean tumor size was 2.5 × 2.4 cm2 (diameter range 1.5-5.2 cm). Two patients had portal vein thrombosis. Mean alpha fetoprotein (AFP) level was 6,936 ng/dL (range 1-48,285). Six tumors had not been previously treated, whereas two tumors had undergone previous TACE. Although some patients in this study were candidates for radiofrequency ablation therapy as a bridge to liver transplantation based on HCC size and location, TACE was selected as the optimal locoregional therapy in these patients during institutional multi-disciplinary conference discussion.
MR-IR unit
All TACE procedures were performed in a dedicated MR-IR suite (Miyabi; Siemens, Erlangen, Germany) that contains a flat panel DSA system integrated with a 1.5 T Espree MR imaging scanner via a moving table. Patients were transferred between the IR angiography table and MR imaging scanner according to institutional safe transfer protocol in which an itemized checklist was systematically reviewed by physician operators, angiographic technicians, and angiography nurses prior to patient relocation to account for all present ferromagnetic devices and to prevent inadvertent transfer of these items to the MR imaging scanner.
TACE
TACE was performed by a single Certificate of Added Qualification licensed interventional radiologist with over ten years of clinical experience (R.A.O.). Patients were prepared and draped in standard sterile fashion while supine on the angiographic procedure table, and routine arterial access was gained via the right common femoral artery. Initial mapping visceral angiography was then performed using a 5 French catheter (cobra, Sos, or Simmons 1). Subsequent lobar or segmental angiography in the tumor vascular distribution was performed using a coaxially placed 2.8 French microcatheter (Renegade Hi-Flo; Boston Scientific, Natick MA) after vessel selection with a 0.016 inch diameter guidewire (Headliner; Terumo Medical, Aliso Viejo CA). Catheter position was confirmed using DSA with iohexol (Omnipaque 300; Amersham Health, Princeton NJ) injection. After selecting the appropriate catheter position for TACE, patients were transferred to the adjacent MR imaging scanner on a moving table. Vascular catheters were covered using a sterile drape to allow for placement of an MR torso array coil. Pre-TACE MR imaging was then performed.
Following MR imaging, patients were transferred back to the IR angiography table for TACE. Chemoembolization was performed via the coaxially placed 2.8 French microcatheter with a 1:1, 20 mL volume solution of chemotherapy agents and emulsifying contrast (Ethiodol; Savage Laboratories, Melville NY). Chemotherapy regimens consisted of cisplatin 100 mg and mitomycin C 30 mg, with or without doxorubicin 40 mg. The chemotherapy suspension was injected under direct fluoroscopic observation. Chemotherapy infusion was continued to a substasis or stasis angiographic endpoint. Endpoints were graded according to the subjective angiographic chemoembolization endpoint (SACE) scale, a scheme designed to assist in reproducibly classifying angiographic TACE endpoints (8). This scale is based on the Thrombolysis In Myocardial Infarction (TIMI) flow grade used in coronary angiography (15), and consists of four levels: (1) normal antegrade arterial flow and normal or reduced tumor blush, (2) reduced antegrade arterial flow and reduced tumor blush, (3) reduced antegrade arterial flow and no tumor blush, (4) no antegrade arterial flow and no tumor blush. Substasis embolization was defined as SACE levels 1-3, while stasis embolization was defined as SACE level 4. Angiographic endpoints in this study corresponded to SACE levels 2, 3, or 4. The decision to perform TACE to stasis in some patients and to substasis in other patients was at the discretion of the attending interventional radiology operator. In general, embolization was performed to a substasis level in patients with elevated bilirubin levels and/or high likelihood to undergo future repeat TACE, while embolization was performed to a stasis level in patients with normal bilirubin levels and/or low likelihood to undergo future repeat TACE. TACE was then concluded by injecting 500-700 m diameter tris-acryl gelatin microspheres (Embosphere; Biosphere Medical, Rockland MA) mixed with iohexol. Completion angiography was performed after microsphere embolization. Following TACE, patients were again transferred to the MR imaging scanner for post-TACE completion MR imaging. After scanning, all catheters and vascular access devices were removed, and hemostasis was achieved with manual compression. Finally, post-TACE non-contrast abdominal computed tomography was obtained to assess the distribution of the injected chemotherapy emulsion.
4D TRIP-MRI acquisition
After patient transfer from the IR angiography table to the MR imaging scanner, patients underwent MR imaging in supine position using a torso array coil. Axial and coronal T1- and T2-weighted turbo spin echo (TSE) localization scans were performed to determine optimal slice positions for subsequent 4D TRIP-MRI. Localization scans were repeated after each MR-IR transfer to ensure consistent slice positions for serial TRIP-MRI measurements.
4D TRIP-MRI was performed using 3D gradient echo (GRE) imaging in axial orientations, providing full spatial coverage of the targeted liver segments. 3D GRE imaging allows rapid serial acquisition of T1-weighted images for first pass contrast enhanced MR imaging. Furthermore, GRE imaging provides strong T1-weighting with a relatively linear relationship between signal and contrast agent concentration (16). Sequence parameters were optimized to maximize linear signal increase based upon: (a) conservative estimates of pre- and post-injection T1 range of 100-2000 ms, (b) requisite coverage and spatial resolution (17), and (c) requisite sampling rates for our first pass hepatic perfusion measurements (17). 4D TRIP-MRI scan parameters included: TR / TE = 3.8 / 1.7 msec, 192 × 128 matrix, 300-340 mm field of view, 5 mm slice thickness, GRAPPA factor-2, and 24-28 partitions. These slice positions were repeatedly sampled for 40 seconds (2.5 second sampling rate for each 3D slab). Five seconds after beginning this image acquisition, the interventional radiologist hand injected gadopentetate dimeglumine (Gd; Magnevist, Berlex, Montville, NJ) through the existing hepatic artery catheter. Each TRIP-MRI contrast injection was tailored based upon targeted vessel caliber and blood flow rates. Lobar hepatic artery injections used 10 mL of 20% Gd solution at 2 mL/sec, while segmental injections used 4 mL of 20% Gd at 1 mL/sec. The objective in using these injection protocols was to demonstrate perfusion to the targeted liver segments, while avoiding reflux of injected contrast agent into non-targeted angiographic territories. Immediately prior to Gd injection, patients were instructed to breath hold in inspiration for 30 seconds to minimize respiratory motion during first passage of the contrast agent. To maintain consistency, each patient underwent the same 4D TRIP-MRI scanning and contrast injection protocol before and after TACE.
Following each 4D TRIP-MRI scan, 2D multi-slice T1-weighted GRE scans were performed for conventional delayed phase contrast enhanced depiction of the liver. Typical time to complete the entire MR-IR monitored procedure was 2.5 hours, with transfer time between IR angiography table and MR imaging scanner averaging ten minutes.
Measured outcomes and data analysis
4D TRIP-MRI image series were exported to a Siemens Argus computer workstation. Based upon localization scans, 4D TRIP-MRI slice positions were selected at the center of each tumor. Two regions of interest (ROIs) were chosen, encompassing the entire tumor within this central slice. The time-intensity curve (TIC) was then measured at all voxel positions within this slice. Composite TIC, formed by averaging all of the voxel-wise curves within ROI, was plotted. Subsequently, tumor perfusion change was measured by calculating four different semi-quantitative perfusion parameters: area under curve (AUC), peak signal intensity (SI), time to peak SI, and maximum upslope (MUS).
For AUC calculation, each pre-TACE 4D TRIP-MRI image series was evaluated to determine the optimal post-injection time interval for measurement. A signal integration interval beginning with the initiation of signal enhancement and closing just beyond peak signal enhancement was then selected. After selecting the integration interval and subtracting baseline (pre-contrast) signal intensity, AUC was calculated for each voxel-wise TIC to produce a spatially resolved perfusion map of semi-quantitative perfusion within the targeted vascular territory. To maintain consistency, post-TACE 4D TRIP-MRI series were analyzed by employing an identical time interval for AUC calculations. Peak SI and time to peak SI were acquired from TICs. MUS was determined by calculating interval slope between adjacent consecutive data points on the TIC, and selecting the highest value. Finally, volume of injected chemotherapy emulsion and embolic agent were correlated with tumor perfusion reduction for each TACE session.
Statistical analysis
Pre- and post-TACE TRIP-MRI semi-quantitative measures of tumor perfusion were compared separately for each tumor using a two tailed paired t-test, with α = 0.05. We separately determined the correlation of tumor perfusion reduction with injected volume of (a) chemotherapy emulsion and (b) microspheres using linear regression. Statistical analysis was performed utilizing a commercially available software package (SigmaStat 3.0; SPSS Inc., Chicago, IL).
Results
TACE
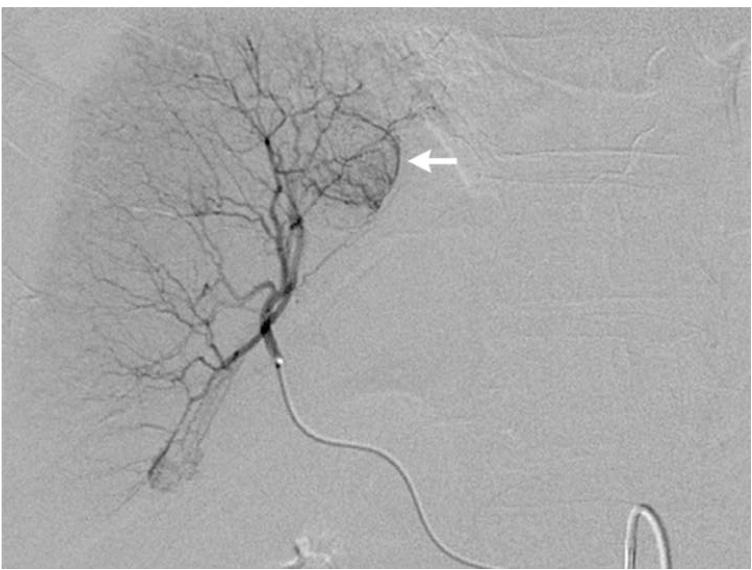
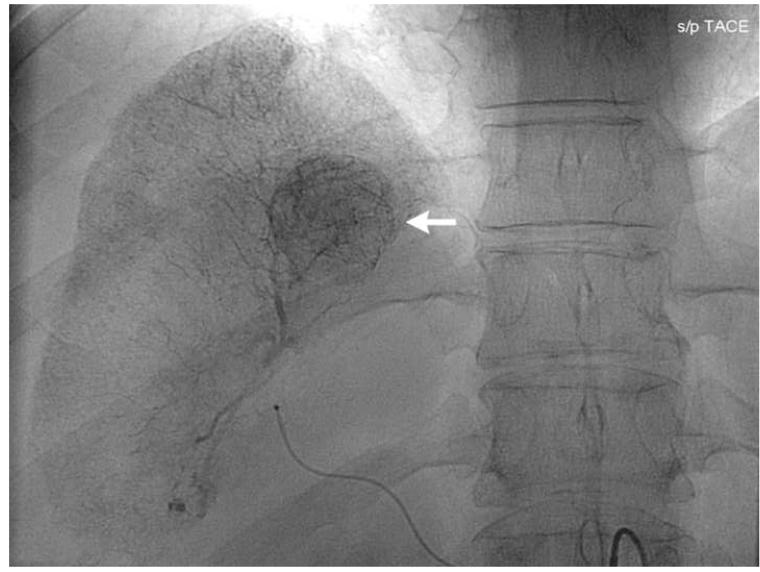
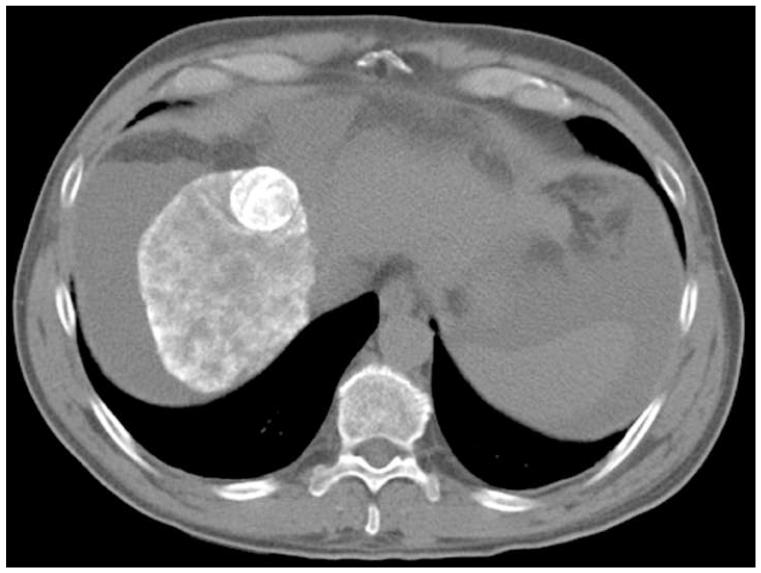
Segmental (seven tumors) and lobar (one tumor) TACE was successfully performed to a substasis or stasis angiographic endpoint in all cases (Fig. 1). SACE level 2 was attained in one tumor, SACE level 3 was achieved in five tumors, and SACE level 4 was reached in two tumors. A mean volume of 6.8 mL (34% of total available volume, range 3-15 mL) of chemotherapeutic agent was infused, followed by injection of 1.6 mL (16% of one vial, range 1-4 mL) mean volume of 500-700 μm diameter gelatin microspheres. No procedure-related complications were encountered.
Figure 1.
Pre-TACE angiography (a) demonstrates hypervascular tumor (arrow) in segment 8 of right hepatic lobe. Angiography following lobar TACE to SACE 3 (b) reveals chemotherapy emulsion localized within tumor (arrow), confirmed on post-TACE non-contrast abdominal computed tomography scan (c).
4D TRIP-MRI and semi-quantitative measures of tumor perfusion
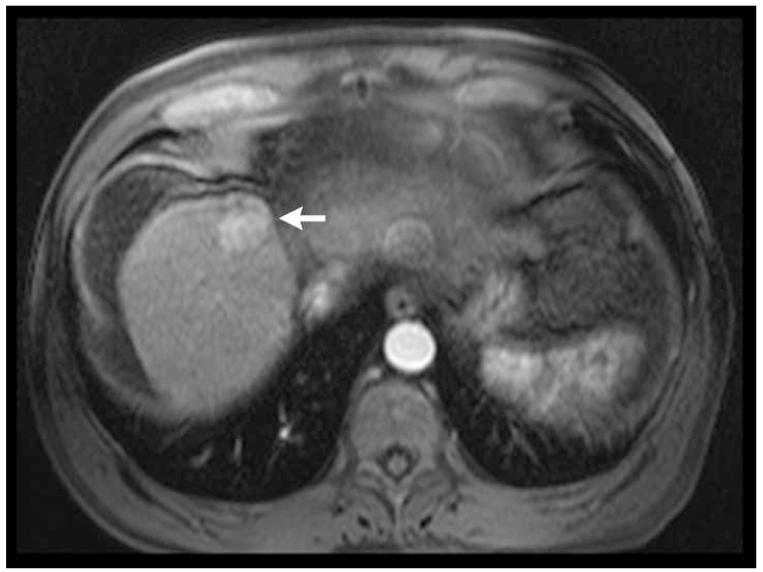
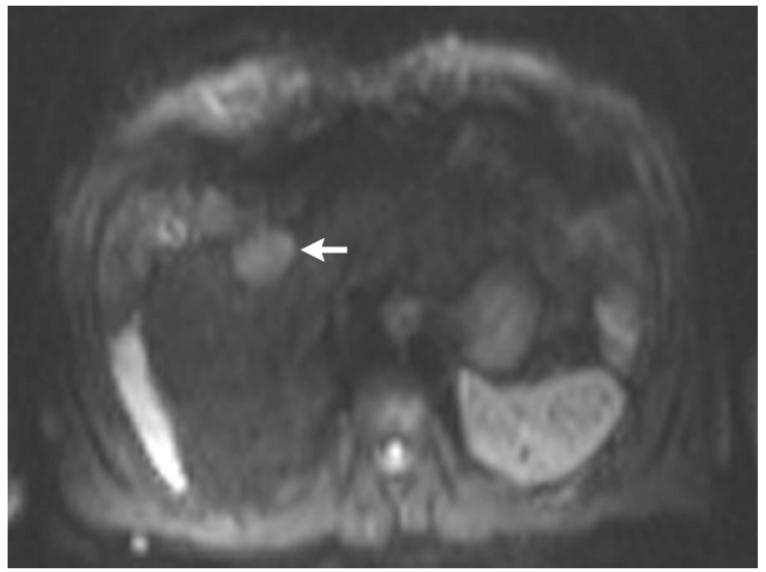
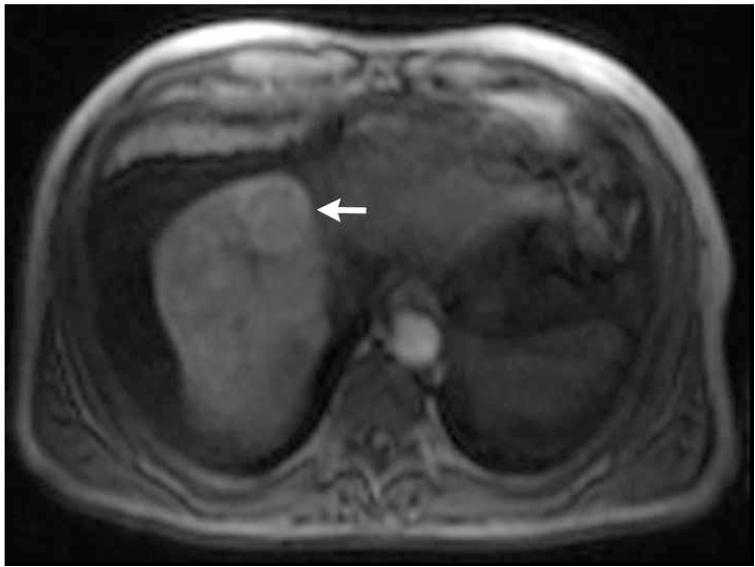
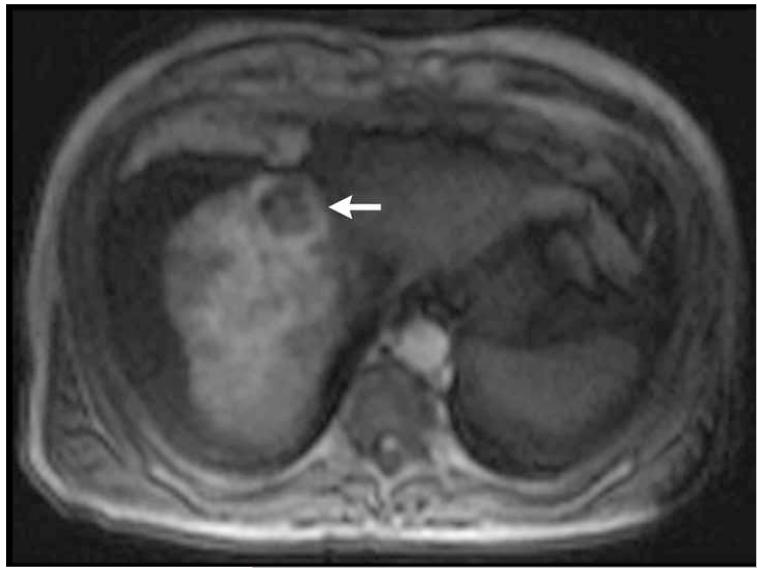
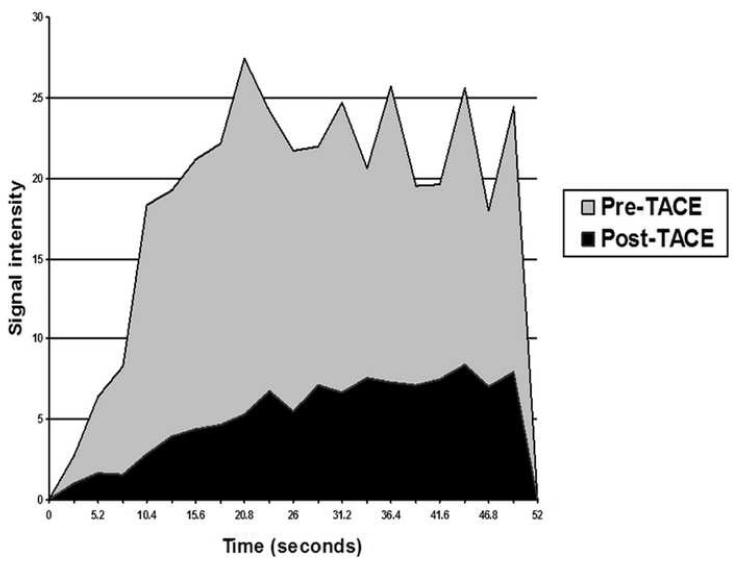
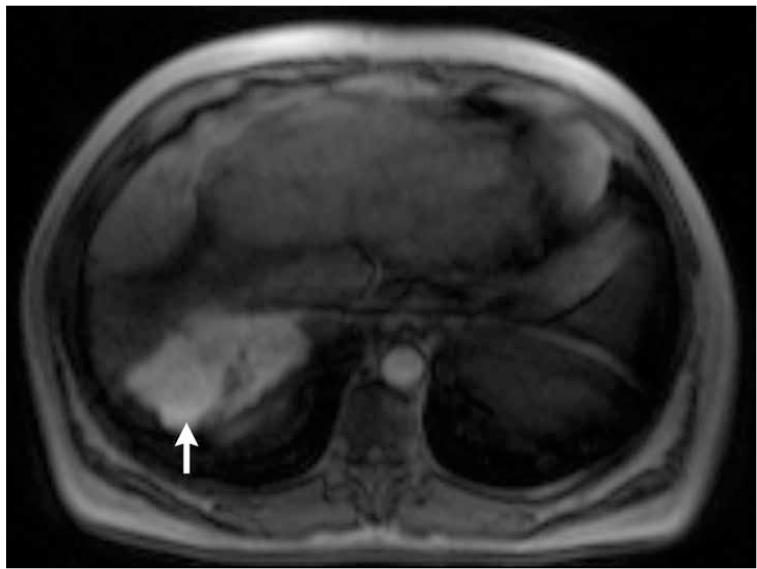
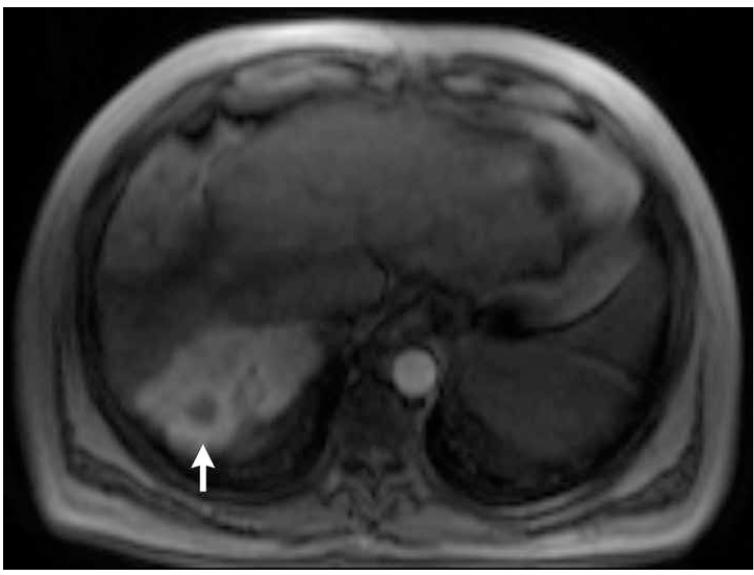
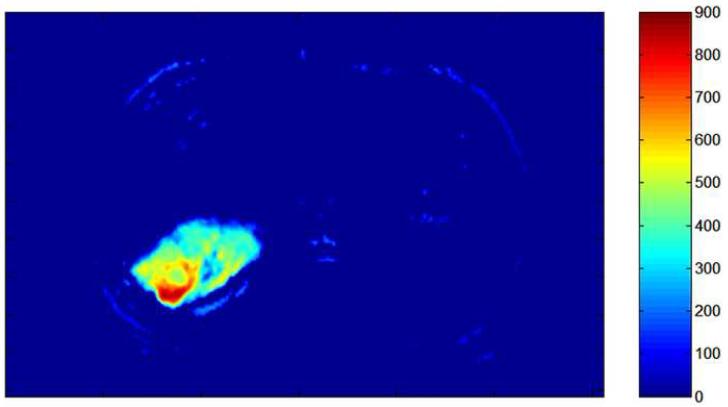
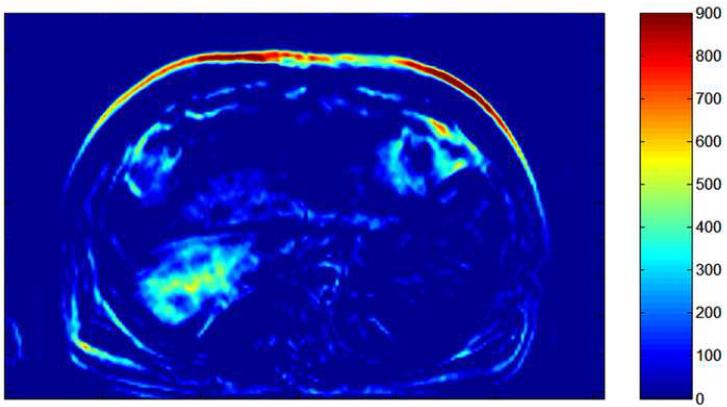
Intra-procedural 4D TRIP-MRI was technically successful in all cases (Fig. 2), as was subsequent TIC generation (Fig. 3). Calculated pre- and post-TACE AUC, peak SI, and MUS all showed statistically significant reductions after TACE (Table). Quantitative reductions in tumor perfusion corresponded to decreases in absolute tumor enhancement, peak level of enhancement, and rate of enhancement following therapy, and were apparent on generated tumor perfusion maps (Fig. 4). While time to peak SI increased after TACE, this change was not statistically significant (Table). There was no clinically useful relationship between tumor perfusion reduction and injected volume of chemotherapy emulsion (r2 = 0.35) or injected volume of gelatin microspheres (r2 = 0.31).
Figure 2.
Post-contrast T1-weighted (a) and diffusion weighted (b) MR scans obtained prior to TACE reveal segment 8 HCC, as shown in figure 1. Pre- (c) and post-TACE (d) 4D TRIP-MRI shows dramatic reduction in tumor perfusion (arrow) after embolization.
Figure 3.
Pre- and post-TACE time-intensity curves (for tumor shown in figures 1 and 2). Preand post-TACE tumor perfusion changes in this patient included: AUC reduction from 360 to 100, peak SI reduction from 27 to 8, MUS reduction from 10 to 1, and time to peak SI increase from 21 to 44 seconds.
Table.
Semi-quantitative measures of tumor perfusion
| Measure | Pre-TACE | Post-TACE | Percent change | P-value |
|---|---|---|---|---|
| AUC | 439 (61-1105) | 221 (22-865) | 50 | 0.004 |
| Peak SI | 32 (7-73) | 19 (6-59) | 41 | 0.012 |
| MUS | 11 (2-26) | 3 (1-30) | 73 | 0.048 |
| Time to peak SI | 23 sec (16-47) | 36 sec (10-52) | 57 | 0.235 |
TACE = transcatheter arterial chemoembolization, AUC = area under curve, SI = signal intensity, MUS = maximum upslope, sec = seconds
Figure 4.
Pre- (a) and post-TACE (b) 4D TRIP-MRI and corresponding AUC tumor perfusion maps (c) and (d) in different patient show significant reduction in segment 7 HCC (arrow) perfusion (AUC reduction from 505 to 242). Tumor perfusion is expressed in arbitrary units on colored scale, with 900 indicating maximum perfusion.
Discussion
In this prospective study, we developed 4D TRIP-MRI and clinically applied it within an MR-IR suite to successfully monitor HCC perfusion reductions during TACE for all seven treated patients. Using several different perfusion parameters, we measured statistically significant reductions in semi-quantitative objective measures of tumor perfusion. Calculated decreases in pre- and post-TACE AUC, peak SI, and MUS corresponded to reductions in absolute tumor enhancement, peak level of enhancement, and rate of enhancement following therapy. As such, 4D TRIP-MRI offers an objective, semi-quantitative, and effective method to monitor changes in perfusion to the targeted tumor and adjacent liver during TACE. This objective functional capacity cannot be assessed using traditional subjective DSA.
We have previously shown the value of 2D TRIP-MRI in documenting quantitative reductions in tumor perfusion during TACE (12). In the current study, 4D TRIP-MRI was clinically applied to assess reduction in tumor perfusion during MR-IR monitored TACE. 4D TRIP-MRI offers several advantages over the 2D approach. Foremost, as 4D TRIP-MRI provides real-time imaging in three spatial dimensions, there is improved volumetric assessment and coverage of tumors. Furthermore, 4D TRIP-MRI permits easier co-registration between preand post-TACE scans as compared to 2D acquired images. These benefits would be expected to translate into enhanced accuracy in semi-quantitative analysis of tumor perfusion as compared to 2D MR imaging. These advantages can be viewed within the context of fourth Biomedical Imaging Research Opportunities Workshop (BIROW IV) held in Bethesda, MD in 2006 (18). Cosponsored by 24 separate imaging societies, BIROW IV lauded the development of 4D image-guided interventional techniques that could be used to validate treatment endpoints (18).
In this investigation, perfusion maps readily demonstrated differences in blood flow within the targeted tumors prior to and following embolization. Given the mechanism of embolization in TACE, we postulate that the intra-procedural changes in measured perfusion parameters are most likely due to ischemic effects from injected embolic material. It remains uncertain to what extent observed reductions in these measures are related to cytotoxic effects of injected chemotherapy. Notably, however, we found no correlation between volume of injected chemotherapy or embolic agent and tumor perfusion reduction. This finding corresponds to the same result seen in a larger series of 18 tumors in 10 patients performed earlier in our TRIP-MRI experience (12), suggesting that this lack of correlation is unrelated to the small sample size in this study or differences in TACE angiographic endpoints between patients.
Variability in semi-quantitative measures of tumor perfusion seen in this study is concordant with our previous experience (8). AUC reductions ranged from 11% to 94%, peak SI reductions ranged from 6% to 80%, MUS reductions ranged from 56% to 89%, and time to peak SI increase ranged from 13% to 122% in this investigation. Differences in degree of observed perfusion reduction may be related to intrinsic differences in arterial blood flow to the targeted tumors, but emphasizes the discrepancy between angiographic and TRIP-MRI determined TACE endpoints. Specifically, variation in MR tumor perfusion reduction was observed for the different SACE levels of embolization among the eight tumors treated in this study, however small sample size precluded formal statistical correlation. Notably, we previously presented results in a series of 12 patients undergoing 15 TACE sessions in which no correlation between SACE level and MR perfusion reduction was identified (8), corroborating observations in the current study. Given the preliminary nature of this study and lack of clinical outcome data at this time, it is unclear if subjective angiographic assessment or objective measurement of TACE endpoints will correlate with clinical results. Studies investigating correlation between SACE level and changes in 4D TRIP-MRI objective functional parameters with effect on patient management, tumor response, and patient survival are currently ongoing.
There were several important limitations to this study. First our semi-quantitative 4D TRIP-MRI scans provided differences in relative tumor perfusion following TACE, rather than employing absolute quantitative measurements, such as the forward volume transfer constant (Ktrans) (19). However, we are in the process of developing these absolute quantitative approaches that will then allow comparison of absolute differences in perfusion between patients rather than just relative changes within the same patient. Second, TRIP-MRI can only assess segmental or lobar perfusion in the vascular distribution of the angiographic territory supplied distal to the catheter tip. Therefore, this technique cannot assess changes in perfusion resulting from collateral arterial (3, 4, 20) or portal venous supply. However, a follow-up intravenous injection of contrast agent could be performed after the post-TACE TRIP-MRI scan to provide this information. Third, TRIP-MRI is most applicable to focal tumors with circumscribed margins. Although none were studied in this series, diffuse or infiltrative tumors are more challenging to evaluate because it can be difficult to define tumor margins for ROI creation and subsequent TIC calculation. Fourth, this technique was applied to a small sample size of only eight tumors in seven patients in this study. Fifth, widespread application of intra-procedural TRIP-MRI is limited because most interventional radiologists do not have access to a combined MR-IR suite. Finally, we did not correlate 4D TRIP-MRI perfusion change with clinical outcomes. Such a study will be feasible once a larger sample size of patients is achieved.
Conclusion
In summary, semi-quantitative 4D TRIP-MRI, performed within an integrated MR-IR unit, may be successfully used to determine changes in HCC perfusion during TACE. This technique offers the ability to calculate semi-quantitative changes in tumor perfusion using a volumetric MR fluoroscopic acquisition. It may serve to allow accurate and objective determination of TACE endpoints, which could then be targeted during liver directed intraarterial therapies. Furthermore, this technique is capable of increasing operator confidence in catheter position for TACE by confirming appropriate catheter location in the tumor vascular distribution based on tumor gadolinium enhancement during TRIP-MRI acquisition. Future studies to correlate changes in 4D TRIP-MRI objective functional parameters with effect on patient management, tumor response, and patient survival are necessary and currently ongoing.
Footnotes
Publisher's Disclaimer: This is a PDF file of an unedited manuscript that has been accepted for publication. As a service to our customers we are providing this early version of the manuscript. The manuscript will undergo copyediting, typesetting, and review of the resulting proof before it is published in its final citable form. Please note that during the production process errorsmaybe discovered which could affect the content, and all legal disclaimers that apply to the journal pertain.
References
- 1.Llovet JM, Real MI, Montana X, et al. Arterial embolisation or chemoembolisation versus symptomatic treatment in patients with unresectable hepatocellular carcinoma: a randomised controlled trial. Lancet. 2002;359:1734–1739. doi: 10.1016/S0140-6736(02)08649-X. [DOI] [PubMed] [Google Scholar]
- 2.Lo CM, Ngan H, Tso WK, et al. Randomized controlled trial of transarterial lipiodol chemoembolization for unresectable hepatocellular carcinoma. Hepatology. 2002;35:1164–1171. doi: 10.1053/jhep.2002.33156. [DOI] [PubMed] [Google Scholar]
- 3.Brown DB, Geschwind JF, Soulen MC, Millward SF, Sacks D. Society of Interventional Radiology position statement on chemoembolization of hepatic malignancies. J Vasc Interv Radiol. 2006;17:217–223. doi: 10.1097/01.RVI.0000196277.76812.A3. [DOI] [PubMed] [Google Scholar]
- 4.Soo CS, Chuang VP, Wallace S, Charnsangavej C, Carrasco H. Treatment of hepatic neoplasm through extrahepatic collaterals. Radiology. 1983;147:45–49. doi: 10.1148/radiology.147.1.6828758. [DOI] [PubMed] [Google Scholar]
- 5.Charnsangavej C, Chuang VP, Wallace S, Soo CS, Bowers T. Angiographic classification of hepatic arterial collaterals. Radiology. 1982;144:485–494. doi: 10.1148/radiology.144.3.6285413. [DOI] [PubMed] [Google Scholar]
- 6.Guo WJ, Li J, Chen Z, et al. Transient increased expression of VEGF and MMP-1 in a rat liver tumor model after hepatic arterial occlusion. Hepatogastroenterology. 2004;51:381–386. [PubMed] [Google Scholar]
- 7.Rhee TK, Young JY, Larson AC, et al. Effect of transcatheter arterial embolization on levels of hypoxia inducible factor-1 alpha in rabbit VX2 liver tumors. J Vasc Interv Radiol. 2007;18:639–645. doi: 10.1016/j.jvir.2007.02.031. [DOI] [PubMed] [Google Scholar]
- 8.Lewandowski RJ, Wang D, Gehl J, et al. A comparison of chemoembolization endpoints using angiographic versus transcatheter intraarterial perfusion/MR imaging monitoring. J Vasc Interv Radiol. 2007;18:1249–1257. doi: 10.1016/j.jvir.2007.06.028. [DOI] [PubMed] [Google Scholar]
- 9.Rhee TK, Larson AC, Prasad PV, et al. Feasibility of blood oxygenation level-dependent MR imaging to monitor hepatic transcatheter arterial embolization in rabbits. J Vasc Interv Radiol. 2005;16:1523–1528. doi: 10.1097/01.RVI.0000182179.87340.D7. [DOI] [PubMed] [Google Scholar]
- 10.Wang D, Bangash AK, Rhee TK, et al. Liver tumors: monitoring embolization in rabbits with VX2 tumors — transcatheter intraarterial first-pass perfusion MR imaging. Radiology. 2007;245:130–139. doi: 10.1148/radiol.2451061689. [DOI] [PubMed] [Google Scholar]
- 11.Virmani S, Wand D, Gehl J, et al. Comparison of transcatheter intraarterial perfusion MR imaging and fluorescent microsphere perfusion measurements during transcatheter arterial embolization of rabbit liver tumors. J Vasc Interv Radiol. 2007;18:1249–1257. doi: 10.1016/j.jvir.2007.07.008. [DOI] [PubMed] [Google Scholar]
- 12.Larson AC, Wang D, Atassi B, et al. Transcatheter intraarterial perfusion (TRIP) — MRI monitoring of chemoembolization for hepatocellular carcinoma: feasibility of initial clinical translation. Radiology. 2008;246:964–971. doi: 10.1148/radiol.2463070725. [DOI] [PubMed] [Google Scholar]
- 13.Brown DB, Cardella JF, Sacks D, et al. Quality improvement guidelines for transhepatic arterial chemoembolization, embolization, and chemotherapeutic infusion for hepatic malignancy. J Vasc Interv Radiol. 2006;17:225–232. doi: 10.1097/01.RVI.0000195330.47954.48. [DOI] [PubMed] [Google Scholar]
- 14.Bruix J, Sherman M, Llovet JM, et al. Clinical management of hepatocellular carcinoma. Conclusions of the Barcelona — 2000 EASL conference. European Association for the Study of the Liver. J Hepatol. 2001;35:421–430. doi: 10.1016/s0168-8278(01)00130-1. [DOI] [PubMed] [Google Scholar]
- 15.TIMI Study Group The Thrombolysis in Myocardial Infarction (TIMI) trial (Phase I findings) N Engl J Med. 1985;312:932–936. doi: 10.1056/NEJM198504043121437. [DOI] [PubMed] [Google Scholar]
- 16.Materne R, Smith AM, Peeters F, et al. Assessment of hepatic perfusion parameters with dynamic MRI. Magn Reson Med. 2002;47:135–142. doi: 10.1002/mrm.10045. [DOI] [PubMed] [Google Scholar]
- 17.Pandharipande PV, Krinsky GA, Rusinek H, Lee VS. Perfusion imaging of the liver: current challenges and future goals. Radiology. 2005;234:661–673. doi: 10.1148/radiol.2343031362. [DOI] [PubMed] [Google Scholar]
- 18.Hendee WR. Biomedical imaging research opportunities workshop IV — a summary of findings and recommendations. Radiology. 2007;242:338–341. doi: 10.1148/radiol.2422060733. [DOI] [PubMed] [Google Scholar]
- 19.Jackson A, Haroon H, Zhu XP, Li KL, Thacker NA, Jayson G. Breath-hold perfusion and permeability mapping of hepatic malignancies using magnetic resonance imaging and a first-pass leakage profile model. NMR Biomed. 2002;15:164–173. doi: 10.1002/nbm.729. [DOI] [PubMed] [Google Scholar]
- 20.Michels NA. Collateral arterial pathways to the liver after ligation of the hepatic artery and removal of the celiac axis. Cancer. 1953;6:708–724. doi: 10.1002/1097-0142(195307)6:4<708::aid-cncr2820060411>3.0.co;2-a. [DOI] [PubMed] [Google Scholar]


