

Abstract
Mature stellate cells of the rat medial entorhinal cortex (EC), layer II, exhibit subthreshold membrane potential oscillations (MPOs) at theta frequencies (4–12 Hz) in vitro. We find that MPOs appear between postnatal days 14 (P14) and 18 (P18) but show little further change by day 28+ (P28–P32). To identify the factors responsible, we examined the electrical responses of developing stellate cells, paying attention to two currents thought necessary for mature oscillation: the h current Ih, which provides the slow rectification required for resonance; and a persistent sodium current INaP, which provides amplification of resonance. Responses to injected current revealed that P14 cells were often nonresonant with a relatively high resistance. Densities of Ih and INaP both rose by about 50% from P14 to P18. However, Ih levels fell to intermediate values by P28+. Given the nonrobust trend in Ih expression and a previously demonstrated potency of even low levels of Ih to sustain oscillation, we propose that resonance and MPOs are limited at P14 more by low levels of INaP than of Ih. The relative importance of INaP for the development of MPOs is supported by simulations of a conductance-based model, which also suggest that general shunt conductance may influence the precise age when MPOs appear. In addition to our physiological study, we analyzed spine densities at P14, P18, and P28+ and found a vigorous synaptogenesis across the whole period. Our data predict that functions that rely on theta rhythmicity in the hippocampal network are limited until at least P18.
INTRODUCTION
One of the most prominent electrical signals in the hippocampus and adjacent entorhinal cortex (EC) is the theta field potential (Kramis et al. 1975; Mitchell and Ranck 1980; Vanderwolf 1969). This rhythm, typically covering the 4- to 12-Hz band in vivo, is most commonly observed during voluntary movements and under certain conditions of alert wakefulness. Theta unit or population activity, phase-locked to hippocampal theta, has also been reported in a number of other brain areas, including the medial septum, the amygdala, the prefrontal cortex, and the nucleus accumbens (Bland and Oddie 2001; Seidenbecher et al. 2003; Siapas et al. 2005).
The function of this rhythm is unclear, although the suggestions are numerous, including the coordination of information flow between brain areas (Dickson et al. 2000a), sensory inhibition (Sainsbury 1998), sensorimotor integration (Bland and Oddie 2001), memory (Seidenbecher et al. 2003; Winson 1978), phase-dependent coding of information (Huxter et al. 2003; Jensen and Lisman 2000; O'Keefe and Recce 1993), and phase-dependent synaptic plasticity (Larson et al. 1986; Orr et al. 2001). Most recently, studies of the medial EC in the rat suggest a specific role in spatial coding. So-called grid cells in the superficial layers of medial EC activate as the animal enters points in space separated at regular intervals on an abstract lattice (Hafting et al. 2005). The periodic nature of this representation has led some to argue that the theta rhythm is critically involved (Blair et al. 2007; Burgess et al. 2007; Giocomo et al. 2007). Many of these functions are not mutually exclusive but, given their diversity, it is of interest to determine when and how the theta rhythm develops in the young animal. One might then be able to clarify the role of theta by correlating its emergence with particular cognitive or motor skills. Knowledge of the timing of theta development with respect to other developmental events may also aid our understanding of the mechanisms of theta generation in the mature animal.
A natural focus for a developmental study of theta generation is the stellate cell of layer II in the medial entorhinal cortex. Stellate cells are the principal projection neurons from the EC to the hippocampal formation (Steward and Scoville 1976; Witter 1993). They may also be grid cells because they are the most numerous principal neuron in layer II, which possesses the highest density of grid cells of all EC layers (Alonso and Klink 1993; Klink and Alonso 1997; Sargolini et al. 2006). When depolarized, stellate cells from medial EC produce clusters of spikes, loosely phase-locked to an intrinsic subthreshold membrane potential oscillation (MPO) in the theta range (Alonso and Klink 1993; Alonso and Llinás 1989). If combined with the appropriate synaptic interactions these cells could thus make an important contribution to theta rhythmogenesis and act as a direct source for hippocampal theta (Alonso and García-Austt 1987; Kocsis et al. 1999; Mitchell and Ranck 1980).
Theta-frequency MPOs in entorhinal stellate cells are believed to be generated by the interaction of an h current (Ih) and a persistent sodium current (INaP) (Alonso and Llinás 1989; Dickson et al. 2000b; Dorval and White 2005; Klink and Alonso 1993; White et al. 1998; see Nolan et al. 2007 for a divergent view and the discussion for more on this topic). According to current models, both Ih and INaP contribute to resonance by providing rectification and amplification, respectively (Dickson et al. 2000b; Hutcheon and Yarom 2000). Additionally, persistent sodium channels have a large conductance but occur in low numbers and contribute substantially to membrane noise (Magistretti and Alonso 1999; White et al. 1998). MPOs in current clamp are then the product of an Ih- and INaP-induced resonance, ringing in response to INaP-induced noise (Dorval and White 2005; White et al. 1998). Ih, supplemented by a calcium-dependent K+ current, is also thought to be involved in spike clustering (Fransén et al. 2004; Nolan et al. 2007). It is therefore reasonable to hypothesize that the expression profiles of Ih and INaP play a role in the development of theta rhythmicity in EC stellate cells. Here we examine the physiological development of stellate cells in rat medial entorhinal cortex in vitro and correlate this with expression of Ih and INaP. We also examine the morphological development of these cells, particularly with regard to spine development as an indication of capacity to support theta at the network level.
METHODS
Preparation and recording
Long–Evans rats were anesthetized with 1.5 ml 2-chloro-2-(difluoromethoxy)-1,1,1-trifluoro-ethane (isoflurane; Abbott Laboratories, Chicago, IL), diffused in a 4-L container, and were decapitated. Their brains were removed and placed dorsal side down in a chamber filled with ice-cold, oxygenated artificial cerebrospinal fluid (ACSF; see following text for details). Horizontal slices, 300 μm thick, of the hippocampal formation and entorhinal cortex were cut using a vibrating microtome (Vibratome 1000 Plus; Vibratome, St. Louis, MO). These were transferred to a second chamber of ACSF at room temperature and bubbled continuously with a 95% O2-5% CO2 mix for ≥1 h. All procedures involving animals were approved by the Charles River Campus Institutional Animal Care and Use Committee, Boston University.
For recording, slices were transferred to a third chamber of oxygenated ACSF held at 34°C. The tissue was imaged under infrared differential interference contrast optics (Carl Zeiss, Thornwood, NY) and viewed with the aid of an infrared camera (CCD 100; Dage-MTI, Michigan City, IN) and a TV monitor. Recordings were from medial entorhinal cortex, layer II. Stellate cells were identified by location in superficial layer II, where other cell types are rare or nonexistent (Klink and Alonso 1997; Wang and Lambert 2003); the presence of a round soma and multiple thick primary dendrites (Klink and Alonso 1997); and delayed repolarizing responses (“sags”) to negative current steps (Alonso and Klink 1993; Klink and Alonso 1997). During the process of isolating sodium currents, stellate cells were identified by the activation of an inward current in response to a depolarizing voltage ramp or step (Magistretti and Alonso 1999). In all cases in which cells were filled for anatomical reconstructions (see following text), cells selected using these criteria were confirmed to be stellate cells.
Patch-clamp recordings were made with 4- to 6-MΩ borosilicate electrodes prepared with the Sutter P-97 puller (Sutter Instruments, Novato, CA). Series resistance and cell capacitance were measured in voltage clamp after canceling the whole cell capacitive transients evoked by 10-mV steps. These quantities were typically 10–30 MΩ and 80–120 pF, respectively. The effects of both on voltage-clamp fidelity were compensated by 60%. Capacitance neutralization was set to 6 pF. Acceptable cells were those with a resting potential less than −70 mV in current-clamp experiments, a resistance >300 MΩ in voltage-clamp experiments measuring persistent sodium currents, and a resistance >200 MΩ in h-current experiments. Prior to breaking into the cell, patch resistance was always >2 GΩ, indicating a tight seal between pipette and membrane.
Physiological responses were recorded on computer via the MultiClamp 700A amplifier (Axon Instruments, Union City, CA). Adjustments of the voltage- and current-clamp settings, including holding signals, were performed with the MultiClamp software provided with the amplifier. The feedback resistors on the headstage for voltage and current clamps were 500 MΩ and 5 GΩ, respectively. Stimulus presentation and data acquisition were performed with custom software written in Matlab (The MathWorks, Natick, MA). Physiological signals were filtered at 800 Hz with a Bessel filter and sampled at 2 kHz. The general holding potential in voltage clamp was −40 mV for h-current recordings and −50 mV for persistent sodium recordings, after adjustment for junction potentials (see following text).
Recording solutions
The extracellular solution (ACSF) for slicing, current-clamp recording, and staining was (in mM): 126 NaCl, 1.25 NaH2PO4, 2 MgCl2, 26 NaHCO3, 2 CaCl2, and 25 d-glucose. The intracellular (patch pipette) solution for current-clamp recording and filling was (in mM): 10 KCl, 120 K gluconate, 10 HEPES, 4 Mg-ATP, 0.3 Tris-GTP, and 10 Na2 phosphocreatine plus 20 U·ml−1 creatine kinase. During the process of filling cells, biocytin was added to the pipette at 0.5%.
For the experiments isolating the h current, the extracellular solution was (in mM): 80 NaCl, 26 NAHCO3, 5 KCl, 3 MgCl2, 2 CaCl2, 2 BaCl2, 2 CoCl2, 0.4 CdCl2, 40 tetraethylammonium (TEA) chloride, 4 4-aminopyridine (4-AP), 0.001 tetrodotoxin (TTX), and 10 d-glucose. The intracellular solution was the same as the slicing solution.
For the experiments isolating the persistent sodium current, the extracellular solution was (in mM): 34 NaCl, 26 NAHCO3, 5 KCl, 3 CsCl, 3 MgCl2, 2 CaCl2, 2 BaCl2, 2 CoCl2, 0.4 CdCl2, 80 TEA, 4 4-AP, and 10 d-glucose. The intracellular solution was 10 KCl, 55 K gluconate, 50 Cs methanesulfonate, 10 HEPES, 10 EGTA, 4 Mg-ATP, 0.3 Tris-GTP, and 10 Na2 phosphocreatine plus 20 U·ml−1 creatine kinase.
Additionally, 10 μM bicuculline methiodide and 4 mM kynurenic acid were added to all extracellular solutions to block synapses. The pH was adjusted to 7.4 with HCl and NaOH. Osmolality was adjusted to 300 mOsm with sucrose. Intracellular solutions were adjusted to a pH of 7.3 with HCl and KOH. Osmolality was 290 mOsm. Junction potentials were measured according to the method of Neher (1992). These were 12.1 mV (SD = 5.77 mV, n = 4) for the standard solutions, 14.5 mV (SD = 3.50 mV, n = 6) for the h-current solutions, and 14.7 mV (SD = 2.45 mV, n = 4) for the persistent sodium current solutions. Data were adjusted for these potentials.
Anatomy
Slices (300 μm thick) were prepared as described earlier. Stellate cells were patched with electrodes containing 0.5% biocytin (Molecular Probes, Eugene, OR), filled for 1 h (Horikawa and Armstrong 1988), and fixed in 4% paraformaldehyde overnight. Following fixation, the slice was washed in 0.1 M phosphate-buffered saline (PBS) for 45 min and prepared for either brightfield or epifluorescence microscopy.
For bright-field specimens, cells were stained with diaminobenzidine (DAB). Endogenous peroxidase activity was quenched by exposure to 1% hydrogen peroxide (H2O2) and 10% methanol in PBS for 30 min. Following a further 30 min in fresh PBS, the slice was reacted with avidin-biotinylated horseradish peroxidase (ABC Elite kit; Vector Labs, Peterborough, UK) in 0.75% Triton-X100 (Sigma–Aldrich, St. Louis, MO) PBS for 2 h. The slice was soaked in a solution of 5 μl per ml of DAB in PBS for 30 min and the stain was developed for 2–3 min under a microscope with the addition of 1 μl per ml H2O2. The slice was washed in PBS for a further 45 min and mounted on a slide with Mowiol 4-88 (Polysciences, Warrington, PA) (Longin et al. 1993). Cells were imaged using a MagnaFIRE digital camera (Optronics, Goleta, CA) attached to an Olympus BX51 microscope (Olympus, Melville, NY).
For the fluorescence microscopy, washed slices were incubated for 4 h in a mixture of 0.75% Triton-X100 and 2 μg·ml−1 streptavidin-Alexa Fluor 488 (Molecular Probes). Slices were mounted in Mowiol. Images of filled cells were obtained using a confocal laser scanning microscope (Zeiss LSM 510, Carl Zeiss) with a ×40 objective lens. Laser excitation was at 458 nm (argon) and emitted light was low-pass filtered at 475 nm. Image contrast was adjusted after scanning to suppress background staining.
Analysis
VOLTAGE POWER AND IMPEDANCE SPECTRA.
Power spectra of perithreshold voltages were calculated from traces of cells firing between 0 and 0.1 Hz in current clamp. At these frequencies, long periods of robust subthreshold theta oscillation may be observed between spikes. Traces were divided into overlapping segments of 2-s duration, each shifted by 0.2 s from the previous trace. Ignoring segments within 150 and 300 ms before and after any spikes, a cell's power spectrum was calculated as the mean power spectral density of all its segments (truncated cosine window function; Papoulis 1991). Unless otherwise stated, overall power was determined as the integral of the power spectrum between −25 and 25 Hz, excluding 0 Hz.
Impedance spectra were calculated from the voltage responses of stellate cells to white noise current stimuli at 5 mV above rest. Stimuli were 12.5 s long, but only the last 10 s were analyzed to avoid contamination by the cell's natural (transient) response. Each cell received a different stimulus, white to a frequency of 25 Hz. Stimulus SD ranged from 7 to 40 pA and was adjusted to keep the response within a peak-to-peak range of about 5 mV. As for voltage power, the stimulus and the mean response of a cell to eight presentations of the stimulus were divided into overlapping 2-s segments. A cell's impedance spectrum was calculated as the Fourier transform of the response divided by the Fourier transform of the stimulus, averaged across segments.
ACTIVATION CURVES.
The steady-state h conductance gh(V), as a function of membrane potential, was determined from the tail currents Itail(V, t), recorded following voltage steps to potentials V, from a holding potential of −40 mV, as illustrated in Fig. 5. For each step, we fitted the model
 |
(1) |
with adjustable parameters A and τ describing the amplitudes and time constants of the two components of the tail current. gh(V) is then given by
 |
(2) |
where Vholding is the holding potential. Eh is the effective reversal potential of the h current, calculated using the Goldman–Hodgkin–Katz equation to be −28 mV, assuming a permeability ratio of Na+ to K+ ions of 0.4 (Dickson et al. 2000b). Assuming τ1 < τ2, the quotient β was formed as β(V) = A1(V)/[A1(V) + A2(V)].
The steady-state persistent sodium conductance gNaP(V) was estimated from current responses to either voltage ramps or steps as illustrated in Fig. 6. If I(V) is the residual current recorded in the ramp or step protocols after subtraction of TTX-insensitive currents, gNaP(V) is given by the relation
 |
(3) |
where ENa is the sodium Nernst potential, calculated from intracellular and extracellular concentrations in the persistent sodium recordings to be +29 mV.
The estimates of the conductance (activation) curves, gh(V) and gNaP(V), for the two channels were modeled as Boltzmann functions of the form
 |
(4) |
with three parameters—G, V50, and λ—describing, respectively, the maximum conductance of the channel, the potential of half-maximum activation, and the channel's activation range.
SPINE DENSITY.
Spine densities were calculated from DAB-stained slides, using a grid superimposed over the dendritic field by camera lucida. Grid squares of 40 × 40-μm dimensions were selected at random and the spine density in each was calculated manually as the number of spines present divided by the total dendritic length. Length was measured with a caliper resolution of 8 μm. Squares without dendrites were ignored. When counting spines, long, thin filopodia, thought to represent spine precursors (Fiala et al. 1998), were not included.
STATISTICS.
For each measured parameter, the overall effect of age across the study period was assessed by ANOVA. Additionally, a linear trend analysis was applied to the data from P14 to P18 (Maxwell and Delaney 2004). Values at P28+ were compared with those at both P18 and P14 by t-test. In those cases for which data were available only at P14, P18, and P28+, the linear trend analysis was replaced by a t-test. To control for the family-wise error introduced by performing three comparisons, P values were interpreted with reference to an alpha level of 0.05/3 = 0.0167 (Howell 1997). All F statistics presented in the text refer to the results of an ANOVA. Student's t-statistics refer to either a linear trend analysis or a t-test or a test of a Pearson's correlation coefficient, as appropriate. All quoted measures of spread are SEs.
RESULTS
Physiological development of stellate cells
In current clamp, stellate cells of layer II entorhinal cortex (EC) may be distinguished from nearby nonstellate cells by the production of a delayed repolarization, or “sag,” in response to hyperpolarizing current steps and by early spikes in response to depolarizing steps (Fig. 1, A and B) (Alonso and Klink 1993). Additionally, mature cells exhibit a subthreshold membrane potential oscillation (MPO) in response to constant depolarizing current (Fig. 1, B and C) (Alonso and Klink 1993; Alonso and Llinás 1989). Spikes tend to occur in clusters, loosely phase-locked with the oscillation and limited to one spike per cycle.
FIG. 1.
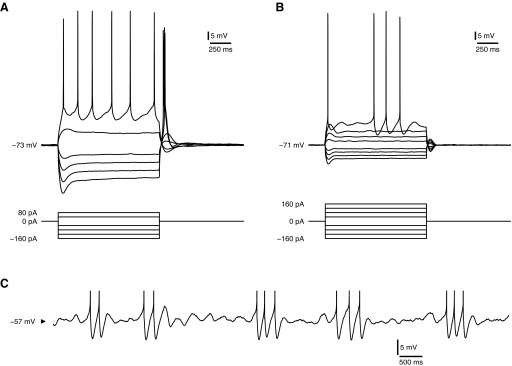
Physiological characteristics of stellate cells. A and B: current-step responses of immature (postnatal day 14 [P14]; A) and mature (P28; B) stellate cells from medial entorhinal cortex, layer II. Steps start at −160 pA and increment by 40 pA until spike threshold is exceeded. Stellate cells were identified on the basis of size, location, and somatodendritic shape (Klink and Alonso 1997). However, even by P14, they were distinguishable within layer II by a repolarizing sag in response to negative current and early spikes in response to positive current. C: responses of a mature stellate cell to constant depolarizing current (200 pA). Same cell as in B. Spikes are clipped for presentation purposes. Mature stellate cells exhibit subthreshold oscillation and clustered spiking.
Perhaps the most striking of these features is the MPO. This is generated intrinsically and is thought to involve the interplay of two currents, a slow rectifying h-current (Ih) and a regenerative “persistent” sodium current (INaP) (Alonso and Llinás 1989; Dickson et al. 2000b; Dorval and White 2005). Although Ih is thought to be a crucial contributor to the resonance necessary to support an oscillation, INaP amplifies the resonant response and provides the channel noise sufficient to trigger and maintain “ringing” oscillations of the resonant system. In our recordings, we typically found MPOs to be in the low theta to subtheta frequency range (∼3 Hz), although spike frequencies within a cluster were slightly higher. This frequency is slightly lower than the in vivo theta rhythm, but is consistent with other patch-clamp recordings from ventral EC (Giocomo et al. 2007). We investigated the development of the oscillation in cells from animals aged between postnatal days 14 (P14) and 18 (P18). The properties of a second group, aged 28 to 32 days (“P28+”), represented the mature condition.
As illustrated in Fig. 2, MPOs were absent at P14 but gradually emerged between P14 and P18. Visual comparison of the P18 and P28+ examples will find that the oscillations at P18 are of a frequency and consistency similar to those in the adult. This observation was repeated throughout the set, although P28+ oscillations were generally of slightly lower amplitude than that at P18. To quantify these changes, we constructed power spectra of the membrane voltage at perithreshold levels of injected DC current, where the cell is spiking but at such a low rate that the “subthreshold” MPOs can be well isolated (methods). At P14, when MPOs were absent, voltage power fell monotonically with frequency over the theta range (Fig. 3A). On P16 (not shown), a shoulder appeared around 3 Hz and this developed into a prominent peak by P18. At older ages, overall power fell, starting at 0.288 mV2 on P18 and ending at 0.126 mV2 by P28+. Nevertheless, the proportion of power in the theta band was maintained at P28+, demonstrating continued theta content. Quantifying the prominence of theta as the proportion of the total power occurring between 2 and 4 Hz, there was a significant effect of age on theta prominence [ANOVA: F(5,26) = 9.25, P < 0.001]. Mean theta prominence increased steadily from 0.240 ± 0.0269 (n = 4) at P14 to 0.544 ± 0.0392 (n = 6) at P18 [trend analysis: t(26) = 5.55, P < 0.001] (Fig. 3D). At P28+, theta prominence was 0.574 ± 0.0435 (n = 4). Theta prominence at P28+ was significantly larger than the value at P14 [Student's t-test: t(26) = 5.28, P < 0.001], but not significantly different from that at P18 [Student's t-test: t(26) = 0.525, P = 0.604]. This pattern was not attributable to systematic shifts in recording potential because spike threshold (where MPOs were recorded) showed no effect of age [F(5,26) = 1.28, P = 0.303].
FIG. 2.

The development of oscillatory behavior in stellate cells. Example traces recorded from stellate cells in response to constant current at 6 different days of development, as indicated. Traces are roughly matched for firing rate. At P14 and P15, action potentials occurred somewhat regularly and had a long afterhyperpolarization (AHP). At P16 and P17 action potentials began to cluster, the AHP shortened, and oscillations appeared between spikes. By P18 an adult physiology was obtained, resembling that at P28+ (P28–P32). Spikes were highly clustered and oscillations were strong.
FIG. 3.
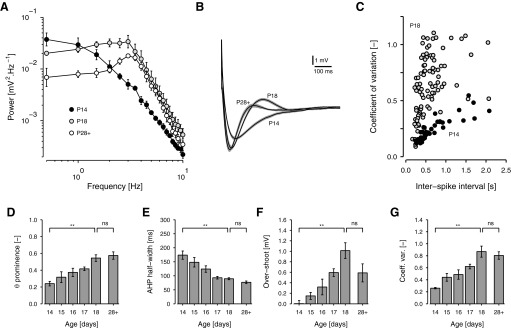
Response statistics of developing stellate cells. A: mean power spectral densities (with SE bars) of membrane potential under perithreshold current in cells at P14, P18, and P28+ (n = 4, 6, 4). From P14 to P18, power at about 3 Hz increased steadily, producing a prominent peak by P18. Beyond P18, overall power fell, although the concentration of power at theta frequencies was maintained. B: mean spike AHPs of cells at P14, P18, and P28+ (n = 4, 7, 8). The perispike waveform of cells firing at <2 Hz was averaged for each cell, ignoring spikes followed immediately by a second spike. From these waveforms, the potential from 700 ms to 1 s after the spike was subtracted and the mean across cells calculated. The gray shadow indicates the SE of this second average. With age, the AHP shortened and deepened and an overshoot developed. C: the coefficient of variation (CV = SD ÷ mean) of the interspike interval (ISI), plotted against ISI for all trials collected from cells at P14 (filled circles, n = 4) and P18 (light gray circles, n = 7). Because of the development of spike clusters, the older cells have a higher CV. D: histogram of theta prominence as a function of age (P14 to P18 and P28+, n = 4, 4, 5, 9, 6, 4), where prominence indicates the proportion of total power contained between 2 and 4 Hz. E and F: histograms of AHP half-width (E) and overshoot amplitude (F) as a function of age (P14 to P18 and P28+, n = 4, 5, 7, 14, 7, 8). Half-width is the width of the AHP at half the minimum potential, measured relative to the potential between 700 ms and 1 s after the spike. Overshoot is the maximum potential. G: histogram of mean coefficient of variation of ISI at spike intervals in the range 0.5 to 1.0 s, as a function of age (P14 to P18 and P28+, n = 4, 5, 7, 12, 7, 8). D–G: here and elsewhere, a bracket above P14 to P18 indicates the significance of either a trend analysis or the difference between the values at P14 and P18, as appropriate (methods). A bracket above P18 and P28+ compares these days separately. NS, not significant; *P < 0.05/3, **P < 0.01/3 (see methods). Error bars are SEs.
Although our main concern here is the development of MPOs, other changes over the study period are also evident in Fig. 2. At P14, the rebound following spike afterhyperpolarization (AHP) was slow, such that voltage rose steadily from one spike to the next and interspike interval (ISI) was fairly constant. Starting at P15, however, the AHP began to shorten in some cells and on P16 and P17 spikes began to cluster as in the mature cell. Because both AHP duration and spike clustering are thought to be influenced by Ih (Fransén et al. 2004; Klink and Alonso 1993; Nolan et al. 2007), we examined these attributes in more detail (Fig. 3, B, C, and E–G). As shown in Fig. 3B, shortening of the AHP was a general feature of our data. Half-width, measured as the width of the AHP at half the minimum voltage relative to background, varied significantly over the study period as a whole [F(5,39) = 15.9, P < 0.001] and fell significantly from 174 ± 14.7 ms (n = 4) at P14 to 89.4 ± 3.50 ms (n = 7) at P18 [t(39) = 7.60, P < 0.001]. Like theta prominence, however, it witnessed no further change from P18 to P28+ [t(39) = 1.06, P = 0.295] (Fig. 3E). Further features of AHP development evident in Fig. 3B are the deepening of the AHP and the development of an overshoot between days P14 and P18. Measuring overshoot as the maximum potential reached above background voltage, overshoot rose significantly from near 0 mV at P14 to 1.01 ± 0.150 mV at P18 [t(39) = 5.48, P < 0.001] (Fig. 3F). Although overshoot fell again by P28+ (0.589 ± 0.172 mV, n = 8), the drop did not quite reach significance after taking account of family-wise error [t(39) = 2.38, P = 0.023; see methods]. Furthermore, overshoot at P28+ was still significantly greater at this age than that at P14 [t(39) = 2.77, P = 0.008]. Amalgamating all ages, both AHP duration and overshoot were highly correlated with theta prominence [Pearson's r > 0.719, t(28) > 5.47, P < 0.001].
To quantify the development of clustering, we calculated the coefficient of variation (CV) in ISI from recordings of stellate cells firing over their full range of firing rates. As shown in Fig. 3C, the CV was consistently higher in P18 animals than that in P14 animals. This was true at all but the lowest ISIs, where all cells were firing regularly. Between 0.5 and 1 Hz, where clustering was most prominent in mature cells, the CV witnessed a significant change over the study period [F(5,37) = 10.0, P < 0.001], increasing significantly from 0.261 ± 0.0114 (n = 4) at P14 to 0.869 ± 0.0926 (n = 7) at P18 [t(37) = 6.02, P < 0.001] (Fig. 3G). At P28+ CV was 0.805 ± 0.0621 (n = 8) and, again, whereas the overall change from P14 to P28+ was significant [t(37) = 5.12, P < 0.001], the change from P18 to P28+ was not [t(37) = 0.718, P = 0.477]. The CV was highly correlated with both theta prominence [r = 0.790, t(27) = 6.70, P < 0.001] and AHP overshoot [r = 0.831, t(39) = 9.33, P < 0.001].
Developmental changes in electrical response
Given that MPOs in stellate cells are thought to be the product of a highly resonant membrane interacting with internal noise sources (Dorval and White 2005; White et al. 1998) one might expect the development of MPOs to be associated with increasing resonance.
To measure resonance, we injected white noise currents into a subset of cells at the key ages—P14, P18, and P28+ (Fig. 4A)—and constructed impedance spectra from the responses (methods). Membrane potential was depolarized to −67 mV (∼5 mV above rest), to bring the potential near the value normally associated with spontaneous MPOs but below the threshold to trigger action potentials. Spectra were fitted with the empirical model of Erchova et al. (2004), which treats the membrane as a low-pass capacitative circuit, representing the passive membrane, in parallel with a high-pass inductive circuit, representing a rectifying conductance. From the fits, descriptive parameters were calculated, including the frequency of maximum impedance (f0) and the Q factor, which is the ratio of the maximum impedance amplitude to its value at the lowest frequency measured (0.5 Hz). We also extracted the cutoff frequency (fcut), which is the frequency at which the passive membrane attenuates impedance power by half and is a conventional measure of membrane speed or bandwidth. (In the time domain, one would use the time constant: τm = 1/2πfcut.)
FIG. 4.
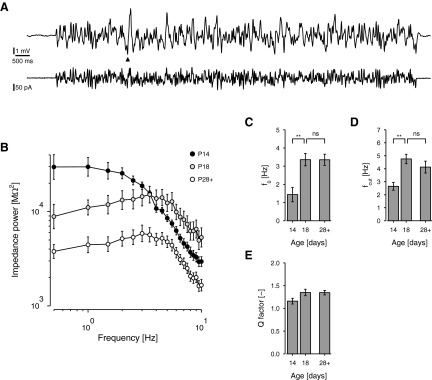
Response to injected current. A: mean response (above) of an example cell from a P29 rat in response to the presentation of a white noise current stimulus (below) at −67 mV. Mean response is an average of 8. To avoid the influence of the cell's transient response on impedance measurements, only the last 10 s, starting from the arrowhead, were used to estimate membrane impedance (methods). B: mean impedance power spectra (square of impedance amplitude) obtained from white noise responses for cells from rats at P14, P18, and P28+, as indicated. P14 cells were mainly low-pass. C–E: impedance parameters (P14, P18, and P28+, n = 8, 7, 10). C: frequency of maximum impedance, f0. D: cutoff frequency, fcut. E: Q-factor (maximum amplitude divided by amplitude at 0.5 Hz).
As illustrated in Fig. 4B, the magnitudes of impedance power spectra fell substantially from P14 to P18 and beyond. There was also a clear change in the mean shapes of spectra, from being largely low-pass at P14 to becoming resonant, with a peak at nonzero frequencies at P18 and P28+. In fact, three of eight P14 cells were completely nonresonant, having a maximum impedance power at 0.5 Hz. Overall f0 changed significantly from 1.44 ± 0.395 Hz (n = 8) at P14 to 3.36 ± 0.340 Hz (n = 7) at P18 and 3.35 ± 0.308 Hz (n = 10) at P28+ [F(2,22) = 9.93, P < 0.001]. The change from P14 to P28+ was significant [t(22) = 3.70, P = 0.001] but the change from P18 to P28+ was not [t(19) = 0.015, P = 0.99] (Fig. 4C). Parallel changes occurred in the cutoff frequency, which rose significantly from 2.65 ± 0.304 Hz at P14 to 4.76 0.363 Hz at P18 and 4.13 ± 0.458 Hz at P28+ [F(2,22) = 6.72, P = 0.005] (Fig. 4D). Again P14 and P28+ were significantly different [t(22) = 2.69, P = 0.013] but P18 and P28+ were not [t(22) = 1.10, P = 0.285]. The Q factor, which measures how strongly the membrane band-pass filters broadband input, followed a similar pattern. This rose from 1.16 ± 0.062 (n = 8) at P14 to 1.35 ± 0.072 (n = 7) at P18 and 1.34 ± 0.049 (n = 10) at P28+, but the overall effect of age fell just short of significance [F(2,22) = 3.23, P = 0.059] (Fig. 4E).
These results indicate two features of stellate cell development. First, the amplitude of the resonance peak increases from P14 to P18, consistent with the hypothesis that the development of MPOs follows the development of resonance. Second, this increase in resonance is achieved despite a decrease in overall cellular input resistance. The falling magnitude of the impedance at low frequencies and the increasing bandwidth indicate that resistance is lower at P28+ than that at P14. Yet, artificially decreasing resistance in stellate cells (P19–P31) has been shown to lower resonance and both MPO amplitude and theta content (Fernandez and White 2008). Thus there must be a strong current contributing to resonance for impedance to become more resonant from P14 to P18.
Based on past work on the subject of resonance and MPOs in mature stellate cells (e.g., Dickson et al. 2000a,b; Dorval and White 2005; Haas and White 2002; Haas et al. 2007; Klink and Alonso 1993; White et al. 1998), there are two obvious candidate membrane currents: Ih, the slow rectifying current thought to set the resonant period, and INaP, the persistent Na+ current that amplifies and adds noise important for MPOs. We first studied Ih in current-clamp data by examining whether the degree of sag changes from P14 to P28+. As shown in Fig. 1A, in response to negative current steps, P14 cells already showed a prominent sag, considered the signature of Ih (Klink and Alonso 1993). For step amplitudes of between −10 and −40 pA, producing responses ending between −80 and −75 mV, steady-state resistance fell continuously from P14 to P28+ [F(5,73) = 13.6, P < 0.001] but the percentage reduction in the voltage response from peak to steady state was quite stable, with a mean of 26% [P14 to P28+: F(5,73) = 2.10, P = 0.075; P14 vs. P28+: t(73) = 0.278, P = 0.782]. That is, developmental changes in resonance near threshold were not matched by effective changes in Ih-generated sag below rest.
Expression of ionic currents
Although the preceding results may suggest that Ih is not a limiting factor in the emergence of resonance and MPOs from P14 to P18, the responses of stellate cells to injected current under normal conditions are influenced by several ionic currents, which may obscure the particular contribution of Ih. To further investigate the mechanisms of MPO development, we studied Ih and INaP in isolation under voltage clamp (see following text). The likely effects of these currents and their relative importance in limiting MPO development are explored through simulation in the supplemental material.1
Expression of Ih
Expression of Ih was investigated using the step protocol of Dickson et al. (2000b), illustrated in Fig. 5, A and B. In the presence of blockers of K+, Ca2+, and Na+ channels, voltage steps of 2-s duration were applied from a holding of −40 mV (Fig. 5A). The tail currents (Fig. 5B) predominantly reflect the slow decay of Ih from its steady-state step value to its value at the holding potential (Dickson et al. 2000b). The amplitude of each tail current was measured by fitting a double-exponential curve to the tail (Eq. 1) and finding the value of the fit shortly after the tail's peak. The corresponding conductance (gh) was calculated by subtracting the current amplitude obtained at the most depolarized step, where Ih is inactive, and adjusting the result for the effective reversal potential of the Ih channel (Eq. 2). Conductance as a function of voltage was then fitted with a Boltzmann model whose parameters Gh, V50 h, and λh describe, respectively, the maximum conductance of Ih (i.e., the conductance when Ih is fully activated), the half-activation potential of Ih, and the range of activation (Fig. 5C) (Eq. 4).
FIG. 5.

Development of the expression of Ih. A and B: voltage-step protocol for isolating the h current, Ih. A: current responses of an example stellate cell (P32) to 2-s voltage steps, applied from a holding of −40 mV, in the presence of Na+, K+, and Ca2+ channel blockers. B: the magnified tail currents of 3 representative cells at P14, P18, and P28+ (same cell as in A). The vertical dashed line indicates the point at which amplitudes are measured. Tail current amplitude reflects the decay of the h conductance from its steady-state step value to its value at the holding potential. C: activation curves of the h-conductance, gh, for the cells in B. The tail current magnitude for the highest voltage step is subtracted from all others and the results are adjusted for electromotive force (emf) to indicate conductance as a function of voltage (discs). The data are then fitted with a Boltzmann curve (model). D and E: histograms of conductance amplitude (D) and density (E) of Ih from P14 to P18 and at P28+ (n = 15, 18, 8, 15, 18, 5). D: the absolute Ih conductance increased throughout the period studied. E: Ih conductance density increased somewhat from P14 to P18 but was intermediate at P28+.
Figure 5, D and E shows respectively the maximum conductance magnitude (Gh) and the corresponding conductance density (or conductance per unit capacitance) of Ih across the period of our study, where capacitance was read from the MultiClamp amplifier (methods). Although the former indicates the absolute expression levels of Ih, the latter is more interesting from a functional point of view because it indicates the effectiveness of Ih to drive the membrane. Both measures showed a general increase with age (see also Fig. 5, B and C). However, the overall effect for conductance density was weak [F(5,73) = 1.74, P = 0.136] because capacitance rose from P18 to P28+ (not shown). Between P14 and P18, conductance density increased from 125 ± 12.0 pS·pF−1 (n = 15) at P14 to 184 ± 19.2 pS·pF−1 (n = 18) at P18, about 47%. The trend was significant [t(73) = 2.73, P = 0.008] but density at P28+ was intermediate at 149 ± 20.3 pS·pF−1 (n = 5) and was not significantly different from either the P14 value [t(73) = 0.717, P = 0.476] or the P18 value [t(73) = 1.08, P = 0.286]. It is therefore not easy to correspond Ih expression with MPO theta content.
In addition to conductance, we analyzed the other parameters of the Boltzmann model of the conductance curve as well as the parameters of the double-exponential model of tail current, including the time constants of the two components τ1 and τ2, and the proportion (β) of current amplitude contributed by the faster (τ1) component. None of these showed a statistical trend across the period of the study. The grand means for these parameters were: half-activation potential, −66.9 ± 0.456 mV; activation range, 6.25 ± 0.119 nS; fast time constant, 56.6 ± 3.57 ms; slow time constant, 284 ± 13.44 ms; and current quotient (β), 0.515 ± 0.0200 (n = 79). β, τ1, and τ2 were averaged across responses to step voltages more negative than −70 mV, where tail currents are robust and we found β to be constant.
In summary, although there is some evidence for developing expression of the h current in the third week after birth, the overall pattern is not consistent with Ih being an important limiting factor in the appearance of MPOs. These results support our earlier finding that the strength of the voltage sag in response to negative current steps was stable from P14 onward and indicate that the poor resonance of P14 cells may be due to factors other than levels of Ih expression. Consistent with this interpretation, our simulations showed that relative changes in the levels of Ih of the order measured here have relatively little effect on the existence of MPOs compared with other factors (such as INaP). Its role appears to be to help set the overall magnitude of the oscillation and, to a modest extent, the oscillation frequency (supplemental material).
Expression of INaP
Expression of INaP was investigated using either the ramp or step protocols of Magistretti and Alonso (1999). Both protocols rely on the sensitivity of INaP to tetrodotoxin (TTX) and its slow rate of inactivation compared with that of the conventional transient sodium current (INaT). In fact, the INaP of stellate cells inactivates in a biexponential manner and, following measurements by Magistretti and Alonso (1999), we chose stimuli that isolate the slower, more “persistent” component.
The ramp protocol is illustrated in Fig. 6A. In the presence of blockers of K+, Ca2+, and h channels, voltage ramps were applied, rising at a speed of 50 mV·s−1 from a holding potential of −95 mV to a maximum of +5 mV. At this ramp speed, INaT and the faster inactivating component of INaP are exhausted but the slower inactivating INaP components are relatively unaffected (Magistretti and Alonso 1999). The step protocol was similar except the stimuli were steps of various amplitudes, each applied from a holding of −80 mV for 800 ms. In both cases, the procedure was repeated in TTX and the difference between the two sets of responses was taken to reflect the amplitude of INaP (Fig. 6B).
FIG. 6.

Development of the expression of INaP. A: voltage-ramp protocol for isolating the persistent sodium current, INaP. Current responses of an example stellate cell (P18) to a 50 mV·s−1 voltage ramp, applied from a holding of −95 mV, before (control) and after (tetrodotoxin [TTX]) the addition of 1 μM TTX to the bath. B: isolated persistent sodium currents as a function of voltage for representative cells at P14, P18 (same cell as in A), and P28+. Currents are calculated by subtracting TTX ramp responses from control ramp responses and mapping time onto voltage according to ramp speed. C: activation curve of the persistent sodium conductance, gNaP, for the cells in B. The current–voltage functions in B are adjusted for emf to indicate gNaP as a function of voltage (black) and the results fitted with a Boltzmann curve (gray). D and E: histograms of conductance amplitude (D) and density (E) of INaP at P14 to P18 and P28+ (n = 11, 12, 21, 11, 18, 12). D: the absolute INaP conductance increased steadily from P14 to P18 and beyond. E: INaP conductance density also increased steadily from P14 to P18, but there was little further change in the mature animal.
The difference curve obtained was adjusted for the sodium Nernst potential (ENa), according to Eq. 3 to obtain an estimate of the persistent sodium conductance gNaP(V), as a function of voltage V. Again, this curve was fitted with a Boltzmann model (Eq. 4) as shown in Fig. 6C, and parameters were extracted, including maximum conductance magnitude, GNaP; the half-activation potential, V50 NaP; and the range of activation, λNaP.
We compared the responses of cells from animals at P14 to P18 and P28+. Neither V50 nor λ showed any statistical effect of age, either between P14 and P18 [V50: t(79) = 0.941, P = 0.350; λ: t(79) = 0.237, P = 0.813] or between P18 and P28+ [V50: t(79) = 1.01, P = 0.317; λ: t(79) = 0.269, P = 0.789]. The grand means for these parameters across all animals were −45.9 ± 0.304 and 3.20 ± 0.103 mV, respectively (n = 85). We therefore focus on the maximum conductance amplitude (GNaP) and corresponding conductance density. Like Gh, GNaP increased from P14 to P18 but additionally rose substantially from P18 to P28+ (Fig. 6, B–D). Consequently, conductance density was maintained at P28+, despite the large membrane area of older cells (Fig. 6E), and the overall effect of age was significant [F(5,79) = 3.75, P = 0.005]. From P14 to P18, conductance density increased by 50% from 36.6 ± 3.76 to 54.9 ± 3.20 pS·pF−1. The effect of age across this period was significant [t(79) = 3.24, P = 0.002] as was the difference between densities at P14 and P28+ [t(79) = 2.90, P = 0.005]. However, there was not a significant difference between densities at P18 and P28+ [t(79) = 0.613, P = 0.542]. This pattern mirrors trends in theta prominence, which reached mature levels by about P18 (Fig. 3).
Thus like Ih, the persistent sodium current INaP was present at P14 and more prominent at P18. Unlike Ih, however, the expression of INaP was well correlated with physiological development whereby densities increased from P14 to P18 and remained high at P28+. These results are consistent with a hypothesis that P14 cells fail to show MPOs because they lack sufficient excitability normally provided in the adult by INaP. Supplemental simulations indicate that changes in INaP density of the order measured here have dramatic effects on the occurrence of MPOs, mainly through their role in amplification but also due to the changes in noise levels they produce (supplemental material). In simulations, the amplification produced by a 50% increase in INaP conductance density (mimicking the change from P14 to P18) was so large that the only way to account for the observed trends in MPO strength in simulations was to include similarly large increases in shunt conductance, consistent with decreases in input resistance and increases in membrane band width we measure from P14 to P18.
Anatomical development of stellate cells
Theta field potentials observed in the EC in vivo (Alonso and García-Austt 1987; Mitchell and Ranck 1980) suggest that the intrinsic rhythmicity of stellate cells may be used either to receive and resonate with theta input from elsewhere or to synchronize cells within layer II at theta frequencies through local interactions. This model supposes that the stellate cell has the appropriate complement of synaptic sites to receive driving input. Both in hippocampal neurons (Harris et al. 1992; Kirov et al. 2004; Pokorný and Yamamoto 1981) and stellate cells in other parts of the rat brain (Ferrer and Martinez-Matos 1981) the period of our study is associated with synaptogenesis. It is therefore of interest to establish the morphological development of EC stellate cells, particularly with regard to synaptic growth.
We examined the anatomy of stellate cells at P14, P18, and P28+ stained with either DAB or streptavidin-Alexa Fluor 488. P14 stellate cells already possessed many of the features of the mature cell (Fig. 7A) (Klink and Alonso 1997; Lingenhöhl and Finch 1991). There were prominent primary dendrites, projecting superficially and basally in a wide fan and extending ≤700 μm parallel to the pial surface, tip to tip. The axon usually projected from a basal dendrite. In three of eight P14 cells the axon was preserved to at least layer VI and axon collaterals could be seen in one or two of layers III–VI. Collaterals were always beaded and could extend medially or laterally. In addition, six P14 cells possessed a fine net of beaded axon collaterals in layer II (Fig. 7A, arrowheads). This net mainly covered a spherical region of radius 50 to 100 μm, centered on the soma, although one to three processes could often be seen extending ≤100 μm beyond the dendritic field in either the medial or lateral direction, often both.
FIG. 7.

Anatomical development of stellate cells. A: stellate morphology. P14 stellate cell filled with Alexa Fluor 488 and displaying typical stellate morphology, including strong primary dendrites extending superficially to the pial surface, dendritic spines, and fine axon collaterals (arrowheads) in the vicinity of the soma. An axon projects from a basal primary dendrite, eventually to send collaterals in layers III and VI (cropped). B and C: spine growth. B: photomicrographs of example DAB-stained cells at P14, P18, and P30, showing an increase in spine density. C: histogram of mean spine density in cells at P14 (n = 3), P18 (n = 3), and P28+ (n = 5).
P14 cells were, however, less complicated than older cells, having fewer dendrites and many fewer spines (Fig. 7B). We quantified the change in spine density in cells stained with DAB. Mean spine density, measured across randomly selected 40 × 40-μm boxes, increased from 71.2 ± 5.53 mm−1 (n = 3) at P14 to 180.0 ± 13.0 mm−1 (n = 3) at P18 and 295.0 ± 33.6 mm−1 (n = 5) at P28+ (Fig. 7C). This trend was significant [F(2,8) = 40.8, P < 0.001, based on a log10 transform], indicating a vigorous synaptogenesis during the period of our study. Thus low network interconnectivity before P28+ may serve as an additional factor that limits expression of the theta rhythm in the juvenile in vivo.
DISCUSSION
Physiological development of entorhinal stellate cells
We have found that the intrinsic rhythmic properties of stellate cells in layer II of the medial entorhinal cortex (EC) first develop in the third week after birth. Between postnatal days 14 (P14) and 18 (P18), subthreshold membrane potential oscillations (MPOs) at theta frequency appear, reaching strengths indistinguishable from those observed in the adult (P28+). At the same time, spikes associate with the peaks of the oscillations; the spike afterhyperpolarization (AHP) deepens, shortens, and develops an overshoot; and spikes occur in clusters on consecutive MPO cycles. These data contribute to our understanding of the events that characterize development in these cells. They also serve a practical purpose. In vitro physiologists, who often seek to use young tissue for its resilience to hypoxia, should be aware that the mature condition may be studied only in EC stellate cells taken from animals at least 3 wk old.
Mechanisms of spontaneous MPO generation
The simultaneous appearance of MPOs, AHP overshoot, and clustering between P14 and P18 is probably not a coincidence because they all reflect a propensity for resonance. MPOs, for example, are generally the product of amplified resonance, whereby a basic resonance supplied by a slow rectifying current is amplified by the positive feedback of a regenerative current (Hutcheon and Yarom 2000). An overshooting (underdamped) response to a perturbation is a property of any resonant system and in EC layer II stellate cells the robust rebound and overshoot of the AHP have been shown to be essential for spike clustering (Fernandez and White 2008; Nolan et al. 2007). We may therefore characterize development between P14 and P18 as being one of increasing resonance.
Direct evidence for this resonance was obtained from our impedance measurements, which showed that P14 cells were less resonant than both P18 and P28+ cells at potentials between rest and spike threshold, some P14 cells showing no resonance at all. The increased resonance with age appears not to be the result of simple changes in passive resistance. In the mature stellate cell, artificially decreasing resistance results in a less resonant response (Fernandez and White 2008), whereas pharmacological block of background conductance amplifies oscillation (Dickson et al. 2000b). We found resistance to fall throughout development, suggesting that resonance was achieved despite membrane shunting. This observation would explain how theta prominence remained constant from P18 to P28+, despite a loss in overall power.
To investigate the cause of resonance, and thus the development of MPOs, we examined the developmental expression of two currents thought to generate MPOs in the adult, the h-current Ih and the persistent sodium current INaP (Alonso and Llinás 1989; Dickson et al. 2000b; although see following text). According to current models, Ih and INaP fulfill respectively the roles of slow rectifier and regenerative current described earlier (Dickson et al. 2000b). Additionally, INaP is a noisy current and is responsible for maintaining oscillation by continually agitating the system (Dorval and White 2005; White et al. 1998). Even at P14, both Ih and INaP were already established in EC stellate cells. This finding is consistent with the role that both these currents play in the hippocampus, such as in immature rhythms (Bender et al. 2005; Sipila et al. 2006; Strata et al. 1997). Nevertheless, both currents underwent changes in expression levels that could have affected MPO development.
Of the two currents, the profile of INaP was the more straightforward. Its conductance density increased by 50% from P14 to P18 and remained elevated at P28+. In a simulation including both Ih and INaP plus a shunt (leak) conductance, changes in INaP density of this order were found to have substantial effects on theta power both through extra noise and particularly amplification. So large was the effect that we found it necessary to substantially increase shunt conductance with age to prevent unbridled oscillation. These results indicate that INaP could be instrumental in the appearance of MPOs during week 3.
The interpretation of Ih development is more difficult. Although the conductance density of Ih increased significantly from P14 to P18, it was intermediate at P28+ and not significantly different from either the P14 or P18 value. It is thus not clear whether Ih expression exerts much influence over physiology beyond P14. If Ih expression were genuinely intermediate at P28+, this might explain why AHP overshoot, which is influenced by Ih (Nolan et al. 2007), fell from P18 to P28+ (albeit nonsignificantly). Nevertheless, AHP overshoot is likely to be determined by a number of factors, including shunt conductance (see Fernandez and White 2008), which increased over the same period. Parsimoniously, we suggest it is best to assume that Ih is not a limiting factor in the development of MPOs during week 3, even if it may temporarily contribute to increasing resonance. This interpretation would be consistent with our measured responses to hyperpolarizing current steps, which showed that effective Ih-induced sag strength was constant throughout the study period. In the hippocampus, too, Ih expression undergoes only modest change in week 3 and even peaks before P14 (Bender et al. 2001, 2005; Vasilyev and Barish 2002). Furthermore, in adult EC stellate cells, large reductions in Ih levels of ≥65% are necessary for MPOs to be abolished (Dickson et al. 2000b; Klink and Alonso 1993). The range of values we report is thus smaller than would normally be expected to affect the MPO. This conclusion is supported by our simulations in which the relative changes in Ih density we measured in vitro had only modest effects on the existence of MPOs.
According to the preceding line of argument, we may present a model for MPO development in which developing INaP expression is pivotal, whereas Ih is already at levels adequate for mature oscillation at P14. This does not mean, however, that other currents are unimportant. Nolan et al. (2007) recently reported that knock out of the HCN1 channel protein, which carries the majority of Ih in stellate cells, does not affect theta-range voltage fluctuations. This result is difficult to interpret because the authors did not measure the concentration of power at theta relative to other frequencies and because the data shown by Nolan et al. (2007) suggest to us that MPOs are less prominent in mice than in rats. Nevertheless, since the work of Dickson et al. (2000b) implicating Ih in MPO generation, it has been shown that the drug they applied to block Ih, ZD7288, also blocks T-type Ca2+ currents (Felix et al. 2003; Sánchez-Alonso et al. 2008). Because stellate cells possess these currents (Bruehl and Wadman 1999), it is possible that the abolition of MPOs that Dickson et al. (2000b) reported represents the block of Ih, T-type Ca2+ channels, and Ca2+-dependent K+ channels (also present; Eder et al. 1991). Interestingly, conventional blockers of Ih and Ca2+ channels do not eliminate MPOs when applied on their own (Klink and Alonso 1993); neither do blockers of K+ channels (Dickson et al. 2000b; Yoshida and Alonso 2007). It may thus be profitable in the future to consider the balance of several currents in the generation of MPOs, both in the adult and during development.
Functional consequences of developmental changes
The function of MPOs per se in stellate cells is at present unclear. In vitro, MPOs are sensitive to synaptic conductance and are eliminated in the presence of incoherent synaptic input (Fernandez and White 2008). Nevertheless, as the product of an underlying resonance, MPOs indicate a competence for stellate cells to respond to oscillatory input. In the aroused state, stellate cells receive strong theta drive from the medial septum (Dickson et al. 1994; Mitchell et al. 1982) and most likely the EC deep layers as well (Gloveli et al. 1999). Under such conditions, it is likely that a resonant membrane will allow the stellate cell to tune its activity to theta frequencies. Thus the appearance of electrical resonance and subthreshold MPOs in the theta range between P14 and P18 suggests that, as a whole, the EC layer II is not able to process theta effectively at P14 but becomes so within the following week.
Our anatomical data support this hypothesis. The dendritic spines of stellate cells receive synaptic input from both extrinsic sources and other stellates within layer II (Kumar et al. 2007; Witter 1993). They therefore supply a means by which the oscillatory properties of stellate cells could not only tune the cell to septal drive but also allow stellates to synchronize directly through reciprocal interactions (Alonso and Llinás 1989; Llinás 1988). At P14, dendrites were relatively free of spines, suggesting a limited capacity to receive input of any kind. By P18, however, spine density had more than doubled and by P28+ it had quadrupled. This pattern is very similar to that seen in the hippocampus CA1, where spines first appear around P11–P12 and witness a two- to fourfold increase from P15 to adulthood (Fiala et al. 1998; Harris et al. 1992). The exact age at which a full adult complement of spines is achieved is not clear because we did not study cells between P18 and P28+; thus we cannot rule out the possibility that new spines continue to develop right up to P28 or beyond. Nevertheless, almost adult spine densities and homeostasis are attained by P22 in hippocampus CA1 (Kirov et al. 2004). It is thus quite possible that both intrinsic and network sources of oscillation appear simultaneously in the EC and reach near completion by around the end of week 3.
More generally, the changes we observe fit into a trend in which immature patterns of activity involved with the formation of functional circuits give way to integrative functions in the third week after birth, contemporaneously with rapid synaptogenesis (Ben-Ari 2001; Dumas 2005). For the hippocampal formation, mature functions notably include spatial memory (O'Keefe and Nadel 1978). Several studies indicate that the theta rhythm is essential for proper memory function in the hippocampal formation, at both the synaptic and the behavioral levels (Huerta and Lisman 1993; Hyman et al. 2003; Mitchell et al. 1982). Our finding that EC layer II stellate cells develop mature MPOs between P14 and P18 may thus help to explain why many spatial memory functions are poorly developed or absent until the end of week 3 (Carew and Rudy 1991; Carman and Mactutus 2001; Green and Stanton 1987; Raunch and Raskin 1984; Rudy 1993; Rudy et al. 1987). However, perhaps the most striking feature of the EC in particular—and thus the feature of most relevance to our study—is the EC representation of space. “Grid cells” of the superficial layers of the medial EC, which presumably include stellate cells, display activity that is modulated according to the position of the rat on an abstract lattice across the laboratory floor (Hafting et al. 2005). Different cells define different grids of different orientations and phases and a gradient in grid spacing exists from narrow in the most dorsal EC to wide in the more ventral EC (Hafting et al. 2005). Presently we do not know how the grid cell representation is formed, although current theories implicate the theta rhythm (Blair et al. 2007; Burgess et al. 2007; O'Keefe and Burgess 2005). In one recent study, it was reported that stellate cells along the dorsoventral extent of EC exhibit a gradient in the frequency of theta MPOs that, when applied to the Burgess model, produced grid spacings as observed in vivo (Giocomo et al. 2007). This correspondence strongly supports the notion that the theta resonance of entorhinal stellate cells is important for spatial coding. If so, then we would predict that grid cells appear in the rat no earlier than about P18.
GRANTS
This work was supported by the National Institutes of Health.
Acknowledgments
We thank T. Blute for training on the confocal microscope and J. Magistretti for advice on recording solutions and techniques.
Present address of J. White: Department of Bioengineering, University of Utah, 20 S. 2030 E., Salt Lake City, UT 84112.
The costs of publication of this article were defrayed in part by the payment of page charges. The article must therefore be hereby marked “advertisement” in accordance with 18 U.S.C. Section 1734 solely to indicate this fact.
Footnotes
The online version of this article contains supplemental data.
REFERENCES
- Alonso and García-Austt 1987.Alonso A, García-Austt E. Neuronal sources of theta rhythm in the entorhinal cortex of the rat. I. Laminar distribution of theta field potentials. Exp Brain Res 67: 493–501, 1987. [DOI] [PubMed] [Google Scholar]
- Alonso and Klink 1993.Alonso A, Klink R. Differential electroresponsiveness of stellate and pyramidal-like cells of medial entorhinal cortex layer II. J Neurophysiol 70: 128–143, 1993. [DOI] [PubMed] [Google Scholar]
- Alonso and Llinás 1989.Alonso A, Llinás RR. Subthreshold Na+-dependent theta-like rhythmicity in stellate cells of entorhinal cortex layer II. Nature 342: 175–177, 1989. [DOI] [PubMed] [Google Scholar]
- Ben-Ari 2001.Ben-Ari Y Developing networks play a similar melody. Trends Neurosci 24: 353–359, 2001. [DOI] [PubMed] [Google Scholar]
- Bender et al. 2001.Bender RA, Brewster A, Santoro B, Ludwig F, Biel M, Baram TZ. Differential and age-dependent expression of hyperpolarization-activated, cyclic nucleotide-gated cation channel isoforms 1–4 suggests evolving roles in the developing rat hippocampus. Neuroscience 106: 689–698, 2001. [DOI] [PMC free article] [PubMed] [Google Scholar]
- Bender et al. 2005.Bender RA, Galindo R, Mameli M, Gonzalez-Vega R, Valenzuela F, Baram TZ. Synchronized network activity in developing rat hippocampus involves regional hyperpolarization-activated cyclic nucleotide-gated (HCN) channel function. Eur J Neurosci 22: 2669–2674, 2005. [DOI] [PMC free article] [PubMed] [Google Scholar]
- Blair et al. 2007.Blair HT, Welday AC, Zhang K. Scale-invariant memory representations emerge from Moiré interference between grid fields that produce theta oscillations. A computational model. J Neurosci 27: 3211–3229, 2007. [DOI] [PMC free article] [PubMed] [Google Scholar]
- Bland and Oddie 2001.Bland BH, Oddie SD. Theta band oscillation and synchrony in the hippocampal formation and associated structures: the case for its role in sensorimotor integration. Behav Brain Res 127: 119–136, 2001. [DOI] [PubMed] [Google Scholar]
- Bruehl and Wadman 1999.Bruehl C, Wadman WJ. Calcium currents in acutely isolated stellate and pyramidal neurons of rat entorhinal cortex. Brain Res 816: 554–562, 1999. [DOI] [PubMed] [Google Scholar]
- Burgess et al. 2007.Burgess N, Barry C, O'Keefe J. An oscillatory interference model of grid cell firing. Hippocampus 17: 801–812, 2007. [DOI] [PMC free article] [PubMed] [Google Scholar]
- Carew and Rudy 1991.Carew MB, Rudy JW. Multiple functions of context during conditioning: a developmental analysis. Dev Psychobiol 24: 191–209, 1991. [DOI] [PubMed] [Google Scholar]
- Carman and Mactutus 2001.Carman HM, Mactutus CF. Ontogeny of spatial navigation in rats: a role for response requirements? Behav Neurosci 115: 870–879, 2001. [PubMed] [Google Scholar]
- Dickson et al. 2000a.Dickson CT, Magistretti J, Shalinsky MH, Bassam H, Alonso A. Oscillatory activity in entorhinal neurons and circuits. Mechanisms and function. Ann NY Acad Sci 911: 127–150, 2000a. [DOI] [PubMed] [Google Scholar]
- Dickson et al. 2000b.Dickson CT, Magistretti J, Shalinsky MH, Fransén E, Hasselmo ME, Alonso A. Properties and role of Ih in the pacing of subthreshold oscillations in entorhinal cortex layer II neurons. J Neurophysiol 83: 2562–2579, 2000b. [DOI] [PubMed] [Google Scholar]
- Dickson et al. 1994.Dickson CT, Trepel C, Bland BH. Extrinsic modulation of theta field activity in entorhinal cortex of anesthetized rat. Hippocampus 4: 37–51, 1994. [DOI] [PubMed] [Google Scholar]
- Dorval and White 2005.Dorval AD, White JA. Channel noise is essential for perithreshold oscillations in entorhinal stellate neurons. J Neurosci 25: 10025–10028, 2005. [DOI] [PMC free article] [PubMed] [Google Scholar]
- Dumas 2005.Dumas TC Developmental regulation of cognitive abilities: modified composition of a molecular switch turns on associative learning. Prog Neurobiol 76: 189–211, 2005. [DOI] [PubMed] [Google Scholar]
- Eder et al. 1991.Eder C, Ficker E, Gündel J, Heinemann U. Outward currents in rat entorhinal cortex stellate cells studied with conventional and perforated patch recordings. Eur J Neurosci 3: 1271–1280, 1991. [DOI] [PubMed] [Google Scholar]
- Erchova et al. 2004.Erchova I, Kreck G, Heinemann U, Herz AVM. Dynamics of rat entorhinal cortex layer II and III cells: characteristics of membrane potential resonance at rest predict oscillation properties near threshold. J Physiol 560: 89–110, 2004. [DOI] [PMC free article] [PubMed] [Google Scholar]
- Felix et al. 2003.Felix R, Sandoval A, Sánchez D, Cómora JC, De la Vega-Beltrán JL, Treviño CL, Darszon A. ZD7288 inhibits low-threshold Ca2+ channel activity and regulates sperm function. Biochem Biophys Res Commun 311: 187–192, 2003. [DOI] [PubMed] [Google Scholar]
- Fernandez and White 2008.Fernandez FR, White JA. Artificial synaptic conductances reduce subthreshold oscillations and periodic firing in stellate cells of the entorhinal cortex. J Neurosci 28: 3790–3803, 2008. [DOI] [PMC free article] [PubMed] [Google Scholar]
- Ferrer and Martinez-Matos 1981.Ferrer I, Martinez-Matos JA. Development of non-pyramidal neurons in the rat sensory-motor cortex during the fetal and early postnatal periods. J Hirnforsch 22: 555–562, 1981. [PubMed] [Google Scholar]
- Fiala et al. 1998.Fiala JC, Feinberg M, Popov V, Harris KM. Synaptogenesis via dendritic filopodia in developing hippocampal area CA1. J Neurosci 18: 8900–8911, 1998. [DOI] [PMC free article] [PubMed] [Google Scholar]
- Fransén et al. 2004.Fransén E, Alonso AA, Dickson CT, Magistretti J, Hasselmo ME. Ionic mechanisms in the generation of subthreshold oscillations and action potential clustering in entorhinal layer II stellate neurons. Hippocampus 14: 368–384, 2004. [DOI] [PubMed] [Google Scholar]
- Giocomo et al. 2007.Giocomo LM, Zilli EA, Fransén E, Hasselmo ME. Temporal frequency of subthreshold oscillations scales with entorhinal grid cell field spacing. Science 315: 1719–1722, 2007. [DOI] [PMC free article] [PubMed] [Google Scholar]
- Gloveli et al. 1999.Gloveli T, Egorov AV, Schmitz D, Heinemann U, Müller W. Carbachol-induced changes in excitability and [Ca2+]i signaling in projection cells of medial entorhinal cortex layers II and III. Eur J Neurosci 11: 3626–3636, 1999. [DOI] [PubMed] [Google Scholar]
- Green and Stanton 1987.Green RJ, Stanton ME. Differential ontogeny of working memory and reference memory in the rat. Behav Neurosci 103: 98–105, 1987. [DOI] [PubMed] [Google Scholar]
- Haas et al. 2007.Haas JS, Dorval AD, White JA. Contributions of Ih to feature selectivity in layer II stellate cells of the entorhinal cortex. J Comput Neurosci 22: 161–171, 2007. [DOI] [PubMed] [Google Scholar]
- Haas and White 2002.Haas JS, White JA. Frequency selectivity of layer II stellate cells in the medial entorhinal cortex. J Neurophysiol 88: 2422–2429, 2002. [DOI] [PubMed] [Google Scholar]
- Hafting et al. 2005.Hafting T, Fyhn M, Molden S, Moser M, Moser EI. Microstructure of a spatial map in the entorhinal cortex. Nature 436: 801–806, 2005. [DOI] [PubMed] [Google Scholar]
- Harris et al. 1992.Harris KM, Jensen FE, Tsao B. Three dimensional structure of dendritic spines and synapses in rat hippocampus (CA1) at postnatal day 15 and adult ages: implications for the maturation of synaptic physiology and long-term potentiation. J Neurosci 12: 2685–2705, 1992. [DOI] [PMC free article] [PubMed] [Google Scholar]
- Horikawa and Armstrong 1988.Horikawa K, Armstrong WE. A versatile means of intracellular labeling: injection of biocytin and its detection with avidin conjugates. J Neurosci Methods 25: 1–11, 1988. [DOI] [PubMed] [Google Scholar]
- Howell 1997.Howell DC Statistical Methods for Psychology (4th ed.). Belmont, CA: Duxbury Press, 1997.
- Huerta and Lisman 1993.Huerta PT, Lisman JE. Heightened synaptic plasticity of hippocampal CA1 neurons during a cholinergically induced rhythmic state. Nature 364: 723–725, 1993. [DOI] [PubMed] [Google Scholar]
- Hutcheon and Yarom 2000.Hutcheon B, Yarom Y. Resonance, oscillation and the intrinsic frequency preferences of neurons. Trends Neurosci 23: 216–222, 2000. [DOI] [PubMed] [Google Scholar]
- Huxter et al. 2003.Huxter J, Burgess N, O'Keefe J. Independent rate and temporal coding in hippocampal pyramidal cells. Nature 425: 828–832, 2003. [DOI] [PMC free article] [PubMed] [Google Scholar]
- Hyman et al. 2003.Hyman JM, Wyble BP, Goyal V, Rossi CA, Hasselmo ME. Stimulation in hippocampal region CA1 in behaving rats yields long-term potentiation when delivered to the peak of theta and long-term depression when delivered to the trough. J Neurosci 23: 11725–11731, 2003. [DOI] [PMC free article] [PubMed] [Google Scholar]
- Jensen and Lisman 2000.Jensen O, Lisman JE. Position reconstruction from an ensemble of hippocampal place cells: contribution of theta phase coding. J Neurophysiol 83: 2602–2609, 2000. [DOI] [PubMed] [Google Scholar]
- Kirov et al. 2004.Kirov SA, Goddard CA, Harris KM. Age-dependence in the homeostatic upregulation of hippocampal dendritic spine number during blocked synaptic transmission. Neuropharmacology 47: 640–648, 2004. [DOI] [PubMed] [Google Scholar]
- Klink and Alonso 1993.Klink R, Alonso A. Ionic mechanisms for the subthreshold oscillations and differential electroresponsiveness of medial entorhinal cortex layer II neurons. J Neurophysiol 70: 144–157, 1993. [DOI] [PubMed] [Google Scholar]
- Klink and Alonso 1997.Klink R, Alonso A. Morphological characteristics of layer II projection neurons in the rat medial entorhinal cortex. Hippocampus 7: 571–583, 1997. [DOI] [PubMed] [Google Scholar]
- Kocsis et al. 1999.Kocsis B, Bragin A, Buzsáki G. Interdependence of multiple theta generators in the hippocampus. A partial coherence analysis. J Neurosci 19: 6200–6212, 1999. [DOI] [PMC free article] [PubMed] [Google Scholar]
- Kramis et al. 1975.Kramis RC, Vanderwolf CH, Bland BH. Two types of hippocampal rhythmical slow activity in both the rabbit and the rat: relations to behavior and effects of atropine, diethyl, ether, urethane and pentobarbital. Exp Neurol 49: 58–85, 1975. [DOI] [PubMed] [Google Scholar]
- Kumar et al. 2007.Kumar SS, Jin X, Buckmaster PS, Huguenard JR. Recurrent circuits in layer II of medial entorhinal cortex in a model of temporal lobe epilepsy. J Neurosci 27: 1239–1246, 2007. [DOI] [PMC free article] [PubMed] [Google Scholar]
- Larson et al. 1986.Larson J, Wong D, Lynch G. Patterned stimulation at the theta frequency is optimal for the induction of hippocampal long-term potentiation. Brain Res 368: 347–350, 1986. [DOI] [PubMed] [Google Scholar]
- Lingenhöhl and Finch 1991.Lingenhöhl K, Finch DM. Morphological characterization of rat entorhinal neurons in vivo soma-dendritic structure and axonal domains. Exp Brain Res 84: 57–74, 1991. [DOI] [PubMed] [Google Scholar]
- Llinás 1988.Llinás RR The intrinsic electrophysiological properties of mammalian neurons. Insights into central nervous system function. Science 242: 1654–1664, 1988. [DOI] [PubMed] [Google Scholar]
- Longin et al. 1993.Longin A, Souchier C, ffrench M, Byron P-A. Comparison of anti-fading agents used in fluorescence microscopy. Image analysis and laser confocal microscopy study. J Histochem Cytochem 41: 1833–1840, 1993. [DOI] [PubMed] [Google Scholar]
- Magistretti and Alonso 1999.Magistretti J, Alonso A. Biophysical properties and slow voltage-dependent inactivation of a sustained sodium current in entorhinal cortex layer-II principal neurons: a whole-cell and single-channel study. J Gen Physiol 114: 491–509, 1999. [DOI] [PMC free article] [PubMed] [Google Scholar]
- Maxwell and Delaney 2004.Maxwell SE, Delaney HD. Designing Experiments and Analyzing Data. A Model Comparison Perspective (2nd ed.). Philadelphia, PA: Erlbaum, 2004.
- Mitchell and Ranck 1980.Mitchell SJ, Ranck JBJ. Generation of theta rhythm in medial entorhinal cortex of freely moving rats. Brain Res 189: 49–66, 1980. [DOI] [PubMed] [Google Scholar]
- Mitchell et al. 1982.Mitchell SJ, Rawlins JNP, Steward O, Olton DS. Medial septal area lesions disrupt theta rhythm and cholinergic staining in medial entorhinal cortex and produce impaired radial arm behavior in rats. J Neurosci 2: 292–302, 1982. [DOI] [PMC free article] [PubMed] [Google Scholar]
- Neher 1992.Neher E Correction for liquid junction potentials in patch clamp experiments. Methods Enzymol 207: 123–131, 1992. [DOI] [PubMed] [Google Scholar]
- Nolan et al. 2007.Nolan MF, Dudman JT, Dodson PD, Santoro B. HCN1 channels control resting and active integrative properties of stellate cells from layer II of the entorhinal cortex. J Neurosci 27: 12440–12451, 2007. [DOI] [PMC free article] [PubMed] [Google Scholar]
- O'Keefe and Burgess 2005.O'Keefe J, Burgess N. Dual phase and rate coding in hippocampal place cells. Theoretical significance and relationship to entorhinal grid cells. Hippocampus 15: 853–866, 2005. [DOI] [PMC free article] [PubMed] [Google Scholar]
- O'Keefe and Recce 1993.O'Keefe J, Recce ML. Phase relationship between hippocampal place units and the EEG theta rhythm. Hippocampus 3: 317–330, 1993. [DOI] [PubMed] [Google Scholar]
- O'Keefe and Nadel 1978.O'Keefe JA, Nadel L. The Hippocampus as a Cognitive Map. Oxford, UK: Oxford Univ. Press, 1978.
- Orr et al. 2001.Orr G, Rao G, Houston FP, McNaughton BL, Barnes CA. Hippocampal synaptic plasticity is modulated by theta rhythm in the fascia dentata of adult and aged freely behaving rats. Hippocampus 11: 647–654, 2001. [DOI] [PubMed] [Google Scholar]
- Papoulis 1991.Papoulis A Probability, Random Variables and Stochastic Processes (3rd ed.). New York: McGraw-Hill, 1991.
- Pokorný and Yamamoto 1981.Pokorný J, Yamamoto T. Postnatal ontogenesis of hippocampal CA1 area in rats. II. Development of ultrastructure in stratum lacunosum and moleculare. Brain Res Bull 7: 121–130, 1981. [DOI] [PubMed] [Google Scholar]
- Raunch and Raskin 1984.Raunch SL, Raskin LA. Cholinergic mediation of spatial memory in the preweanling rat: application of the radial arm maze paradigm. Behav Neurosci 98: 35–43, 1984. [DOI] [PubMed] [Google Scholar]
- Rudy 1993.Rudy JW Contextual conditioning and auditory cue conditioning dissociate during development. Behav Neurosci 107: 887–891, 1993. [DOI] [PubMed] [Google Scholar]
- Rudy et al. 1987.Rudy JW, Stadler-Morris S, Albert P. Ontogeny of spatial navigation behaviors in the rat: dissociation of “proximal” and “distal” cue-based behaviors. Behav Neurosci 101: 62–73, 1987. [DOI] [PubMed] [Google Scholar]
- Sainsbury 1998.Sainsbury RS Hippocampal theta: a sensory-inhibition theory of function. Neurosci Biobehav Rev 22: 237–241, 1998. [DOI] [PubMed] [Google Scholar]
- Sánchez-Alonso et al. 2008.Sánchez-Alonso JL, Halliwell JV, Colino A. ZD7288 inhibits T-type calcium current in rat hippocampal pyramidal cells. Neurosci Lett 439: 275–280, 2008. [DOI] [PubMed] [Google Scholar]
- Sargolini et al. 2006.Sargolini F, Fyhn M, Hafting T, McNaughton BL, Witter MP, Moser M, Moser EI. Conjunctive representation of position, direction and velocity in entorhinal cortex. Science 312: 758–762, 2006. [DOI] [PubMed] [Google Scholar]
- Seidenbecher et al. 2003.Seidenbecher T, Laxmi TR, Stork O, Pape HC. Amygdalar and hippocampal theta rhythm synchronization during fear memory retrieval. Science 301: 846–850, 2003. [DOI] [PubMed] [Google Scholar]
- Siapas et al. 2005.Siapas AG, Lubenov EV, Wilson MA. Prefrontal phase locking to hippocampal theta oscillations. Neuron 46: 141–151, 2005. [DOI] [PubMed] [Google Scholar]
- Sipila et al. 2006.Sipila ST, Huttu K, Voipio J, Kaila K. Intrinsic bursting of immature CA3 pyramidal neurons and consequent giant depolarizing potentials are driven by a persistent Na+ current and terminated by a slow Ca2+-activated K+ current. Eur J Neurosci 23: 2330–2338, 2006. [DOI] [PubMed] [Google Scholar]
- Steward and Scoville 1976.Steward O, Scoville SA. Cells of origin of entorhinal cortical afferents to the hippocampus and fascia dentata of the rat. J Comp Neurol 169: 347–370, 1976. [DOI] [PubMed] [Google Scholar]
- Strata et al. 1997.Strata F, Atzori M, Molnar M, Ugolini G, Tempia F, Cherubini E. A pacemaker current in dye-coupled hilar interneurons contributes to the generation of giant GABA-ergic potentials in developing hippocampus. J Neurosci 17: 1435–1446, 1997. [DOI] [PMC free article] [PubMed] [Google Scholar]
- Vanderwolf 1969.Vanderwolf CH Hippocampal electrical activity and voluntary movement in the rat. Electroencephalogr Clin Neurophysiol 26: 407–418, 1969. [DOI] [PubMed] [Google Scholar]
- Vasilyev and Barish 2002.Vasilyev DV, Barish ME. Postnatal development of the hyperpolarization-activated excitatory current Ih in mouse hippocampal pyramidal neurons. J Neurosci 22: 8992–9004, 2002. [DOI] [PMC free article] [PubMed] [Google Scholar]
- Wang and Lambert 2003.Wang X, Lambert NA. Membrane properties of identified lateral and medial perforant pathway projection neurons. Neuroscience 117: 485–492, 2003. [DOI] [PubMed] [Google Scholar]
- White 1998.White JA, Klink R, Alonso A, Kay AR. Noise from voltage-gated ion channels may influence neuronal dynamics in the entorhinal cortex. J Neurophysiol 80: 262–269, 1998. [DOI] [PubMed] [Google Scholar]
- Winson 1978.Winson J Loss of hippocampal theta rhythm results in spatial memory deficit in the rat. Science 201: 160–163, 1978. [DOI] [PubMed] [Google Scholar]
- Witter 1993.Witter M Organization of the entorhinal-hippocampal system: a review of current anatomical data. Hippocampus 3: 33–44, 1993. [PubMed] [Google Scholar]
- Yoshida and Alonso 2007.Yoshida M, Alonso A. Cell-type-specific modulation of intrinsic firing properties and subthreshold membrane oscillations by the M(Kv7)-current in neurons of the entorhinal cortex. J Neurophysiol 98: 2779–2794, 2007. [DOI] [PubMed] [Google Scholar]