

Abstract
The amygdala and bed nucleus of the stria terminalis (BNST) are thought to subserve distinct functions, with the former mediating rapid fear responses to discrete sensory cues and the latter longer “anxiety-like” states in response to diffuse environmental contingencies. However, these structures are reciprocally connected and their projection sites overlap extensively. To shed light on the significance of BNST–amygdala connections, we compared the antidromic response latencies of BNST and central amygdala (CE) neurons to brain stem stimulation. Whereas the frequency distribution of latencies was unimodal in BNST neurons (∼10-ms mode), that of CE neurons was bimodal (∼10- and ∼30-ms modes). However, after stria terminalis (ST) lesions, only short-latency antidromic responses were observed, suggesting that CE axons with long conduction times course through the ST. Compared with the direct route, the ST greatly lengthens the path of CE axons to the brain stem, an apparently disadvantageous arrangement. Because BNST and CE share major excitatory basolateral amygdala (BL) inputs, lengthening the path of CE axons might allow synchronization of BNST and CE impulses to brain stem when activated by BL. To test this, we applied electrical BL stimuli and compared orthodromic response latencies in CE and BNST neurons. The latency difference between CE and BNST neurons to BL stimuli approximated that seen between the antidromic responses of BNST cells and CE neurons with long conduction times. These results point to a hitherto unsuspected level of temporal coordination between the inputs and outputs of CE and BNST neurons, supporting the idea of shared functions.
INTRODUCTION
Behavioral findings indicate that the central nucleus of the amygdala (CE) and bed nuclei of the stria terminalis (BNST) subserve different functions. In particular, lesion (Campeau and Davis 1995; Hitchcock and Davis 1987 1991; LeDoux et al., 1988) and local drug infusion studies (Kim et al. 1993; Wilensky et al. 2006) have shown that the CE is critically involved in the rapid expression of conditioned fear responses to discrete sensory cues, functions that are left intact by BNST lesions (Gewirtz et al. 1998; LeDoux et al. 1988; Sullivan et al. 2004; Walker and Davis 1997). Instead, BNST lesions interfere with the development of longer “anxiety-like” states in response to more diffuse environmental contingencies, responses that often persist after termination of the threat (reviewed in Walker et al. 2003). For instance, BNST lesions were reported to disrupt corticosterone and freezing responses to contextual stimuli associated with aversive outcomes (Sullivan et al. 2004).
In contrast with these behavioral findings, however, these two structures exhibit similar anatomical properties. For instance, CE and BNST neurons send robust projections to an overlapping set of autonomic and motor brain stem nuclei thought to generate components of fear/anxiety responses (Dong and Swanson 2004, 2006a–c; Dong et al. 2000; Holstege et al. 1985; Hopkins and Holstege 1978; Veening et al. 1984). Moreover, both receive strong glutamatergic inputs from the basolateral amygdala (BL) (Dong et al. 2001; Krettek and Price 1978a,b; Pare et al. 1995; Savender et al. 1995). In fact, these overlapping connections of CE and BNST, coupled to similarities in neuronal morphology and transmitter content (reviewed in McDonald 2003), have led to the proposal that the BNST and CE constitute one anatomical entity termed the extended amygdala (Alheid and Heimer 1988; deOlmos and Heimer 1999).
In further support of this idea, there are strong reciprocal connections between CE and BNST (Dong and Swanson 2006a-c; Dong et al. 2001; Krettek and Price 1978b; Price and Amaral 1981; Sun and Cassell 1993; Veinante and Freund-Mercier 2003). According to these tracing studies, BNST projections to the CE mostly originate in its anterolateral and anteromedial divisions, and the same regions receive the bulk of CE outputs. A puzzling property of amygdalo–BNST connections shown in preceding studies is that there is tremendous heterogeneity in the course taken by these axons to reach their target. Some follow a direct route, through and around the substantia innominata (ventral amygdalofugal pathway). Others follow a circuitous path, via the stria terminalis, that lengthens their trajectory several-fold, raising questions as to the significance of this peculiar anatomical arrangement.
Thus this study aimed to shed light on the functional significance of BNST–amygdala connections using extracellular recordings of BNST and central amygdala (CEA) neurons in rats anesthetized with isoflurane. Our results point to an unexpected level of coordination in the timing of BNST and CE outputs relative to BL inputs.
METHODS
All procedures were approved by the Institutional Animal Care and Use committee of Rutgers State University, in compliance with the Guide for the Care and Use of Laboratory Animals (Department of Health and Human Services). Male Sprague-Dawley rats (225–250 g) were anesthetized with a mixture of ambient air, oxygen, and isoflurane. Atropine (0.05 mg/kg, im) was administered to prevent secretions. The body temperature was maintained at 37–38°C with a heating pad. The level of anesthesia was assessed by continuously monitoring the electroencephalogram and electrocardiogram.
A local anesthetic (bupivacaine, 0.1 ml) was injected subcutaneously in the region of the scalp to be incised. Ten minutes later, the scalp was cut on the midline. The bone overlying the regions of interest was removed, and the dura mater was opened. Under stereotaxic guidance, groups of two or three tungsten stimulating electrodes (intertip spacing of ∼1 mm) were inserted in the BL nucleus of the amygdala (Fig. 1A1), the stria terminalis, and just dorsal to the substantia nigra (Fig. 1A2) where CE and BNST axons en route to the brain stem form a compact bundle (Holstege et al. 1985; Hopkins and Holstege 1978).
FIG. 1.

Histological verification of stimulating and recording sites. Coronal sections stained with cresyl violet. A: arrowheads point to stimulation sites in the basolateral amygdala (BL) nucleus (A1) or dorsal to the substantia nigra (A2). B: arrows point to electrolytic lesions in bed nucleus of the stria terminalis (BNST) (B1) or medial CE (Cem) (B2), where brain stem–projecting neurons were recorded. AC, anterior commissure; BL, basolateral nucleus of the amygdala; CC, corpus callosum; CE, central nucleus of the amygdala; cp, cerebral peduncle; CPu, caudate-putamen; H, habenula; LA, lateral nucleus of the amygdala; LG, lateral geniculate nucleus; rs, rhinal sulcus; Th, thalamus; v, ventricle.
For the placement of stimulating and recording electrodes, the following stereotaxic coordinates were used (all relative to the bregma and in mm). For BL, antero-posterior (AP) –2.3, medio-lateral (ML) 5.0, dorso-ventral (DV) 8.7, and AP –2.8, ML 4.8, DV 8.7. For CE, the coordinates were AP –2.6, ML 4.1, DV, 8.0 and AP –1.8, ML 3.6, DV 7.8. For BNST, the coordinates were AP –0.8. ML 1.7, DV 6–7.5 and –0.2, ML 1.6, DV 6–7.5. For brain stem, three electrodes were inserted at the same AP level (–6.0), three different ML levels 1.6, 2.1, 2.6, and DV positions 7.7, 7.3, 6.9, respectively.
Evoked responses were recorded in CE and BNST with high-impedance (10–12 MΩ) tungsten microelectrodes (FHC, Bowdoin, ME). The positions of the microlectrodes were adjusted independently with micromanipulators. A subset of rats was prepared with electrolytic lesions of the stria terminalis. Such lesions were performed by applying 1 mA for 10 s.
We only considered neurons generating spikes with a high signal to noise ratio (≥3). As the electrodes were lowered toward the structures of interest, electrical stimuli (0.1–0.5 mA, 0.1–0.3 ms) were delivered in the brain stem, in search of antidromically responsive neurons, indicating that they are brain stem–projecting cells. To be classified as antidromic, evoked unit responses had to meet at least two of the following three criteria (Lipski 1981): 1) stable latency (<0.3-ms jitter), 2) collision with orthodromically evoked or spontaneously occurring spikes, and 3) ability to respond faithfully to high-frequency stimuli (300 Hz). Neuronal activity was observed on a digital oscilloscope, digitized at 20 kHz, and stored on disk for off-line analysis.
At the end of experiments, the animals were administered an overdose of sodium pentobarbital (100 mg/kg, ip), and select recording sites in the BNST (Fig. 1B1) and CE (Fig. 1B2) were marked with electrolytic lesions (0.6 mA for 5–10 s). The brains were extracted from the skull, fixed in 2% paraformaldehyde and 1% glutaraldehyde, sectioned on a vibrating microtome (at 100 μm), and stained with cresyl violet to show electrode placements, as shown in Fig. 1. The microelectrode tracks were reconstructed by combining micrometer readings and histology. To be included in the analysis, cells had to be histologically confirmed as being located in the regions of interest. Analyses were performed off-line with commercial software (IGOR, WaveMetrics, Lake Oswego, OR; Matlab, Natick, MA) and custom-designed software running on personal computers. Spikes were detected using a window discriminator after digital filtering of the raw waves. All values are expressed as means ± SE.
RESULTS
Database
A total of 130 CE and 96 BNST neurons that were spontaneously active and/or responsive to electrical stimuli delivered in the BL or brain stem were recorded from 48 intact rats in this study. Histological controls (Fig. 1B2) showed that our sample of CE cells included 102 and 28 neurons recorded in the medial (CEm) and lateral (CEl) parts of the CE, respectively. For BNST cells (Fig. 1B1), most were recorded in the anterolateral region (n = 83), as defined by Ju and Swanson (1989), with the rest in the posterior (n = 13) region.
Consistent with earlier anatomical findings indicating that CEm has more extensive brain stem projections than CEl (Hopkins and Holstege 1978; Petrovich and Swanson 1997; Veening et al. 1984), the incidence of brain stem–projecting cells, as identified by their antidromic responses to brain stem stimuli, was significantly higher in CEm than CEl (Fisher exact test, P < 0.001). Indeed, as many as 76% of CEm cells (or 78 of 102) were antidromically responsive to brain stem stimuli compared with 32% of CEl cells (or 9 of 28). In the BNST, all antidromically responsive neurons to brain stem stimuli (30% or 29 of 96) were located in the anterolateral region. Thus we focused on these anterolateral BNST neurons.
Latency of brain stem–evoked antidromic responses in CE and BNST neurons
Figure 2 shows representative examples of CE (Fig. 2A) and BNST (Fig. 2B) neurons that generated antidromic spikes in response to brain stem stimulation. As shown in the superimpositions of evoked responses (Fig. 2, A1 and B1), antidromic action potentials could easily be distinguished from synaptically evoked spikes because they had a fixed latency. Moreover, antidromic spikes failed when spontaneous action potentials occurred in the collision interval (Fig. 2, A2 and B2, Collision). Another property common the CE and BNST cells was that the transition between the initial segment and somatodendritic components of antidromic spikes was slower than seen in spontaneously occurring action potentials (Fig. 2, A1 and B1, insets), often giving rise to clear break between the initial segment and somatodendritic components of the spikes (Fig. 2, A1 and B1, arrowheads in insets).
FIG. 2.

Physiological identification of brain stem–projecting CE (A) and BNST (B) neurons by antidromic invasion from the brain stem. In A and B, panel 1 shows superimposed antidromic responses to brain stem stimulation, whereas panel 2 shows cases where the antidromic spikes failed because of collision with spontaneous action potentials. The insets in panel 1 show superimpositions of antidromic (black) and spontaneous (red) spikes. Note that the transition between the initial segment and somato-dendritic components of the spikes is longer for antidromic action potentials. Panel 3 shows a frequency distribution of antidromic response latencies evoked from the brain stem in samples of 87 CE and 29 BNST cells.
Consistent with previous findings in rats (Quirk et al. 2003) and rabbits (Pascoe and Kapp 1985), antidromic response latencies to brain stem stimuli were distributed bimodally in CE neurons with an early mode at 9.7 ± 0.7 ms and a late one at 29.4 ± 0.7 ms (Fig. 2A3). Computing the Kolmogorov-Smirnov test for goodness of fit confirmed that the antidromic response latencies of CE neurons were not normally distributed (P < 0.01). In contrast, the frequency distribution of brain stem-evoked antidromic response latencies was unimodal in BNST neurons (average of 10.6 ± 0.8 ms; Fig. 2B3).
As mentioned in the introduction, previous tract-tracing studies have shown that CE axons can reach the brain stem directly, via the ventral amygdalofugal pathway, or through a longer round-about path, the stria terminalis. Thus these findings led us to suspect that the axons of CE cells with longer conduction times to the brain stem might course through the stria terminalis.
To test this idea, 26 rats were prepared with electrolytic lesions of the stria terminalis. Post hoc histological controls showed that in 12 of these cases, the stria was successfully lesioned with minimal damage to adjacent structures (Fig. 3A). An additional sample of CE neurons (n = 42) was recorded in these rats and the distribution of brain stem–evoked antidromic response latencies was compared with that seen in intact rats (Fig. 3B). For the purpose of statistical comparisons, we used a cut-off of 20 ms to define cells with short versus long conduction times. In intact rats (Fig. 3B, solid line), our sample of antidromically responsive CE cells (n = 87) was divided equally between cells with short (47%) versus long (53%) conduction times. In contrast, in rats prepared with lesions of the stria terminalis (Fig. 3B, dashed line), our sample of antidromically responsive CE cells (n = 15) was mostly comprised of cells with short conduction times (80% of cells). Using a Fisher exact test, the differing incidence of CE neurons with short versus long conduction times to the brain stem in intact versus stria terminalis lesioned rats was found to be statistically significant (P = 0.034).
FIG. 3.

CE neurons with long conduction times reach the brain stem via the stria terminalis. A: coronal section showing electrolytic lesion of stria terminalis (arrow). B: frequency distribution of antidromic spike latencies in brain stem–projecting CE neurons. Solid (left y-axis) and dashed (right y-axis) lines, respectively, show data obtained in intact rats vs. rats prepared with an electrolytic lesion of the stria terminalis (87 and 15 CE neurons, respectively). Control data replotted from Fig. 2A3.
Latency of BL-evoked orthodromic responses in CE and BNST neurons
Compared with the ventral amygdalofugal pathway, the stria terminalis lengthens the path of CE axons to the brain stem several-fold, raising questions as to the significance of this apparently disadvantageous arrangement. Because the BNST and CE both receive major excitatory inputs from the BL nucleus, we reasoned that lengthening the axonal path of some CE neurons might allow synchronization of BNST and CE impulses to the brain stem when they are both activated by BL inputs. To test this idea, we applied electrical stimuli in the BL nucleus and compared orthodromic response latencies in CE and BNST neurons.
Figure 4 shows representative examples of BL-evoked orthodromic responses in CE (Fig. 4A1) and BNST (Fig. 4B1) neurons (note different time base) and the corresponding peristimulus histograms of neuronal discharges (Fig. 4, A2 and B2). The incidence of such orthodromic responses to BL stimuli was significantly higher among CE than BNST neurons (CE, 45% or 46 of 102; BNST, 31% or 26 of 83; Fisher exact test, P < 0.02). However, the likelihood of observing BL-evoked orthodromic responses was similar for CE neurons with short versus long conduction times to the brain stem (Fisher exact test, P > 0.15).
FIG. 4.

BL stimulation orthodromically activates CE (A) and BNST (B) neurons. In A and B, panel 1 shows orthodromic responses to BL stimuli, panel 2 shows the corresponding peristimulus histogram of unit discharges, and panel 3 shows the frequency distribution of onset response latencies in samples CE (A3) and BNST (B3) neurons. C: average peristimulus histogram of neuronal discharges for CE (thick line) and BNST neurons (thin line). Before averaging, the data of each cell were normalized by dividing the number of spikes in each bin by the number of stimuli. Note that there was a much larger difference between the timing of the response peaks (16-ms difference) than between response onsets (6 ms).
As shown in the representative examples of Fig. 4, A1 and A2, CE cells generally responded with a pronounced, but brief, period of increased firing probability, lasting 3–6 ms. In contrast, the responses of BNST cells were more distributed in time, lasting 10–17 ms (Fig. 4, B1 and B2; the origin of this difference is considered in the discussion). The contrasting temporal profile of CE and BNST responses to BL stimuli led us to use two different measures to analyze response latencies: response onset versus response peak. The latency to response onset was defined as the average of the first two consecutive 1-ms bins of poststimulus time histograms with counts three times higher than seen in the 10-ms period preceding the BL stimulus. In neurons showing no spontaneous activity during the prestimulus period, the latency to response onset was defined as the average of the first two poststimulus bins with counts.
Consistent with the fact that the distance between the stimulation and recording sites is shorter for CE than BNST neurons, both measures yielded shorter latencies for CE than BNST neurons. Indeed, using 1.5 times the threshold BL stimulation intensity (usually ∼0.3 mA), the average latency to response onset was 7.6 ± 0.4 ms for CE neurons (n = 46; Fig. 4A3) compared with 16.5 ± 0.7 ms for BNST neurons (n = 26; Fig. 4B3). The difference between the latency to response onset of CE and BNST neurons was statistically significant (t-test, P < 0.001). It should be noted that further increases in stimulation intensity did not appreciably reduce the latency to response onset of CE and BNST neurons.
Similarly, as shown in the average peristimulus histograms of Fig. 4C, the latency of the response peak was significantly shorter for CE (8.1 ± 0.4 ms; Fig. 4C, thick line) than BNST neurons (23.6 ± 1.1 ms; Fig. 4C, thin line; t-test, P < 0.001). However, the difference between the two cell groups was much larger with this estimate of response latency. In fact, consistent with our timing hypothesis, the difference in latency to peak was of the same order as that seen between the antidromic responses of BNST cells and CE neurons with long conduction times. In closing, it should be mentioned that separate analyses of the latency to peak of BL-evoked responses in BNST neurons with (n = 8) versus without (n = 15) physiologically identified projections to the brain stem yielded qualitatively identical results (25.1 ± 3.8 and 22.8 ± 2.1 ms latencies, respectively; t-test, P > 0.05).
DISCUSSION
This study was undertaken to shed light on the functional interactions between CE and BNST neurons with a particular emphasis on the relative timing of their outputs to the brain stem. The interest of this question stems from earlier findings suggesting that despite having similar connections and anatomical properties, CE and BNST play different roles in regulating behavior. Our results point to an unexpected level of coordination in the timing of BNST and CE outputs to the brain stem, relative to BL inputs. Below, we consider the significance of these findings in light of previous anatomical and behavioral studies on the role of the extended amygdala.
Path heterogeneity in CE projections to brain stem
Prior tract-tracing studies have shown puzzling variations in the path followed by CE axons to the brain stem (Dong et al. 2001; Krettek and Price 1978b; Price and Amaral 1981; Sun and Cassell 1993; Veinante and Freund-Mercier 2003). Although many CE axons reach the brain stem directly, via the ventral amygdalofugal pathway, others follow the stria terminalis over its entire course. Thus they first course caudally, then arch dorsally and rostrally along the lateral aspect of the thalamus, and later curve ventrally and caudally to merge with axons of the ventral amygdalofugal pathway.
Consistent with this, our analysis of brain stem–evoked antidromic response latencies has shown that CE output neurons fall into two classes, with short or long conduction times to the brain stem. The rarity of CE cells with long antidromic response latencies in rats prepared with lesions of the stria terminalis strongly suggests that the neurons with long conduction times correspond to the subset of CE cells whose axons reaches the brain stem via the stria terminalis. The net consequence of this path heterogeneity is that some CE impulses reach their brain stem targets quickly, in ∼10 ms, whereas others take around three times longer.
What could be the significance of this peculiar arrangement? One possibility is that it serves no special purpose. According to this view, the path heterogeneity would reflect a developmental oddity where some CE cells, subjected to conflicting chemotaxic cues, would be lured into the stria terminalis, whereas others would merge with the ventral amygdalofugal pathway. However, a second possibility, the one we favor, is that this arrangement serves to synchronize CE and BNST outputs to the brain stem when they are activated by BL inputs (Fig. 5). Synchronization of CE and BNST impulses to the brain stem would likely enhance the postsynaptic impact of each input.
FIG. 5.
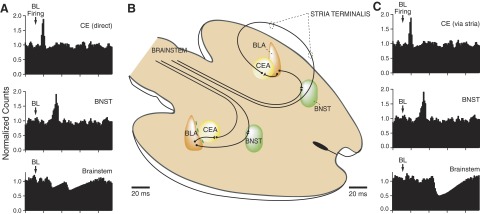
Temporal interactions between BL-evoked activity in CE and BNST neurons and their hypothesized impact on brain stem cells. A and C: artificially generated histograms showing the normalized firing rate (y-axis) of CE (top), BNST (middle), and brain stem (bottom) neurons after BL discharges (arrows). A: impact of CE cells with direct projections to brain stem (as depicted on the left of the scheme in B). C: impact of CE cells with axons reaching the brain stem after coursing through the stria terminalis (as depicted on the right of the scheme in B). The scheme in B shows interconnections between BL, CE, and BNST. For clarity, CE cells with direct projections to brain stem are shown on the left, whereas those with axons coursing in the stria terminalis are shown on the right. As shown in A, CE cells with direct projections to the brain stem inhibit brain stem cells at an earlier latency than BNST cells. As shown in C, the delay introduced by having CE axons reach the brain stem after coursing in the stria terminalis allows temporal summation of the inhibitory effects generated by CE and BNST cells in brain stem neurons.
Consistent with this possibility, we observed that the latency of peak BL-evoked responses was longer in BNST cells, by ∼20 ms, than seen in CE cells. This difference closely approximated the conduction delay introduced by lengthening the path of CE axons to the brain stem via the stria terminalis. Thus by lengthening the path of some CE axons to the brain stem, the arrival of BL-driven CE impulses would be delayed, allowing for synchronization of BNST and CE impulses on their targets. This idea is further supported by a previous anatomical study showing that the same BL neurons that project to CE also contribute axon collaterals to the BNST (Smith and Millhouse 1985).
However, there is a third possible interpretation for our findings. This view assumes that BNST and CE neurons with slow versus fast conduction times to the brain stem do not converge on the same brain stem neurons. Although the tract-tracing data indicates that the brain stem targets of CE and BNST neurons overlap extensively at a macroscopic level (Dong and Swanson 2004, 2006a–c; Dong et al. 2000; Holstege et al. 1985; Hopkins and Holstege 1978; Veening et al. 1984), it remains to be shown, at the single cell level, whether convergence occurs for inputs originating from all three cell groups. For instance, it is conceivable that fast-conducting CE neurons contact brain stem neurons involved in the rapid mediation of short-lived fear responses. In contrast, slow conducting CE neurons and BNST cells might contact brain stem targets that are involved in more persistent fear responses. An important challenge for future studies will be to compare the brain stem projection sites of BNST and CE neurons with slow or fast conduction times to the brain stem.
A puzzling difference between CE and BNST neurons evidenced in this study was that BL stimuli evoked a much longer period of increased firing probability in BNST than CE cells. Although differences in the electroresponsive properties of CE and BNST neurons might have contributed to this effect, it is also possible that BL stimuli engaged contrasting polysynaptic influences. In particular, CE neurons receive a strong GABAergic input from intercalated amygdala neurons (Pare and Smith 1993) that also receive inputs from BL (Royer et al. 1999). The excitation of ITC neurons by BL inputs was previously shown to generate a rapid feed-forward inhibition in CE neurons, limiting the duration of BL-evoked excitatory postsynaptic potentials (EPSPs) (Royer et al. 1999). In addition, BL projects to the medial prefrontal cortex (Krettek and Price 1977) that in turn projects to BNST (Vertes 2004). Thus the excitation of BNST neurons by BL inputs may have been prolonged via the activation of the medial prefrontal cortex.
Behavioral significance of path heterogeneity
Our analyses of BL-evoked response latencies and conduction times to the brain stem argue for a tight temporal coordination between CE and BNST outputs. However, this view does not fit with the lesion and pharmaco-behavioral studies reviewed in the introduction that stress the different functions of CE and BNST. However, it remains that some effects of BNST and CE lesions overlap. For instance, ibotenic acid lesions of BNST (Gray et al. 1993) and CE (Van de Kar et al. 1991) attenuate the increase in corticosterone associated with the expression of contextually conditioned fear. More relevant to the theme of this paper are studies where CE and BNST lesions were reported to attenuate behaviors that are thought to depend on parallel projections of these structures to the brain stem. For instance, it was observed that the expression of contextual conditioned freezing responses is attenuated by both CE and BNST lesions (Goosens and Maren 2001; Gray et al. 1993; Sullivan et al. 2004; Van de Kar et al. 1991). Moreover, CE and anterior BNST lesions prevent the pain-induced increase in vocalization seen following exposure to noxious electrical stimuli (Crown et al. 2000). Both of these effects are thought to depend on parallel projections of CE and BNST to the periaqueductal gray (PAG): the ventral PAG for freezing responses (LeDoux et al. 1988) and the dorsal PAG for the pain-induced increase in vocalization (Crown et al. 2000; McLemore et al. 1999).
Conclusions
Although recent behavioral studies have stressed the differing functions of CE and BNST, others point to overlapping roles of these two structures via their common brain stem projection sites. Consistent with the latter view, our results indicate that the path of BNST and CE axons is such that BL-driven CE and BNST impulses can reach the brain stem simultaneously, maximizing their impact on common targets.
GRANTS
This material is based on work supported by National Institute of Mental Health Grant R01 MH-073610.
Acknowledgments
We thank G. A. Fidacaro for help with the histology.
The costs of publication of this article were defrayed in part by the payment of page charges. The article must therefore be hereby marked “advertisement” in accordance with 18 U.S.C. Section 1734 solely to indicate this fact.
REFERENCES
- Alheid and Heimer 1988.Alheid GF, Heimer L. New perspectives in basal forebrain organization of special relevance for neuropsychiatric disorders: the striatopallidal, amygdaloid, and corticopetal components of substantia innominata. Neuroscience 27: 1–39, 1988. [DOI] [PubMed] [Google Scholar]
- Campeau and Davis 1995.Campeau S, Davis M. Involvement of subcortical and cortical afferents to the lateral nucleus of the amygdala in fear conditioning measured with fear-potentiated startle in rats trained concurrently with auditory and visual conditioned stimuli. J Neurosci 15: 2312–2327, 1995. [DOI] [PMC free article] [PubMed] [Google Scholar]
- Crown et al. 2000.Crown ED, King TE, Meagher MW, Grau JW. Shock-induced hyperalgesia: III. Role of the bed nucleus of the stria terminalis and amygdaloid nuclei. Behav Neurosci 114: 561–573, 2000. [PubMed] [Google Scholar]
- de Olmos and Heimer 1999.de Olmos JS, Heimer L. The concepts of the ventral striatopallidal system and extended amygdala. Ann NY Acad Sci 877: 1–32, 1999. [DOI] [PubMed] [Google Scholar]
- Dong and Petrovich 2000.Dong H, Petrovich GD, Swanson LW. Organization of projections from the juxtacapsular nucleus of the BST: a PHAL study in the rat. Brain Res 859: 1–14, 2000. [DOI] [PubMed] [Google Scholar]
- Dong and Petrovich 2001.Dong HW, Petrovich GD, Swanson LW. Topography of projections from amygdala to bed nuclei of the stria terminalis. Brain Res Brain Res Rev 38: 192–246, 2001. [DOI] [PubMed] [Google Scholar]
- Dong and Swanson 2004.Dong HW, Swanson LW. Organization of axonal projections from the anterolateral area of the bed nuclei of the stria terminalis. J Comp Neurol 468: 277–298, 2004. [DOI] [PubMed] [Google Scholar]
- Dong and Swanson 2006a.Dong HW, Swanson LW. Projections from bed nuclei of the stria terminalis, anteromedial area: cerebral hemisphere integration of neuroendocrine, autonomic, and behavioral aspects of energy balance. J Comp Neurol 494: 142–178, 2006a. [DOI] [PMC free article] [PubMed] [Google Scholar]
- Dong and Swanson 2006b.Dong HW, Swanson LW. Projections from bed nuclei of the stria terminalis, dorsomedial nucleus: implications for cerebral hemisphere integration of neuroendocrine, autonomic, and drinking responses. J Comp Neurol 494: 75–107, 2006b. [DOI] [PMC free article] [PubMed] [Google Scholar]
- Dong and Swanson 2006c.Dong HW, Swanson LW. Projections from bed nuclei of the stria terminalis, magnocellular nucleus: implications for cerebral hemisphere regulation of micturition, defecation, and penile erection. J Comp Neurol 494: 108–141, 2006c. [DOI] [PMC free article] [PubMed] [Google Scholar]
- Gewirtz et al. 1998.Gewirtz JC, McNish KA, Davis M. Lesions of the bed nucleus of the stria terminalis block sensitization of the acoustic startle reflex produced by repeated stress, but not fear-potentiated startle. Prog Neuropsychopharmacol Biol Psychiatry 22: 625–648, 1998. [DOI] [PubMed] [Google Scholar]
- Goosens and Maren 2001.Goosens KA, Maren S. Contextual and auditory fear conditioning are mediated by the lateral, basal, and central amygdaloid nuclei in rats. Learn Mem 8: 148–155, 2001. [DOI] [PMC free article] [PubMed] [Google Scholar]
- Gray et al. 1993.Gray TS, Piechowski RA, Yracheta JM, Rittenhouse PA, Bethea CL, Van de Kar LD. Ibotenic acid lesions in the bed nucleus of the stria terminalis attenuate conditioned stress-induced increases in prolactin, ACTH and corticosterone. Neuroendocrinology 57: 517–524, 1993. [DOI] [PubMed] [Google Scholar]
- Hitchcock and Davis 1991.Hitchcock JM, Davis M. Efferent pathway of the amygdala involved in conditioned fear as measured with the fear-potentiated startle paradigm. Behav Neurosci 105: 826–842, 1991. [DOI] [PubMed] [Google Scholar]
- Hitchcock and Davis 1987.Hitchcock JM, Davis M. Fear-potentiated startle using an auditory conditioned stimulus: effect of lesions of the amygdala. Physiol Behav 39: 403–408, 1987. [DOI] [PubMed] [Google Scholar]
- Holstege et al. 1985.Holstege G, Meiners L, Tan K. Projections of the bed nucleus of the stria terminalis to the mesencephalon, pons, and medulla oblongata in the cat. Exp Brain Res 58: 379–391, 1985. [DOI] [PubMed] [Google Scholar]
- Hopkins and Holstege 1978.Hopkins DA, Holstege G. Amygdaloid projections to the mesencephalon, pons and medulla oblongata in the cat. Exp Brain Res 32: 529–547, 1978. [DOI] [PubMed] [Google Scholar]
- Ju and Swanson 1989.Ju G, Swanson LW. Studies on the cellular architecture of the bed nuclei of the stria terminalis in the rat: I. Cytoarchitecture. J Comp Neurol 280: 587–602, 1989. [DOI] [PubMed] [Google Scholar]
- Kim et al. 1993.Kim M, Campeau S, Falls WA, Davis M. Infusion of the non-NMDA receptor antagonist CNQX into the amygdala blocks the expression of fear-potentiated startle. Behav Neural Biol 59: 5–8, 1993. [DOI] [PubMed] [Google Scholar]
- Krettek and Price 1977.Krettek JE, Price JL. Projections from the amygdaloid complex to the cerebral cortex and thalamus in the rat and cat. J Comp Neurol 172: 687–722, 1977. [DOI] [PubMed] [Google Scholar]
- Krettek and Price 1978a.Krettek JE, Price JL. Amygdaloid projections to subcortical structures within the basal forebrain and brainstem in the rat and cat. J Comp Neurol 178: 225–254, 1978a. [DOI] [PubMed] [Google Scholar]
- Krettek and Price 1978b.Krettek JE, Price JL. A description of the amygdaloid complex in the rat and cat with observations on intra-amygdaloid axonal connections. J Comp Neurol 178: 255–280, 1978b. [DOI] [PubMed] [Google Scholar]
- LeDoux et al. 1988.LeDoux JE, Iwata J, Cicchetti P, Reis DJ. Different projections of the central amygdaloid nucleus mediate autonomic and behavioral correlates of conditioned fear. J Neurosci 8: 2517–2529, 1988. [DOI] [PMC free article] [PubMed] [Google Scholar]
- Lipski 1981.Lipski J Antidromic activation of neurones as an analytic tool in the study of the central nervous system. J Neurosci Methods 4: 1–32, 1981. [DOI] [PubMed] [Google Scholar]
- McDonald 2003.McDonald AJ Is there an amygdala and how far does it extend? An anatomical perspective. Ann NY Acad Sci 985: 1–21, 2003. [DOI] [PubMed] [Google Scholar]
- McLemore et al. 1999.McLemore S, Crown ED, Meagher MW, Grau JW. Shock-induced hyperalgesia: II. Role of the dorsolateral periaqueductal gray. Behav Neurosci 113: 539–549, 1999. [DOI] [PubMed] [Google Scholar]
- Paré and Smith 1993.Paré D, Smith Y. The intercalated cell masses project to the central and medial nuclei of the amygdala in cats. Neuroscience 57: 1077–1090, 1993. [DOI] [PubMed] [Google Scholar]
- Paré et al. 1995.Paré D, Smith Y, Paré JF. Intra-amygdaloid projections of the basolateral and basomedial nuclei in the cat: Phaseolus vulgaris-leucoagglutinin anterograde tracing at the light and electron microscopic level. Neuroscience 69: 567–583, 1995. [DOI] [PubMed] [Google Scholar]
- Pascoe and Kapp 1985.Pascoe JP, Kapp BS. Electrophysiological characteristics of amygdaloid central nucleus neurons in the awake rabbit. Brain Res Bull 14: 331–338, 1985. [DOI] [PubMed] [Google Scholar]
- Petrovich and Swanson 1997.Petrovich GD, Swanson LW. Projections from the lateral part of the central amygdalar nucleus to the postulated fear conditioning circuit. Brain Res 763: 247–254, 1997. [DOI] [PubMed] [Google Scholar]
- Price and Amaral 1981.Price JL, Amaral DG. An autoradiographic study of the projections of the central nucleus of the monkey amygdala. J Neurosci 1: 1242–1259, 1981. [DOI] [PMC free article] [PubMed] [Google Scholar]
- Quirk et al. 2003.Quirk GJ, Likhtik E, Pelletier JG, Pare D. Stimulation of medial prefrontal cortex decreases the responsiveness of central amygdala output neurons. J Neurosci 23: 8800–8807, 2003. [DOI] [PMC free article] [PubMed] [Google Scholar]
- Royer et al. 1999.Royer S, Martina M, Paré D. An inhibitory interface gates impulse traffic between the input and output stations of the amygdala. J Neurosci 19: 10575–10583, 1999. [DOI] [PMC free article] [PubMed] [Google Scholar]
- Savander et al. 1995.Savander V, Go CG, LeDoux JE, Pitkänen A. Intrinsic connections of the rat amygdaloid complex: projections originating in the basal nucleus. J Comp Neurol 361: 345–368, 1995. [DOI] [PubMed] [Google Scholar]
- Smith and Millhouse 1985.Smith BS, Millhouse OE. The connections between the basolateral and central amygdaloid nuclei. Neurosci Lett 56: 307–309, 1985. [DOI] [PubMed] [Google Scholar]
- Sullivan et al. 2004.Sullivan GM, Apergis J, Bush DE, Johnson LR, Hou M, LeDoux JE. Lesions in the bed nucleus of the stria terminalis disrupt corticosterone and freezing responses elicited by a contextual but not by a specific cue-conditioned fear stimulus. Neuroscience 128: 7–14, 2004. [DOI] [PubMed] [Google Scholar]
- Sun and Cassell 1993.Sun N, Cassell MD. Intrinsic GABAergic neurons in the rat central extended amygdala. J Comp Neurol 330: 381–404, 1993. [DOI] [PubMed] [Google Scholar]
- Van de Kar et al. 1991.Van de Kar LD, Piechowski RA, Rittenhouse PA, Gray TS. Amygdaloid lesions: differential effect on conditioned stress and immobilization-induced increases in corticosterone and renin secretion. Neuroendocrinology 54: 89–95, 1991. [DOI] [PubMed] [Google Scholar]
- Veening et al. 1984.Veening JG, Swanson LW, Sawchenko PE. The organization of projections from the central nucleus of the amygdala to brainstem sites involved in central autonomic regulation: A combined retrograde transport-immunohistochemical study. Brain Res 303: 337–357, 1984. [DOI] [PubMed] [Google Scholar]
- Veinante et al. 2003.Veinante P, Freund-Mercier M-J. Branching patterns of central amygdaloid nucleus efferents in the rat: single-axon reconstructions. Ann NY Acad Sci 985: 552–553, 2003. [Google Scholar]
- Vertes 2004.Vertes RP Differential projections of the infralimbic and prelimbic cortex in the rat. Synapse 51: 32–58, 2004. [DOI] [PubMed] [Google Scholar]
- Walker and Davis 1997.Walker DL, Davis M. Double dissociation between the involvement of the bed nucleus of the stria terminalis and the central nucleus of the amygdala in startle increases produced by conditioned versus unconditioned fear. J Neurosci 17: 9375–9383, 1997. [DOI] [PMC free article] [PubMed] [Google Scholar]
- Walker et al. 2003.Walker DL, Toufexis DJ, Davis M. Role of the bed nucleus of the stria terminalis versus the amygdala in fear, stress, and anxiety. Eur J Pharmacol 463: 199–216, 2003. [DOI] [PubMed] [Google Scholar]
- Wilensky et al. 2006.Wilensky AE, Schafe GE, Kristensen MP, LeDoux JE. Rethinking the fear circuit: the central nucleus of the amygdala is required for the acquisition, consolidation, and expression of Pavlovian fear conditioning. J Neurosci 26: 12387–12396, 2006. [DOI] [PMC free article] [PubMed] [Google Scholar]