Abstract
Stereotyped intervals between successive sound pulses characterize the acoustic signals of anurans and other organisms and provide critical information to receivers. One class of midbrain neuron responds selectively when pulses are repeated at slow rates (long intervals). To examine the mechanisms that underlie long-interval selectivity, we made whole cell recordings, in vivo, from neurons in the anuran inferior colliculus (anuran IC). In most cases, long-pass interval selectivity appeared to arise from interplay between excitation and inhibition; in ∼25% of these cases, the delayed inhibition to a pulse overlapped with the excitation to the following pulse at fast pulse repetition rates (PRRs), resulting in a phasic “onset” response. In the remaining cases, inhibition appeared to precede excitation. These neurons did not respond to fast PRRs apparently because delayed excitation to a pulse overlapped with the inhibition to the following pulse. These results suggest that the relative timing of inhibition and excitation govern differences in the response properties of these two cell types. Loading cells with cesium increased their responses to fast AM rates, supporting a role for inhibition in long-interval selectivity. Three cells showed little or no evidence of inhibition and exhibited strong depression of excitation. These findings are discussed in the context of current models for long-pass interval selectivity.
INTRODUCTION
The timing of successive acoustic elements, i.e., intervals, conveys information about particular phoneme pairs in human speech (Diehl and Lindblom 2004; Ehret 1996), call types in animal communication (Gerhardt 1988), syllable identity in birdsong (Margoliash and Fortune 1992), target range in echolocation (Moss and Schnitzler 1995), and rhythm in music (Cooper and Meyer 1960). In the simplest case (repeated sound pulses), an interval is the time from the onset of one sound pulse to that of the next pulse. Intervals of this type are represented in the timing of discharges of auditory-nerve fibers (Capranica and Moffat 1975), which must then be decoded in the brain to permit recognition and selective behavioral responses. The acoustic communication systems of anuran amphibians and crickets (Gerhardt and Huber 2002) and echolocation systems of bats (Casseday et al. 2002) provide the best-studied cases of behaviorally relevant interval information and their neural representations.
The communication signals of many anurans consist of pulses that are repeated at regular intervals. The intervals between successive sound pulses, and therefore pulse repetition rate (PRR), convey information about call type and species identity (Gerhardt 2001; Kruse 1982; Rose and Brenowitz 1997, 2002). The neural representation of this information is transformed from a periodicity code in the periphery to a place code in the midbrain, where individual neurons respond best for particular PRRs (Rose and Capranica 1983, 1984; Rose and Gooler 2007). Two general classes of interval selectivity have been recognized. Neurons in the first class show band- or short-pass selectivity for fast PRRs and require several successive short intervals to elicit a response (“interval-counting neurons”) (Edwards et al. 2002). Whole cell patch recordings in vivo have provided some insight into the mechanisms that underlie interval counting and selectivity (Edwards et al. 2007). Cells of the other class are selective for long intervals, respond to single pulses, and show band- or low-pass selectivity for amplitude-modulated stimuli (Alder and Rose 2000). However, the mechanisms that underlie long-pass interval selectivity are poorly understood.
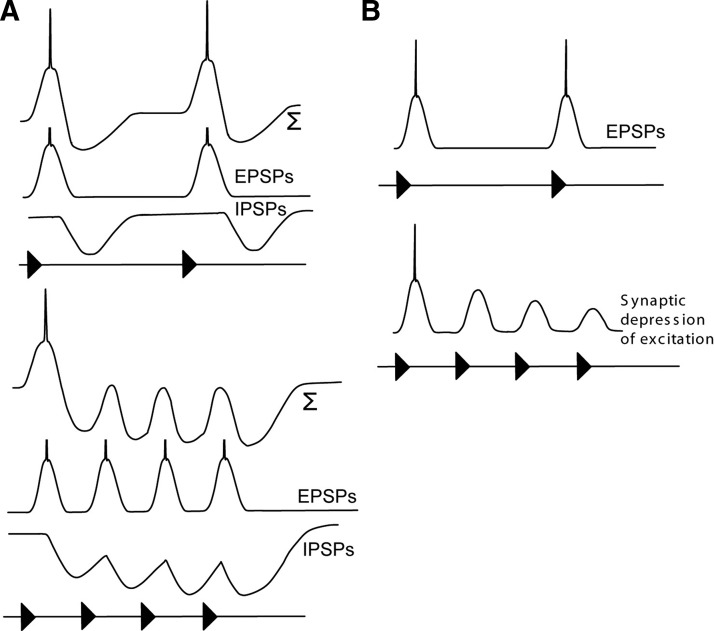
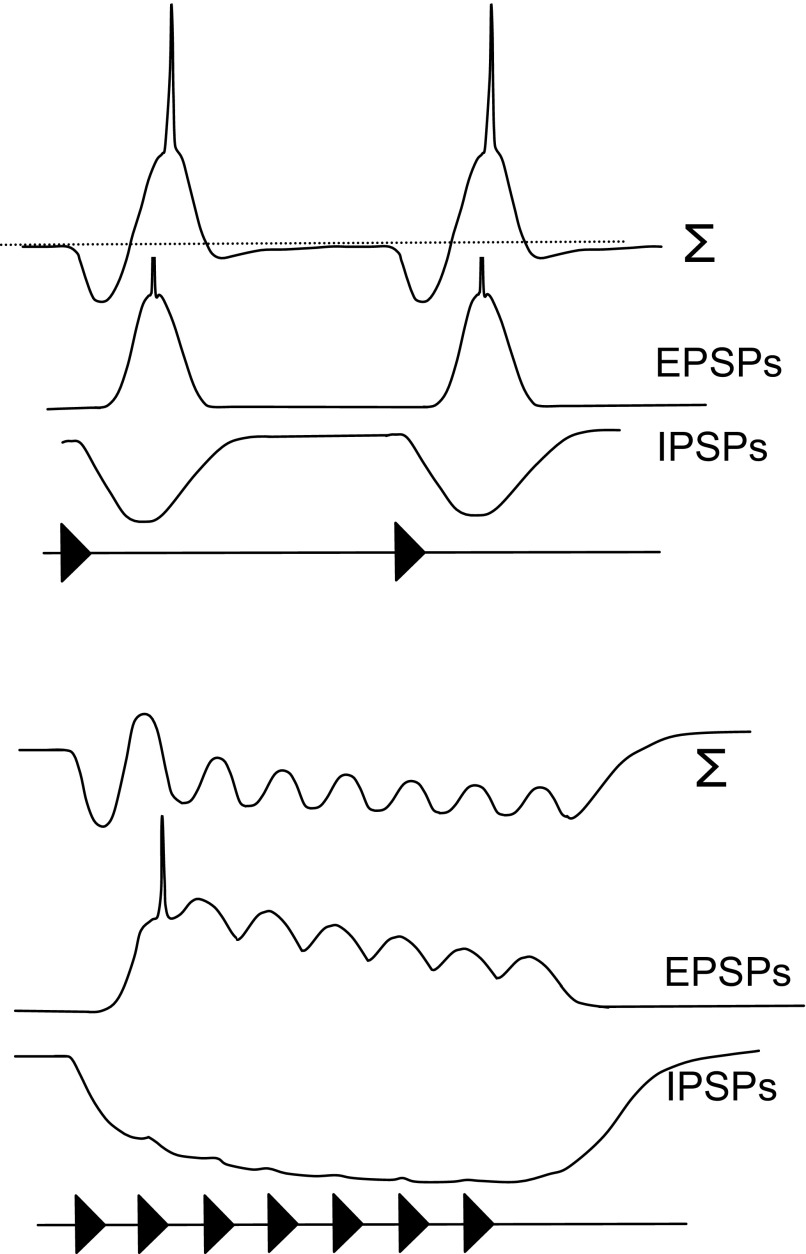
Grothe (1994) postulated that neural selectivity for long intervals might arise from interplay between excitation and delayed inhibition based on extracellular recordings from neurons in the medial superior olive of mustached bats (Fig. 1A). For long intervals, each pulse elicits excitation that triggers one or more spikes. However, as the intervals between successive pulses are shortened, the excitation from each pulse progressively overlaps temporally with the inhibition from the preceding pulse, resulting in a phasic response to the first pulse in the series. Results of pharmacologically blocking inhibition support this model for long-pass neurons in the medial superior olive (Grothe 1994) and dorsal nucleus of the lateral lemniscus (Yang and Pollak 1997) but not in the inferior colliculus (Burger and Pollak 1998). Intracellular response profiles of low-pass PRR-selective neurons in crickets are also consistent with this model (Atkins et al. 1988). Alternatively, intracellular studies of neurons in the midbrain of electric fish demonstrated that selectivity for long intervals (slow beat rates) can arise, in part, from synaptic depression (Fortune and Rose 2000) (Fig. 1B).
FIG. 1.
Two models illustrating how interplay between excitation and inhibition (A) or synaptic depression (B) would generate long-interval selectivity. Models derived from Grothe (1994) and Fortune and Rose (2000). The traces in A labeled with ∑ indicate the expected summation of the excitatory and inhibitory postsynaptic potentials (EPSP and IPSP).
The mechanisms that underlie long-pass interval selectivity have not been fully elucidated for any auditory system. In the present study, we made whole cell patch recordings, in vivo, from neurons in the anuran inferior colliculus (anuran IC or torus semicircularis) to determine the mechanisms that underlie selectivity for long intervals.
METHODS
Recording procedures
Pacific tree frogs (Hyla regilla, n = 9) and northern leopard frogs (Rana pipiens pipiens, n = 12) were prepared for recording following the methods of Alder and Rose (2000). Briefly, frogs were immersed in 3% urethane and a local anesthetic (Lidocaine HCL) was applied topically to the dorsal surface of the skull where a small opening was made to expose the optic tectum. Individuals were allowed to recover overnight from surgery and were subsequently immobilized with d-tubocurarine chloride (2.5 μg/g) for recording. Whole cell patch intracellular recordings were made, in vivo, according to methods described in detail by Rose and Fortune (1996) and Edwards et al. (2007). All procedures were approved by the University of Utah Institutional Animal Care and Use Committee.
Patch pipettes were constructed from borosilicate capillary glass (A-M Systems, Model No. 5960; 1 mm OD, 0.58 mm ID) using a Flaming-Brown type puller (Sutter Instruments, Model No. P-97). These pipettes had outside tip diameters of ∼1–2 μm and had resistances between 15 and 25 MΩ. Electrode tips were back-filled with a solution (pH = 7.4) consisting of (in mM) 100 potassium gluconate, 2 KCl, 1 MgCl2, 5 EGTA, 10 HEPES, 20 KOH, and biocytin at a concentration (43 mM) to bring the final osmolarity to ∼285 mosmol. Biocytin was replaced by mannitol in the solution used to fill pipette shanks. In other experiments, postsynaptic inhibition was attenuated by substituting cesium fluoride (CsF) for potassium gluconate in the recording pipettes (Nelson et al. 1994).
Seal resistances were typically >2 GΩ with access resistances of ≤58 MΩ. Resting potentials of long-interval-selective neurons ranged from −40 to −95 mV (median = −72 mV). Input resistances ranged from 168 MΩ to 1.05 GΩ (median = 388 MΩ).
The pipette was advanced into the brain using an “inch-worm” microdrive (Burleigh, Model No. 6000) while applying positive pressure. After reaching the recording location, the pipette was advanced in 1.5-μm increments while maintaining positive pressure and passing −0.1-nA square-wave pulses (500 ms) to monitor resistance. Cell contact was indicated by a small increase (10%) in the voltage change. Negative pressure was then applied to the pipette to increase the seal resistance to gigaohm levels. Subsequent to seal formation, negative current (approximately −0.5 nA) was applied to rupture the patch and attain an intracellular recording.
Stimulus generation and delivery
Search stimulus carrier frequencies were systematically varied from 300 to 2,200 Hz with modulation frequencies (sinusoidal AM, SAM) ranging from 20 to 120 Hz. Intracellular recordings were made in an audiometric chamber that was maintained at 18°C. The average PRR at this temperature is ∼15 pulse/s for R. pipiens and 90 pulse/s in H. regilla. Acoustic stimuli were generated using Tucker Davis Technologies (TDT) System II hardware and custom software (Alder and Rose 2000). The details regarding how the different pulse shapes were generated (for SAM, natural AM, and variable duty-cycle stimuli) are described in Alder and Rose (2000). Stimuli were presented free field in an audiometric room (Alder and Rose 2000). The speaker was situated 0.5 m from the animal and contralateral to the recording site. The carrier frequency was set to the best excitatory frequency (BEF) for each neuron unless otherwise noted.
Neurophysiological procedures and measurements
To aid in examining the relative contributions of inhibition and excitation to long-interval selectivity, recordings were made while the neuron was depolarized or hyperpolarized, respectively, to near the excitatory or inhibitory reversal potentials (current-clamp recording). Increased conductances in response to stimuli can shunt the excitation or inhibition, thereby obscuring their full amplitude. In some cases, we were able to isolate the relative contribution and time course of inhibition using stimulus carrier frequencies that were offset from the BEF.
To measure the input resistance of the neuron during and between stimulus repetitions, −0.1 nA current pulses were injected at a frequency slow enough to permit ≥95% charging of the membrane. A double-exponential equation was fitted to these voltage changes to dissociate the input resistance from the electrode and access resistances. The resting conductance was measured between stimulus presentations as grest = 1/Rrest and subtracted from the conductance during stimulus presentations (gstim) to obtain the conductance increase that was associated with acoustic stimulation (gacoust = gstim − grest). The excitatory conductance (ge) that was required to elicit a particular level of depolarization was estimated from the equation ge = i/(Ve –Vm), where Ve is the reversal potential of the excitation, assumed to be 0 mV, Vm is the resting potential, and i is the current required to elicit a depolarization of that amplitude; i was calculated by the formula i = V/Rstim, where V is the observed depolarization and Rstim is the input resistance during the stimulus presentation.
The effects of attenuating inhibition with cesium fluoride (CsF) were determined as follows. Cs+ and F− are broad-spectrum potassium and chloride channel blockers, respectively; we used this solution to increase the likelihood that inhibition would be attenuated while recording intracellularly (Nelson et al. 1994). When spikes could be recorded after seal formation, response properties such as BEF, threshold, and best PRR were determined prior to opening the cell. This procedure allowed us to quickly obtain baseline intracellular recordings of responses to critical stimuli once the patch was ruptured. Cesium effects, e.g., broadening of action potentials, depolarization and decrease in inhibitory postsynaptic potential (IPSP) size, could sometimes be observed within 3–5 min of establishing an intracellular recording. In cases where spikes could not be observed extracellularly, the neuron was first physiologically characterized while applying ∼0.01-nA negative holding current to minimize cesium flow into the cell; the delivery of fluoride to the cell during this period did not appear to alter the size of IPSPs. Baseline AM tuning curves were determined while the holding current was delivered and then immediately after it was removed. In cases where Cs+ effects evolved slowly, loading was accelerated by passing ∼0.02-nA positive current for ∼1–5 min. Because cesium loading was accompanied by depolarization of the neuron (Nelson et al. 1994), we recorded responses to sensory stimuli while injecting negative current to hold the cell near its normal resting potential. These recordings were compared with those made shortly after opening the patch. The broadening of AM tuning occurred at a point where a clear cesium action was observed i.e., spikes were broadened and stimulus-driven IPSPs were attenuated.
RESULTS
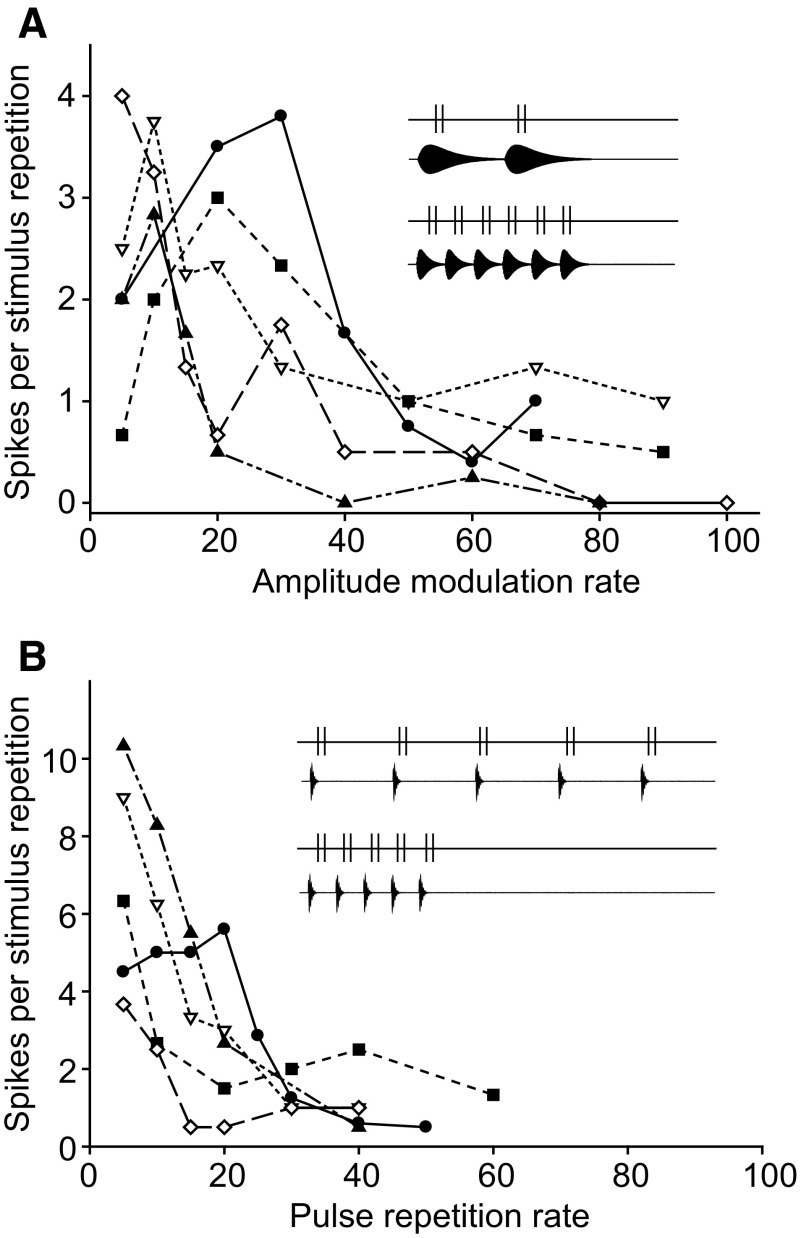
As a first step in evaluating the models shown in Fig. 1, we examined the spike responses of long-interval-selective neurons to AM and pulse-train stimuli (Fig. 2). Data are from five neurons that represent the range of response profiles observed in this study. Consistent with previous work (Alder and Rose 2000), these cells showed either band- or low-pass selectivity for AM rate (Fig. 2A) but were low-pass for stimuli that varied only in PRR (Fig. 2B), i.e., pulse duration, shape, and number were held constant. These results demonstrate that neurons of this type prefer long intervals; the preferential responses to slow AM rates are not attributable to longer duration pulses as is the case for long-pass duration-selective neurons (Leary et al. 2008).
FIG. 2.
Spikes per stimulus repetition vs. AM rate (A) or pulse repetition rate (B) for 5 long-interval units. Insets in A and B: examples of stimuli and the hypothetical responses of a unit that is band-pass to AM rate; because these neurons respond phasically to each pulse, slow AM rate stimuli (A, inset) elicit fewer spikes relative to stimuli with constant pulse number (B, inset).
Long-interval selectivity and relation to models
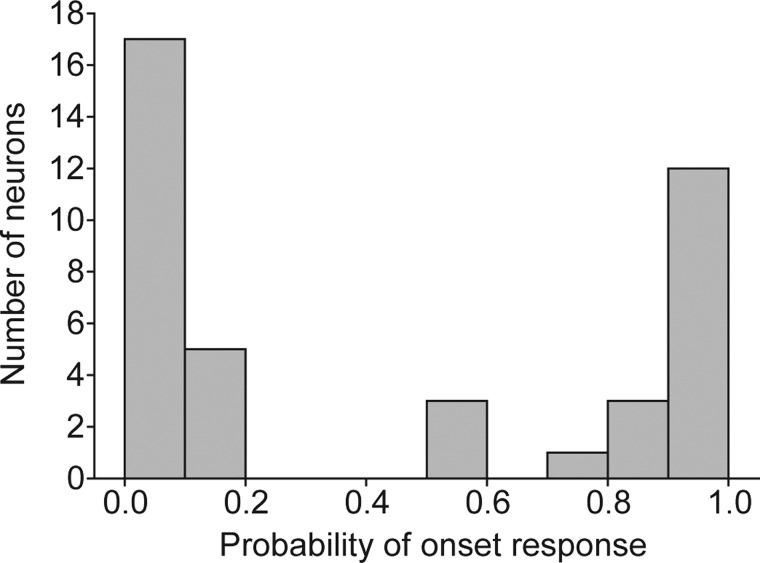
The models shown in Fig. 1 incorporate inhibition that is delayed relative to the excitation or synaptic depression; both models indicate that long-interval-selective neurons should respond phasically to the onset of each presentation of fast AM or PRR stimuli. At AM or PR rates of 40–60 pulse/s, 16 of the 38 long-interval-selective cells responded in this manner, but most (22) responded rarely (probability of ≥1 spikes occurring on each stimulus presentation was <0.2) or not at all (Fig. 3). These results do not rule out the mechanisms depicted in Fig. 1 but suggest that additional processes contribute to the interval selectivity of many midbrain neurons, e.g., those that do not respond to fast AM or PR rates. To gain further insight into the mechanisms that underlie long-interval selectivity, we analyzed in vivo intracellular (whole cell patch method) recordings from these long-interval neurons.
FIG. 3.
Histogram of the probability of firing ≥1 spikes at the onset of a 40- to 60-Hz AM stimulus for 41 long-interval-selective neurons.
Subthreshold correlates to long-interval selectivity characteristics
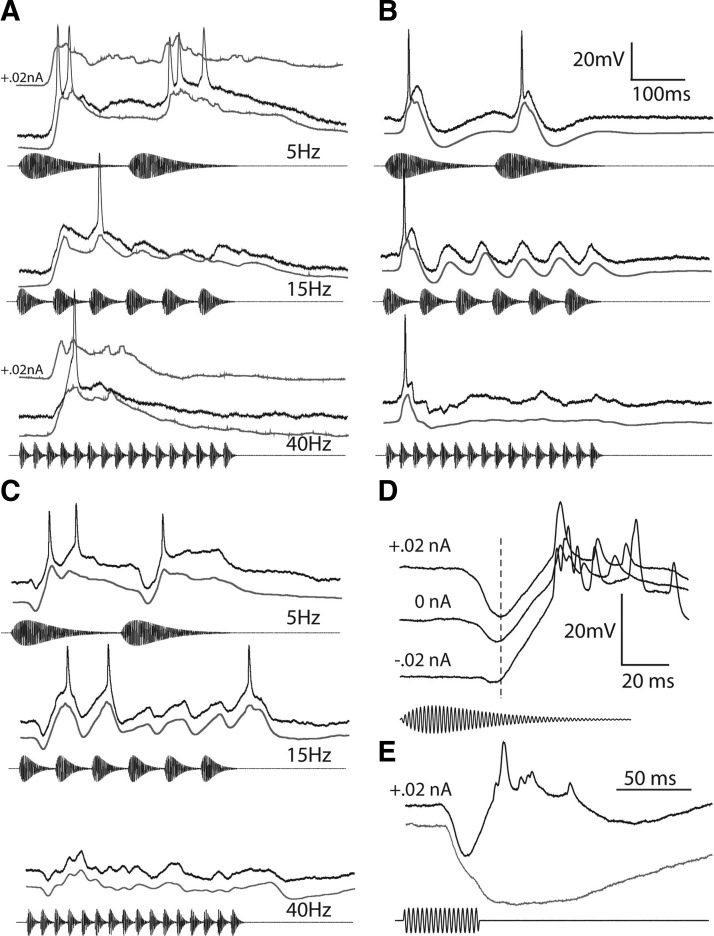
Figure 4 shows recordings from three long-interval neurons that illustrate the range of response profiles that we observed; dark and gray traces are individual and averaged, respectively, responses to 5-, 15-, and 40-Hz AM; to better view the time course of the depolarizations, spikes were removed with a median filter prior to computing averaged records.
FIG. 4.
Intracellular recordings from representative long-interval units. A–C: responses of 3 neurons to 5-Hz AM (top traces), 15-Hz AM (middle traces), and 40-Hz AM (bottom traces). The black traces are responses to single presentations of the stimulus. The gray traces are averages of several repetitions after recording was median filtered with a time constant of 5 ms to remove spikes. The top gray traces in A at 5 and 40 Hz are averaged responses recorded with +0.02-nA current clamp. A: resting potential = −72 mV; best excitatory frequency (BEF) = 300 Hz; 65 dB SPL. B: resting potential = −79 mV; BEF = 600 Hz; 61 dB SPL. C: resting potential = −61 mV; BEF = 300 Hz; 72 dB SPL. D: current-clamp recordings, at the levels shown, of responses of the cell in C to 5-Hz AM stimulus. E: positive current-clamp recordings of responses of the same neuron to tone bursts of 300 Hz (black trace) and 660 Hz (gray trace).
Of the 16 neurons that responded phasically to the onset of AM rates of 40–60 Hz, 3 did not exhibit any stimulus-related hyperpolarizations (Fig. 4A) even during positive current-clamp recording (Fig. 4A, top gray trace at 5- and 40-Hz AM). This representative neuron showed a strong depolarization to each sound pulse at 5-Hz AM, and only an onset response at 15- and 40-Hz AM. The selectivity of these neurons appeared to result from depression of excitation at fast AM rates.
Nine of the 16 neurons that responded phasically at fast AM rates showed an early depolarization that was followed by a hyperpolarization (Fig. 4B). This response pattern occurred for each pulse of a 5-Hz AM stimulus (top). At 40- to 50-Hz AM, this representative cell showed an early depolarization that triggered a spike on 85% of the stimulus presentations (and therefore was excitatory), followed by a hyperpolarization of ∼7 mV.
The remaining four (of 16) phasically responding neurons and all of the cells that responded weakly, or not at all, to fast AM rates (n = 22) showed an early hyperpolarization, followed by a depolarization (Fig. 4C). At slow AM rates, these depolarizations elicited spikes and, therefore were excitatory. In 14 of the 22 cells of this type, some hyperpolarization was also present after the depolarizing phase of the response. As will be shown later, these hyperpolarizations represent inhibition, as opposed to resulting from a decrease in conductance at an excitatory synapse, i.e., one with a reversal potential that is less negative than the resting potential. As the interpulse interval (time between onsets of successive pulses) was decreased, the inhibition from a pulse progressively encroached on the excitation from the preceding pulse; at fast AM rates (short interpulse intervals), overlap was appreciable and no spikes were elicited, even by the first pulse (Fig. 4C). For this cell, the inhibition appeared to precede the excitation by ∼13 ms as can be seen in the positive and negative current-clamp recordings shown in Fig. 4D. Injection of negative current reduced the amplitude of the hyperpolarization, consistent with it being an IPSP. The time course of the inhibition was most evident in responses to 50-ms tone bursts of 660 Hz, which elicited little or no excitation (Fig. 4E).
Although inhibition was evident in all but three of the recorded cells, in some cases, it could only be clearly discerned in positive current-clamp recordings, suggesting that the reversal potential of the inhibition was near the resting potential. Overall these results suggest that interactions between inhibition and excitation are important in generating long-interval selectivity and that depression of excitation (Fig. 1B) also plays a role. These data also suggest that interplay between excitation and inhibition may differ from the model shown in Fig. 1A; inhibition may precede and overlap with excitation at fast PRRs such that few, if any, spikes are generated.
Long-interval selectivity and response profiles are largely independent of AM duty cycle
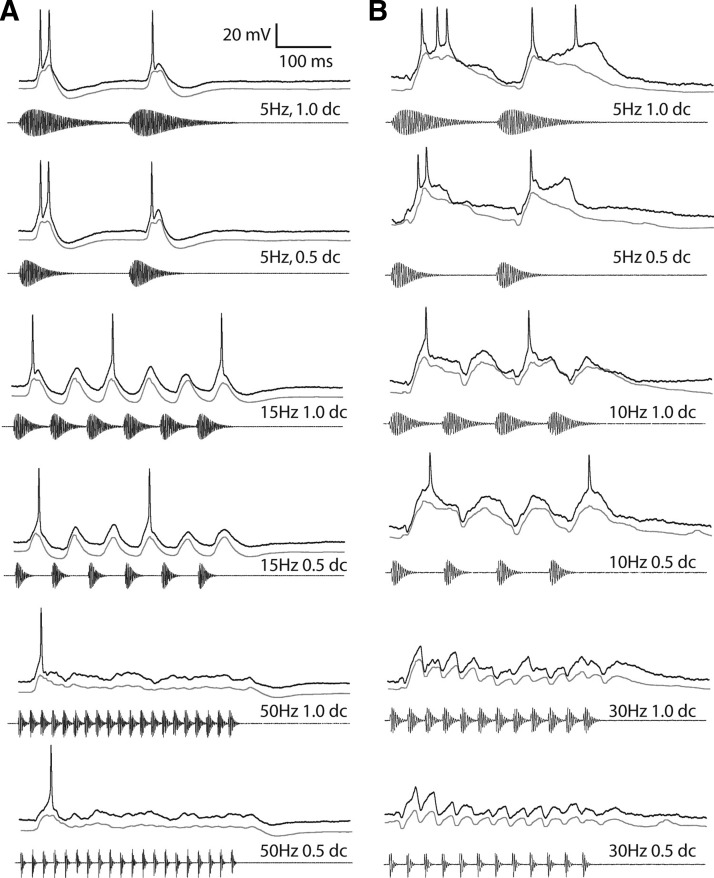
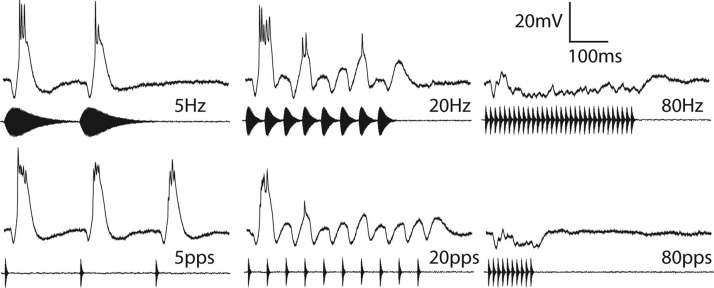
Extracellular recordings have shown that PRR selectivity in long-interval neurons is governed by the interpulse interval not the dimension of the silent gap between successive sound pulses (Alder and Rose 2000; Edwards et al. 2005). Accordingly, for neurons that showed depolarization that preceded hyperpolarization (Fig. 5A), stimulus-related response profiles were highly similar for AM stimuli of 1.0 and 0.5 duty cycle, i.e., stimuli with different ratios of pulse duration to interpulse interval. For the cell shown in Fig. 5B, 5-Hz AM at 1.0 duty cycle elicited depolarizations that were only slightly more sustained than those for 0.5 duty cycle stimuli. The recordings displayed in Fig. 6 also demonstrate that the stimulus-related patterns of membrane potential fluctuations were primarily determined by the interpulse intervals not pulse duration. Responses were highly similar at each AM or pulse repetition rate even though pulse duration varied substantially for the AM stimuli (Fig. 6). This particular neuron stopped firing to every pulse when the PRR or AM rate was equal to or exceeded ∼20 pps. Tonic inhibition was evident in averaged responses to stimuli having an AM rate or PRR of 80-Hz pps (right, Fig. 6). Across neurons, the amplitude of depolarizations to 100- versus 200-ms pulses (1.0 vs. 0.5 duty cycle, 5-Hz AM) did not differ (paired t-test, t25 = 0.554, P = 0.58) nor did the duration of depolarization (measured at 1/2 maximum amplitude, t25 = 1.60, P = 0.12).
FIG. 5.
Responses of 2 long-interval units to AM stimuli with different duty-cycles. A: responses of a unit to 5-, 15-, and 50-Hz AM at 1.0 and 0.5 duty cycles (ratio of pulse duration to interpulse interval). Resting potential = −57 mV; BEF = 600 Hz; 53 dB SPL. B: responses of another unit to 5-, 10-, and 30-Hz AM at 1.0 and 0.5 duty cycles. Resting potential = −74 mV; BEF = 300 Hz; 54 dB SPL. The black traces are responses to single presentations. The gray traces are averages of several repetitions after recording was median filtered with a time constant of 5 ms to remove spikes.
FIG. 6.
Averaged responses of a single neuron to stimuli in which pulse duration varied (top) or was constant (10ms; bottom) across AM or pulse repetition rates respectively: 5, 20, and 80 pps (left, middle, and right, respectively). Resting potential = −69 mV; BEF = 1300 Hz; 53 dB SPL.
Predicted versus observed long-interval selectivity
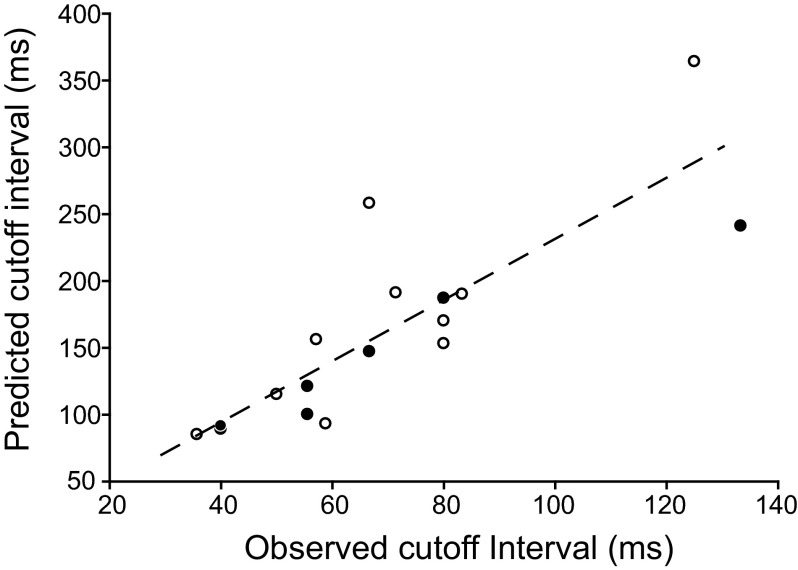
The data presented thus far suggest that interplay between excitation and inhibition contributes to most instances of long-interval selectivity. We predicted, therefore that response levels (spikes/stimulus presentation) would decline for intervals that were shorter than the time difference between the start of the depolarization and the end of the hyperpolarization; that is, at this interval, the inhibition from a particular pulse will begin to overlap with the excitation, and possibly the inhibition, from the next pulse. A “cutoff interval” was thus defined as the interpulse interval at which the response (spikes/stimulus presentation) dropped to a level that was midway between the maximum and minimum levels. Accordingly, for the 17 neurons for which we were able to estimate the time course of the inhibition, cutoff intervals were positively correlated with the time between the beginning of the depolarization and the end of the hyperpolarization (predicted cutoff interval) to each pulse (P < 0.0001, r2 = 0.70; Fig. 7). Observed cutoff intervals were consistently shorter than the predicted cutoff intervals (average observed/predicted ≈0.43), suggesting that substantial temporal overlap of inhibition and excitation was required to reduce the spike rate to half the maximum level. We could not determine the time course of the inhibition for seven neurons that showed an early hyperpolarization and spiked rarely or not at all to fast PRRs (e.g., Fig. 4C) because the inhibition did not extend beyond the excitation.
FIG. 7.
Predicted cutoff intervals versus observed cutoff intervals for neurons that showed hyperpolarization only after the depolarization (•) and neurons that had hyperpolarization both before and after the depolarization (○). The dashed line represents the best linear fit for these data.
Roles of inhibition
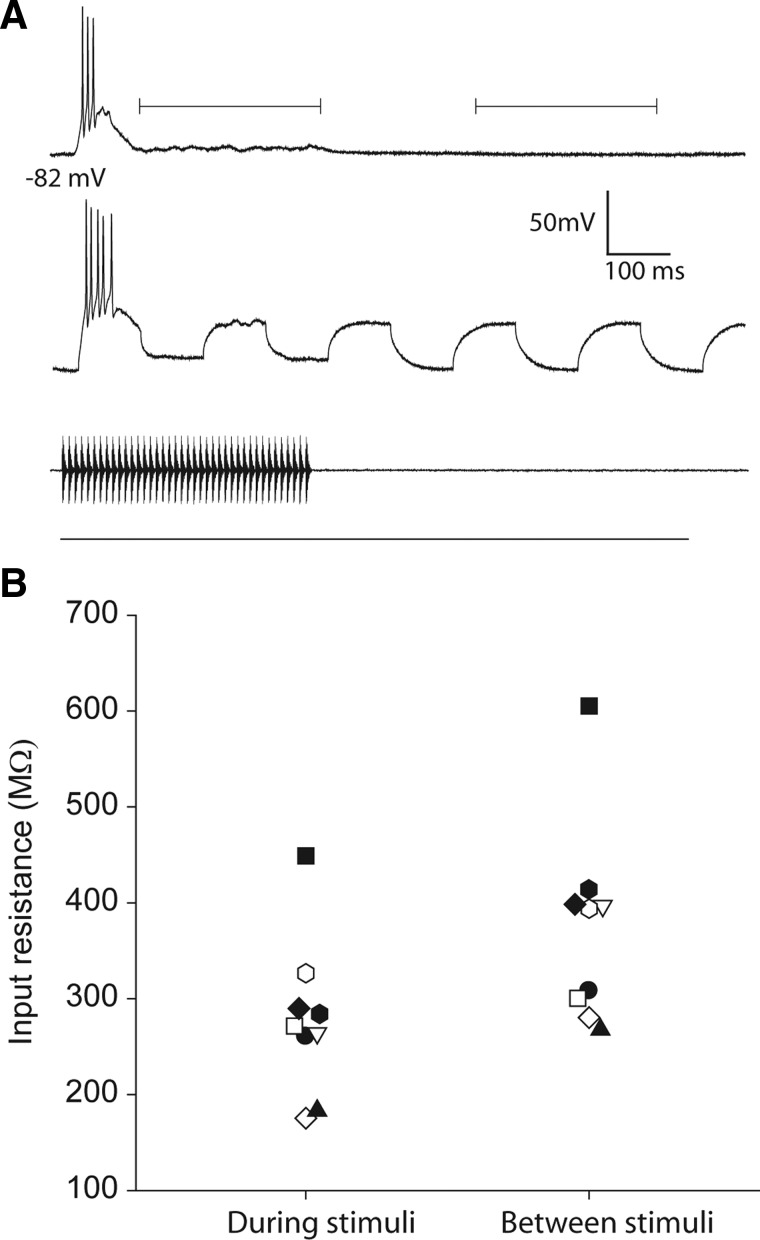
In units such as that shown in Fig. 6 (right traces), it is evident that inhibition was present throughout the stimulus at fast AM or PR rates. In other cases, however, the membrane potential remained near the resting level (Fig. 8A) or was depolarized but remained below threshold (Fig. 9), raising the question of whether inhibition was still present. To further investigate the role of inhibition in these and other cases, we made input resistance measurements during and after presenting fast AM rate stimuli, positive current-clamp recordings of responses to various AM rates, and recordings before and after attenuating inhibition with cesium.
FIG. 8.
A: recordings from a long-interval neuron during and after presentation of 100-Hz AM stimuli alone (top) or while −0.1-nA current pulses were delivered (bottom) to measure the input resistance of the cell. Brackets indicate where measurements were taken during (left bracket) and between stimuli (right bracket). B: the input resistances of nine neurons (each neuron denoted by a different symbol) measured during and between the responses to stimuli.
FIG. 9.
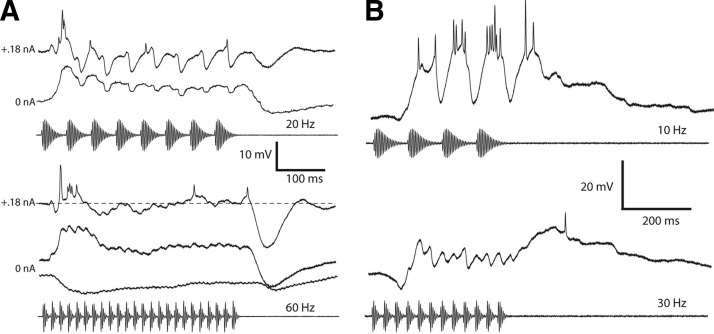
A, top: averaged responses of a neuron to 20-Hz AM recorded with +0.18-nA current (top trace) and 0-nA (bottom trace) current clamp. Bottom: averaged responses of same neuron to 60-Hz AM recorded with +0.18-nA current clamp or no current injected (middle trace). Bottom trace: averaged response to 60-Hz AM with a carrier frequency (600 Hz) that primarily elicited inhibition. Resting potential = −74 mV; BEF = 325 Hz; 74 dB SPL. B: averaged responses of a neuron with an offset response at fast AM rates to 10-Hz AM (top) and 30-Hz AM (bottom panel). Resting potential = −77 mV; BEF = 180 Hz; 77 dB SPL.
We first measured the input resistance of neurons during and between stimulus presentations. The exemplar neuron shown in Fig. 8A responded phasically (depolarization and burst of spikes) to a 100-Hz AM stimulus with little depolarization during approximately the last 300 ms of the stimulus (top trace). The lower trace (Fig. 8A) shows the voltage changes that occurred in response to the stimulus and current pulses delivered through the recording electrode. The two brackets above the top trace indicate the periods during which input resistances were measured for this and eight other cells (Fig. 8B). The input resistance of these neurons dropped by an average of 26%, relative to prestimulus levels and did not change by more than ∼5% across the intrastimulus time periods during which they were measured, indicating that the conductances were fairly stable during these periods. Across cells, the input resistances during the stimulus presentations were significantly less than those measured during the period between presentations (Wilcoxon sign test, z = 3.0, P < 0.005, n = 9). This decrease in input resistance suggests that inhibitory (and excitatory) conductances were still present. The excitatory conductance required to elicit the depolarizations (in the late stages of response, Fig. 8A) ranged from 9 to 44% of the conductance change measured, assuming the synaptically related current passed across the input resistance measured during the stimulus.
Next we made positive current-clamp recordings to more easily view inhibition to a cell. For example, positive current-clamp recordings from the neuron shown in Fig. 9A (top traces in each panel) revealed that inhibition was present throughout the stimulus; the large IPSP occurred after the end of the stimulus. In a few neurons, the frequency tuning of the inhibition was broader than that of the excitation, thereby enabling us to primarily elicit inhibition (Fig. 9A, bottom trace). Consistent with the positive current-clamp recordings, the inhibition was present throughout the stimulus at fast rates although we cannot exclude the possibility that the inhibition had a different time course at this carrier frequency.
Although fast PRRs appeared to elicit inhibition in almost all neurons studied, the extent to which it contributes to the long-interval selectivity is unclear; alternatively, excitatory inputs may respond poorly to fast PRRs. To address this issue, we examined responses of seven cells in which inhibition preceded but did not appear to exceed the duration of the excitation. If excitation outlasts inhibition and does not depress over time, offset responses should occur as the cell is released from inhibition; in such a case, the amplitude of depolarizations should provide a measure of the strength of excitation at fast PRRs. Accordingly, three of these cells showed poststimulus depolarizations that occasionally triggered spikes. The exemplar shown in Fig. 9B exhibited a 19.6-mV depolarization after the 30-Hz AM stimulus in contrast to a 27.8-mV depolarization to the last pulse of the 10-Hz AM stimulus. It is unclear in the remaining four neurons whether the absence of offset depolarizations results from depression of excitation or cancellation by concurrent inhibition. Recordings at several levels of current clamp will be required to dissociate between these possibilities.
Cesium effects
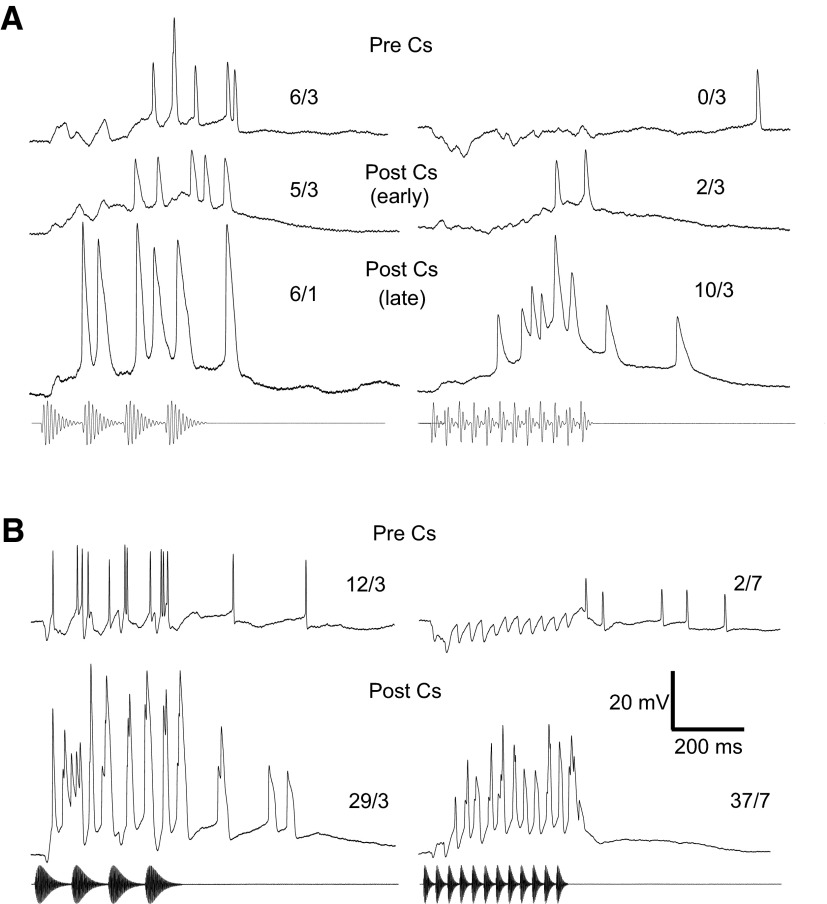
The results presented thus far suggest that inhibition overlaps with excitation to attenuate responses to fast PRRs. To further test this hypothesis, we substituted CsF for potassium gluconate in the recording pipettes; Cs+ and F− block potassium and chloride channels, respectively (Nelson et al. 1994). Two of the eight long-interval-selective neurons that were recorded with CsF pipettes were held long enough to sufficiently load with Cs+ with positive current as measured by a broadening of action potentials and concomitant reduction of inhibition. In both cases, long-interval selectivity was diminished following attenuation of inhibition. Although we recorded initially with negative current clamp (<0.02 nA) in these two neurons, inhibition was not attenuated, suggesting that this inhibition was not mediated by Cl− conductances. Recordings from these neurons are shown in Fig. 10. Prior to loading each cell with Cs+, a 30-Hz AM stimulus elicited an early hyperpolarization followed by a return of the membrane potential to near or slightly above resting level (top right traces, Fig. 10, A and B, respectively). As expected for long-interval-selective neurons, a 10-Hz AM stimulus resulted in depolarization and spiking (top left traces, Fig. 10, A and B). As the cell was loaded with Cs+, spikes became progressively broader and the inhibition decreased (middle and bottom traces in Fig. 10A; bottom traces in B). This Cs+-induced attenuation of the inhibition unmasked excitation in response to the 30-Hz AM stimulus, which resulted in a depolarization that peaked near the end of (Fig. 10A) or slightly after (B) the stimulus and triggered spikes. To ensure that the post Cs+ responses did not result from the cells being depolarized by Cs+, we recorded while injecting a constant amount of negative current sufficient to hyperpolarize these neurons by 2–4 mV.
FIG. 10.
A and B: averaged responses of 2 long-interval-selective neurons to 10-Hz (left) and 30-Hz AM (right) before (Pre Cs) and after (Post Cs) Cs+ attenuated inhibition. Middle and bottom traces in A and B, respectively, show the responses after Cs+ began to take affect as evidenced by the broadening of the action potentials. The bottom recording traces in A show the responses after actively loading the neuron with Cs+ by briefly injecting positive current. The numbers above each trace are the number of spikes/number of repetitions. A: resting potential = −72 mV; BEF = 190 Hz; 84 dB SPL. B: resting potential = −62 mV; BEF = 600 Hz; 57 dB SPL.
DISCUSSION
Our results provide the first intracellular recordings of long-interval-selective neurons in the anuran IC (torus semicircularis) and thus provide insights into the mechanisms that underlie their selectivity. Interactions among excitation, inhibition, and rate-dependent depression of excitation appear to play central roles in creating long-interval selectivity as predicted by current models. However, our results suggest that existing models do not completely account for the response profiles of most of the sampled neurons. Modifications to current models are therefore required to explain discrepancies between model predictions and response profiles observed in the present study.
Support for current models
Grothe (1994) proposed that interactions between excitation and inhibition could create long-interval selectivity. In this model, each pulse elicits excitation that is followed by inhibition (Fig. 1A). Hence at slow AM or PRR rates, each pulse elicits a spike or burst of spikes. At sufficiently high rates, however, the excitation from each pulse overlaps with the delayed inhibition from the previous pulse. This model therefore predicts a phasic response that is restricted to stimulus onset at fast PRRs.
Our results indicate that ∼25% of the sampled neurons exhibited response profiles that were consistent with this model; hyperpolarization followed depolarization to each pulse, and these cells responded phasically at the onset of stimuli with high PRRs. Furthermore, the time interval between the onset of depolarization and the end of hyperpolarization to each pulse was well correlated with the cutoff intervals (i.e., the pulse interval where spikes/stimulus presentation dropped to a level that was midway between the maximum and minimum levels), suggesting that interactions between excitation and delayed inhibition contribute to long-interval selectivity. Attenuating stimulus-related inhibition with Cs+ in two cells increased the response to shorter intervals, further demonstrating the importance of inhibition; injecting F− to block Cl− channels did not appear to attenuate this inhibition. This evidence suggests that K+ channels are responsible for the inhibition. However, given the limited data set, we cannot rule out the possibility that GABAA channels contribute to inhibition in all long-interval neurons.
Fortune and Rose (2000) provided an alternative mechanism for long-pass interval selectivity; preference for slow beat rates in midbrain neurons of electric fish were shown to arise, in part, from rate-dependent synaptic depression. As in the Grothe (1994) model, mechanisms of interval selectivity involving synaptic depression are expected to result in a response profile wherein spikes are restricted to stimulus onset. Consistent with such a mechanism, we recorded from three neurons that reliably spiked at stimulus onset and exhibited little if any inhibition; the long-interval selectivity of these neurons appeared to arise from a strong reduction in the magnitude of the depolarization over the course of several consecutive pulses presented at high rates.
On the other end of the spectrum, inhibition appeared to largely account for long-interval selectivity. For example, there was little evidence of depression of excitation in the two neurons that were loaded with cesium (as shown in Fig. 10). For most of the recorded neurons, however, the acquired data were insufficient for quantitatively establishing the relative contributions of depression and inhibition in creating long-pass selectivity. Additional recordings are needed, particularly under conditions where inhibition has been minimized, to further define the role that depression of excitation plays in long-interval selectivity. Similarly, extensive recordings at several levels of negative current clamp (Priebe and Ferster 2005) should permit a better understanding of the time courses of excitatory and inhibitory conductances in long-interval neurons. These additional data are needed to more precisely identify the respective roles of inhibition versus depression of excitation in generating long-interval selectivity.
Potential mechanisms underlying depression of excitation could be pre- or postsynaptic. Presynaptically, the reduction of excitation at fast AM rates could reflect long-interval selectivity of inputs, e.g., the superior olive (Condon et al. 1991), or synaptic depression of transmitter release at the synapses that afferents make onto midbrain cells. Postsynaptically, receptor desensitization could play a role in this depression. Future studies could directly stimulate toral afferents to disassociate the relative contributions of synaptic plasticity and temporal filtering upstream (Fortune and Rose 2000).
Inconsistencies with current models
Nearly 2/3 of the long-interval-selective neurons sampled in the present study did not respond to the onset of fast AM or PRR stimuli as predicted by the preceding models. These neurons differed from the former cases in that hyperpolarization typically preceded the depolarization to each pulse. It thus appears that the relative timing of inhibition and excitation can create a class of long-interval-selective neurons that are readily distinguishable from the former cases. Current evidence suggests that the mechanisms underlying selectivity of these neurons involve extensions of the Grothe model; the time course of the inhibition is shifted to precede the excitation (Fig. 11). In these cases, a reduction in the interval between successive pulses results in the overlap of inhibition from one pulse with the longer latency excitation of the preceding pulse. The temporally overlapping inhibition that is elicited by successive pulses at fast PRRs may “veto” the excitation from these pulses, such that these cells do not spike at the onset of or during a fast PRR stimulus. However, weaker excitation at these PRRs might also contribute to the lack of responses. Several lines of evidence support a veto role for inhibitory inputs to many of these neurons. Input resistance measurements made during fast PRR stimuli indicate that inhibition persists throughout these stimulus presentations. Second, attenuating inhibition with cesium unmasks supra-threshold excitation that is present at fast PRRs. Third, in some cases, prominent depolarization could be seen following the offset of a fast PRR stimulus, suggesting that excitation was present and that inhibition plays a key role in limiting responses at these PRRs. This role of inhibition in countering relatively strong excitation has also been observed in visual cortical neurons (Borg-Graham et al. 1998; Tucker and Fitzpatrick 2006). Inhibition may strongly counteract excitation, particularly if excitatory synapses are situated distally on the dendrites, e.g., on dendritic spines, and inhibitory synapses are located more proximally (Trevelyan and Watkinson 2005). Our model (Fig. 11) thus incorporates interactions between excitation and inhibition as well as rate-dependent depression of excitation to explain the response profiles for many of the neurons sampled in the present study.
FIG. 11.
Model of long-interval selectivity, incorporating short-latency inhibition and delayed excitation that depresses at fast pulse repetition rates.
Finally, Large and Crawford (2002) proposed an extension of the Grothe (1994) model that incorporates postinhibitory rebound depolarization. Over a narrow range of intervals, this rebound coincides with the excitation elicited by the next pulse, thereby augmenting the response and creating band-pass interval selectivity. In cases where excitation preceded inhibition, rebound depolarizations were sometimes observed, but they did not result in band-pass interval selectivity. At least in anurans, interplay between rate-dependent enhancement of excitation and inhibition appears to underlie band-pass interval selectivity (Edwards et al. 2007). The differential timing of excitation and inhibition appears to be an important general computational property in sensory systems [auditory (Casseday et al. 1994; Wehr and Zador 2003), visual (Jagadeesh et al. 1993; Preibe and Ferster 2005), somatosensory (Wilent and Contreras 2005)].
Relation to acoustic behavior
Long-interval neurons of both species studied responded best (maximum number of spikes/stimulus presentation) to PRRs of 5–10 pulse/s when pulse number was held constant. This selectivity should be suitable for mediating selective behavioral responses to the advertisement calls of northern leopard frogs, which have PRRs of ∼10–15 pulse/s. However, male H. regilla, the other species used in this study, produce advertisement and aggressive calls that have PRRs of ∼80 and 25 pulse/s, respectively. If H. regilla uses long-interval neurons to discriminate between aggressive and advertisement call types, then slow PRRs, e.g., 10 pulse/s, should effectively elicit aggressive responses and activate the same central detectors that are activated by natural aggressive calls. Behavioral studies in the field confirm these predictions; males treat experimental calls with slow PRRs as aggressive signals (unpublished data). Males may repeat pulses at 25 pulse/s to maximize the initial spike rate of long-interval neurons; that is, because more pulses occur per window of time as PRR is increased, more spikes are elicited, up to a particular cutoff rate (20–30 pulse/s in some cases, Fig. 2A). Producing pulses at a rate slightly higher than the “optimal rate” (determined using stimuli in which pulse number is held constant) might therefore better convey an aggressive message in a short period of time. Female northern leopard frogs, however, may assess advertisement calls over much longer time periods, and their behavior may be more tightly linked to the neural responses elicited by the entire calls. This could make them more responsive to PRRs in the optimal range of long-interval neurons. Playback experiments using different PRRs with a constant number of pulses could determine whether a preference for 10–15 pps exists.
GRANTS
This work was supported by grants from the National Institutes of Health.
Acknowledgments
We thank Y. Hanabusa and Shushruth for technical assistance and E. Brenowitz and T. Bryenton for help collecting frogs.
The costs of publication of this article were defrayed in part by the payment of page charges. The article must therefore be hereby marked “advertisement” in accordance with 18 U.S.C. Section 1734 solely to indicate this fact.
REFERENCES
- Alder 2000.Alder TB, Rose GJ. Integration and recovery processes contribute to the temporal selectivity of neurons in the northern leopard frog, Rana pipiens. J Comp Physiol [A] 186: 923–937, 2000. [DOI] [PubMed] [Google Scholar]
- Atkins 1988.Atkins G, Chiba A, Atkins S, Stout JF. Low-pass filtering of sound signals by a high-frequency brain neuron and its input in the cricket Acheta domestica L. J Comp Physiol [A] 164: 269–276, 1988. [Google Scholar]
- Borg-Graham 1998.Borg-Graham LJ, Monier C, Frégnac Y. Visual input evokes transient and strong shunting inhibition in visual cortical neurons. Nature 393: 369–373, 1998. [DOI] [PubMed] [Google Scholar]
- Burger 1998.Burger RM, Pollak GD. Analysis of the role of inhibition in shaping responses to siusoidally amplitude-modulated signals. J Neurophysiol 80: 1686–1701, 1998. [DOI] [PubMed] [Google Scholar]
- Capranica 1975.Capranica RR, Moffat AJM. Selectivity of the peripheral auditory system of spadefoot toads (Scaphiopus couchi) to sounds of biological significance. J Comp Physiol 100: 231–249, 1975. [Google Scholar]
- Casseday 1994.Casseday JH, Ehrlich D, Covey E. Neural tuning for sound duration: role of inhibitory mechanisms in the inferior colliculus. Science 64: 847–850, 1994. [DOI] [PubMed] [Google Scholar]
- Casseday 2002.Casseday JH, Ehrlich D, Covey E. The inferior colliculus: a hub for the central auditory system. In: Integrative Functions in the Mammalian Auditory Pathway, edited by Oertel D, Fay RR, Popper AN. New York: Springer, 2002, p. 238–318.
- Condon 1991.Condon CJ, Chang S, Feng AS. Processing of behaviorally relevant temporal parameters of acoustic stimuli by single neurons in the superior olivary nucleus of the leopard frog. J Comp Physiol [A] 168: 709–725, 1991. [DOI] [PubMed] [Google Scholar]
- Cooper 1960.Cooper GW, Meyer LB. The Rhythmic Structure of Music. Chicago, IL: Univ Chicago Press, 1960.
- Diehl 2004.Diehl RL, Lindblom B. Explaining the structure of feature and phoneme inventories: the role of auditory distinctiveness. In: Speech Processing in the Auditory System, edited by Greenberg S, Ainsworth WA, Popper AN, Fay RR. New York: Springer, 2004, p. 101–162.
- Edwards 2002.Edwards CJ, Alder TB, Rose GJ. Auditory midbrain neurons that count. Nat Neurosci 5: 934–936, 2002. [DOI] [PubMed] [Google Scholar]
- Edwards 2005.Edwards CJ, Alder TB, Rose GJ. Pulse rise time but not duty cycle affects the temporal selectivity of neurons in the anuran midbrain that prefer slow AM rates. J Neurophysiol 93: 1336–1341, 2005. [DOI] [PubMed] [Google Scholar]
- Edwards 2007.Edwards CJ, Leary CJ, Rose GJ. Counting on inhibition and rate-dependent excitation in the auditory system. J Neurosci 27: 13384–13392, 2007. [DOI] [PMC free article] [PubMed] [Google Scholar]
- Ehret 1996.Ehret G Common rules of communication sound perception. In: Behavior and Neurodynamics for Auditory Communication, edited by Kanwal JS, Ehret G. Cambridge, UK: Cambridge Univ. Press, 1996, p. 85–114.
- Fortune 2000.Fortune ES, Rose GJ. Short-term synaptic plasticity contributes to the temporal filtering of electrosensory information. J Neurosci 20: 7122–7130, 2000. [DOI] [PMC free article] [PubMed] [Google Scholar]
- Gerhardt 1988.Gerhardt HC Acoustic properties used in call recognition by frogs and toads. In: The Evolution of the Amphibian Auditory System, edited by Fritzch B, Ryan MJ, Wilczynski W, Hetherington TE, Walkowiak W. New York: Wiley, 1988, p. 275–294.
- Gerhardt 2001.Gerhardt HC Acoustic communication in two groups of closely related treefrogs. Adv Study Behav 30: 99–167, 2001. [Google Scholar]
- Gerhardt 2002.Gerhardt HC, Huber F. Acoustic Communication in Insects and Anurans. Chicago, IL: Univ Chicago Press, 2002.
- Grothe 1994.Grothe B Interaction of excitation and inhibition in processing of pure tone and amplitude-modulated stimuli in the medial superior olive of the mustached bat. J Neurophysiol 71: 706–721, 1994. [DOI] [PubMed] [Google Scholar]
- Jagadeesh 1993.Jagadeesh B, Wheat HS, Ferster D. Linearity of summation of synaptic potentials underlying selectivity in simple cells of the cat visual cortex. Science 262: 1901–1904, 1993. [DOI] [PubMed] [Google Scholar]
- Kruse 1982.Kruse KC Phonotactic responses of female northern leopard frogs (Rana pipiens) to Rana blairi, a presumed hybrid, and conspecific mating trills. J Herp 15: 145–150, 1982. [Google Scholar]
- Large 2002.Large EW, Crawford JD. Auditory temporal computation: interval selectivity based on post-inhibitory rebound. J Comput Neurosci 13: 125–142, 2002. [DOI] [PubMed] [Google Scholar]
- Leary 2008.Leary CJ, Edwards CJ, Rose GJ. Midbrain auditory neurons integrate excitation and inhibition to generate duration selectivity: an in-vivo whole-cell patch study in anurans. J Neurosci 28: 5481–5493, 2008. [DOI] [PMC free article] [PubMed] [Google Scholar]
- Margoliash 1992.Margoliash D, Fortune ES. Temporal and harmonic combination-sensitive neurons in the zebra finch's HVc. J Neurosci 12: 4309–4326, 1992. [DOI] [PMC free article] [PubMed] [Google Scholar]
- Moss 1995.Moss CF, Schnitzler H. Behavioral studies of auditory information processing. In: Hearing by Bats edited by Popper, AN, Fay RR. New York: Wiley, 1995, 87–145.
- Nelson 1994.Nelson S, Toth L, Sheth B, Sur M. Orientation selectivity of cortical neurons during intracellular blockade of inhibition. Science 265: 774–777, 1994. [DOI] [PubMed] [Google Scholar]
- Priebe 2005.Priebe NJ, Ferster D. Direction selectivity of excitation and inhibition in simple cells of the cat primary visual cortex. Neuron 45: 133–145, 2005. [DOI] [PubMed] [Google Scholar]
- Rose 1997.Rose GJ, Brenowitz EA. Plasticity of aggressive thresholds in Hyla regilla: discrete accommodation to encounter calls. Anim Behav 53: 353–361, 1997. [Google Scholar]
- Rose 2002.Rose GJ, Brenowitz EA. Pacific treefrogs use temporal integration to differentiate advertisement from encounter calls. Anim Behav 63: 1183–1190, 2002. [Google Scholar]
- Rose 1983.Rose G, Capranica RR. Temporal selectivity in the central auditory system of the leopard frog Rana pipiens. Science 219: 1087–1089, 1983. [DOI] [PubMed] [Google Scholar]
- Rose 1984.Rose GJ, Capranica RR. Processing amplitude-modulated sounds by the auditory midbrain of two species of toads: matched temporal filters. J Comp Physiol [A] 154: 211–219, 1984. [Google Scholar]
- Rose 1996.Rose GJ, Fortune ES. New techniques for making whole-cell recordings from CNS neurons in vivo. Neurosci Res 26: 89–94, 1996. [DOI] [PubMed] [Google Scholar]
- Rose 2007.Rose GJ, Gooler DM. Function of the anuran central auditory system. In: Hearing and Sound Communication in Amphibians. Springer Handbook of Auditory Research, edited by Feng AS, Narins PM, Fay RH, Popper AH. New York: Springer-Verlag, 2007, p. 250–290.
- Trevelyan 2005.Trevelyan AJ, Watkinson O. Does inhibition balance excitation in neocortex? Prog Biophys Mol Biol 87: 109–143, 2005. [DOI] [PubMed] [Google Scholar]
- Tucker 2006.Tucker TR, Fitzpatrick D. Luminance-evoked inhibition in primary visual cortex: a transient veto of simultaneous and ongoing response. J Neurosci 26: 13537–13547, 2006. [DOI] [PMC free article] [PubMed] [Google Scholar]
- Wehr 2003.Wehr M, Zador AM. Balanced inhibition underlies tuning and sharpens spike timing in auditory cortex. Nature 426: 442–446, 2003. [DOI] [PubMed] [Google Scholar]
- Wilent 2005.Wilent WB, Contreras D. Dynamics of excitation and inhibition underlying stimulus selectivity in rat somatosensory cortex. Nat Neurosci 8: 1364–1370, 2005. [DOI] [PubMed] [Google Scholar]
- Yang 1997.Yang L, Pollak GD. Differential properties to amplitude modulated signals in the dorsal nucleus of the lateral lemniscus of the mustache bat and the roles of GABAergic inhibition. J Neurophysiol 77: 324–340, 1997. [DOI] [PubMed] [Google Scholar]


