Abstract
The nerve fiber layer of the human retina is made up of the retinal segments of ganglion cell axons. Its geometry can be described mathematically as a fibration of a 2D domain: a partition of a certain region into smooth curves. Here, we present a simple family of curves that closely models the observed geometry of the nerve fiber layer. For each retina, the pattern depends on 2 parameters, A and B: A computer program determines A and B for a given retina and the theory matches the retina with a standard deviation of ≈6–8°. These particular curves turn out to be the curves that would be generated if the growing ganglion cell axon tip moved down a gradient toward a source of diffusible neuroattractant at the disk and away from a weaker macular diffusible repellant. Thus, this model provides morphological evidence that diffusible substances provide positional information to the embryonic ganglion cell axons in finding their way to the optic nerve head.
Keywords: diffusion, embryology, optic nerve, retina
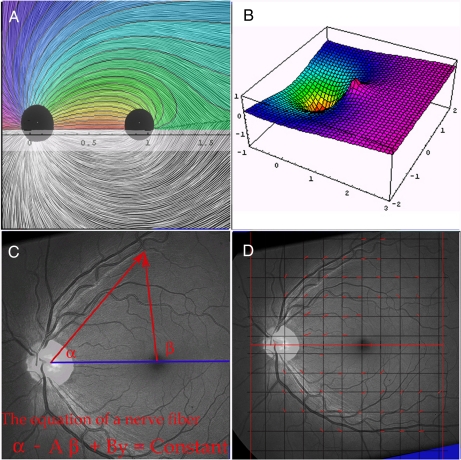
The human optic nerve consists of bundles of axons originating in the ganglion cells of the retina. These axons first traverse the retina in a typically unmyelinated layer called the nerve fiber layer (NFL), before converging at the optic disk and, subsequently, emerging from the globe in the optic nerve. Thus, the detailed anatomy of the optic nerve head depends crucially upon the axon paths in the NFL. (Fig. 1A) The NFL was first described in 1914 by Vogt (1). Because of its transparency, the NFL is difficult to visualize and was not photographed for another fifty years (2). An improved method for wide angle, conformal (angle-preserving) photography was later devised (3).
Fig. 1.
Definitions and technique. (A) A pen and ink drawing of the human retina by P.J.A. The dark disk on the left represents the optic disk and the rightmost disk is the perimacular area. The upper half has been overlaid by the matching curves of our mathematical model with parameters A = 0.379418 and B = 0.303835. (B) Graph of hypothetical potential function, F, with parameters A = 0.4 and B = 0.1. Nerve fibers are postulated to move in the direction of steepest decline downhill. The depression at coordinates (0, 0) represents the optic nerve sink and the peak (truncated) at (0, 1) is the macular source. Notice the ridge from the macular peak, creating the horizontal raphe watershed. (C) Retina 1 with graphic illustrating geometric definitions of the angles a and b. (D) Grid (spacing 0.2 in x–y coordinates) laid over photo of retina I. Red line segments indicate the NFL direction at points of lattice L.
The fascicles of the NFL have the following characteristics:
Macula-avoiding. The ganglion cells are displaced radially from the macula and their axons radiate from the macula, so that no axons cross over the macula.
Horizontal raphe. The direction of nerve fiber varies continuously throughout the retina except along the horizontal raphe, the ray originating at the macula directed away from the nerve. No fibers cross the raphe, which is a sort of part or watershed in the retinal fibration. Axons just superior to the raphe are directed superiorly, while neighboring fiber just inferior abruptly take the opposite direction.
Noncrossing. When axons from distal cells pass over proximal fibers, they follow the same path as the more proximal fibers, but on a more inner retinal layer. Thus, the fibers passing over any point determine a unique direction (excluding, of course, the macula and horizontal raphe—the two areas without overlying fibers). Vogt's article (1) overlooked this noncrossing feature.
Any theory of retinal pathfinding by embryonic ganglion cell axons should account for the three features detailed above. Crick (4) made plausible the proposal of Ramon y Cajal (5) that positional information in embryology is specified by gradients of “morphogens,” diffusible substances acting as attractants or repellants—in this case, for the growing ganglion cell tip, the growth cone. Because these factors are diffusible, near equilibrium this potential function will be harmonic, i.e., the concentration of morphogens at any point will equal the average at surrounding points. Let us assume, for the moment, that all such morphogens act independently (for example, by modulating the activity of some common receptor) without interaction terms and without competition between different axons. One of the reviewers kindly called our attention to an example of such behavior for the retinotectal map (6). Then, the overall effect can be encapsulated in one potential function defined throughout the retina, with the axon growing in the direction of the potential's steepest gradient. The location of the optic disk would be signaled by placing a strong neuroattractant source there. Such a theory readily accounts for noncrossing, which is further reinforced because distal axons follow the course of earlier pathfinders, whereas macula avoidance results by postulating a weaker repelling morphogen at the macula. The horizontal raphe would then represent the ridge that is thereby created by an unbalanced dipole of morphogens(Fig. 1B). Thus, the three qualitative features of the NFL emerge from features of the morphogen gradients. An alternative mechanism, which we also explore, is to place a streak of neurorepellant along the initial segment of the raphe.
The purpose of this article is 2-fold. First, we present a family of planar curves with a simple mathematical character and we demonstrate that they closely match the course of nerve fibers observed in retinal photography. Second, we propose a mechanism that explains the pattern seen.
We define our family of curves in terms of a coordinate system on the plane (the photographic image of the retina) but, of course, every such curve in the plane corresponds to a curve in the retina. Formally, if m represents a stereographic, conformal map from the curved, posterior retina to the flat photographic plate then a function F on the photo corresponds to the function G = F ○ m on the retina and conversely (F = G ○ m−1). The crucial point is that harmonic functions remain harmonic under this correspondence. It becomes convenient, then, to define functions on the photo, whose data are readily accessible, and then transfer them back to the retina. Thus, we will overlay a Euclidean coordinate system onto the retinal photo, with the origin N at (0, 0) placed within the optic nerve head, and a macular point M at (1, 0). For an arbitrary point P = (x, y) in the plane, let α(P) be the angle at N between the x axis and the point P and β(P) the corresponding angle at M (Fig. 1C). Then, the coordinate functions x and y and the functions α and β are all harmonic, and so they all correspond to harmonic functions on the retina. If we fix positive numbers A and B, then the function Ψ = α − Aβ + By will be harmonic. The equation
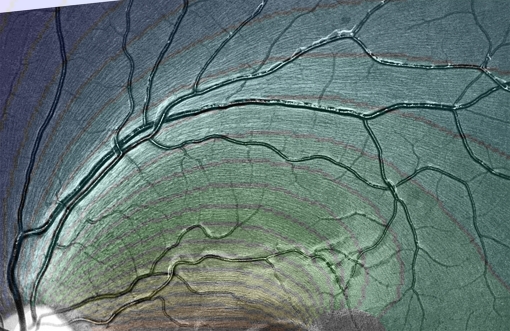
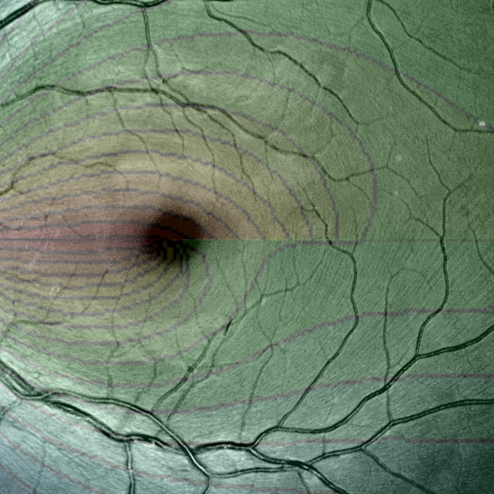
produces a curve that represents the course of a single nerve fiber. As the constant varies, a collection of curves fibrates the plane in a manner that closely models the nerve fiber pattern on the retinal photo (Fig. 2). Why was this particular function, Ψ, chosen? Matching Theory with Data gives the empirical justification, whereas Theoretical Model of the Nerve Fiber Layer (NFL) derives this particular function, Ψ, from the assumption that diffusible morphogens at the disk, macula and periphery set up a gradient field, which directs the axon growth cone.
Fig. 2.
Magnified view of Retina 6, illustrating NFL fibration. Overlay shows computed fibration using the parameters A = 0.444294 and B = 0.168305.
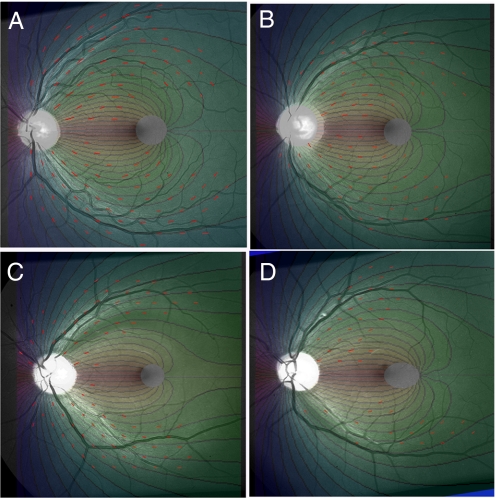
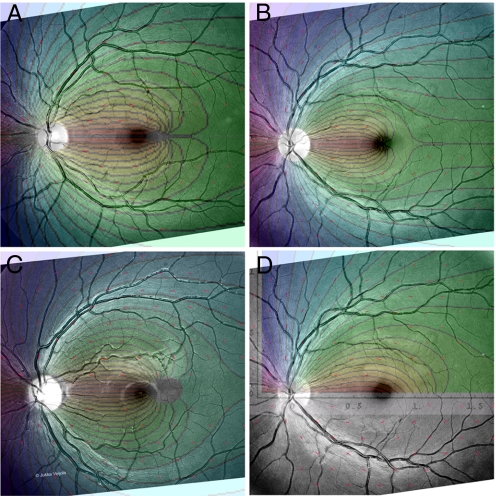
We must exclude the optic nerve head, the perimacular region and the peripheral retina from consideration in modeling the NFL. These three areas represent the boundary zones of the NFL. We will first describe a method of gathering data encapsulating the direction of nerve fibers over broad regions of the ordinary retina into certain matrices. Then, for each retina, we search for the best values of the two parameters, A and B. Figs. 3 and 4 show graphically the extent to which these two numbers encapsulate the geometric pattern of the NFL. The model curves are contour lines of a harmonic function.
Fig. 3.
Retinal photos comparing measured NFL directions with theoretical curves. Lattice K of measured NFL directions is indicated by red line segments. The corresponding theoretical contour plots are calculated from the values for K in Table 1 for Retina 1 (A), Retina 2 (B), Retina 3 (C), Retina 4 (D).
Fig. 4.
Retinal photos with lattice K of and corresponding theoretical contour plots, calculated from K data for Retina5 (A), Retina6 (B), Retina7 (C), and Retina6 and lattice K (D), now showing theoretical overlay for streak potential using parameters in Table 2.
Our second goal is in a more theoretical vein: These curves are precisely what would be generated if the growing axon tip moved along a gradient toward a source of diffusible neuroattractant at the optic disk and away from a weaker macular neurorepellant. The parameters A and B, which specify the fibration for a particular retina, then acquire simple interpretations: A represents the ratio of strength between the nerve and macular factors, and B the strength of a linear, temporal-to-nasal gradient. This viewpoint permits the flexible construction of alternative 2D flows by altering the placement of sources and sinks. We explore this with a model in which the macular morphogen extends in a linear streak along the initial segment of the horizontal raphe. In both models, the curves are contour lines of harmonic functions. We will discuss the distinctive geometric features present in all fibrations derived in this way from harmonic functions.
Results
Retinal Nerve Fiber Layer (NFL) Data.
The retinal Photoshop image is standardized by a rotation making the line from nerve to macula horizontal, with the nerve to the left, and a coordinate grid is overlaid. Each lattice point is inspected and, if the direction of the nerve fiber layer is visible, that lattice point is marked by a small tangent line segment originating there, and the direction of the tangent is recorded in degrees between 0° and 180° but excluding 0°. Because of this standardization to a value in the 0–180° range, the tangent segment sometimes points in the direction of nerve growth from macula to nerve and sometimes against this direction. The entire collection of NFL angle data can be summarized in a matrix, where position in the matrix corresponds to location on the retinal lattice. Because the NFL cannot be easily visualized, the entry, zero, is used as a place holder for points over the disk, macula or raphe, or other points where the NFL direction cannot be readily ascertained. The matrix L consists of mesh points with odd coordinates, whereas K is a finer lattice where both coordinates are of equal parity. In general, lattice size is chosen so as to obtain ≈40–60 data points over a broad area of the retina, because larger numbers will lead to protracted computation times in calculating the parameters A and B (>1 hour) without significantly different results.
Matching Theory with Data.
Information about the direction of the nerve fiber layer has been encoded in the 10 × 20 data matrix L (or in the larger 25 × 25 matrix K). Recall that all entries are given in degrees ranging from 0° to 180°, but that a 0° entry represents a nonmeasurable point. The directions predicted at lattice points are given by a corresponding matrix S, consisting of the directional data calculated using the contours of the function Ψ = α − Aβ + By. Of course, entries in S are mathematical expressions depending on the parameters A and B. Values for A and B are then chosen by minimizing a particular target function: The mean square difference between the non-zero entries of L and S. The computer draws a graphic display of the theoretical NFL and provides parameters, which specify where to position this graphic over the retinal photo for an optimal match. The fit between L and S will, of course, depend crucially on this positioning process. Curiously enough, the best data fit consistently occurs not at the exact center of the nerve but at a point along the horizontal diameter ≈2/3 of the way nasally. This may plausibly be because many more nerves fibers enter the optic canal from a temporal direction than nasally, thus resculpting the nerve. It is also notable that the macular source, representing the “center of gravity” of the macular morphogen appears displaced ≈1/3 of a disk diameter from the adult anatomic macula. The positioning of the macular source is one factor suggesting a “streak” model of the macular source, discussed below. It may represent a difference in growth rate between macula and ordinary retina or subsequent migration of ganglion cells (7), because the macula is subject to extensive embryologic rescuplting (8). Further comments on implementation and the Mathematica pseudocode are in SI Appendix.
The results in Table 1 show that A and B can be selected so as to reduce the average discrepancies between theory and measurement to ≈4–7° with a standard deviation between 5° and 10°. Sources of error in matching equations to data include difficulties in the precise measurement of angles and variability in fixation during photography (thus inducing a small Moebius transformation of the retinal image). A and B remain essentially stable to ≈0.03 when the dataset L is expanded to the larger matrix K. Figs. 3 and 4 display the computer-generated theoretical curves overlaid on the retinal photos, showing the high level of match between theory and data, across the entire retina. Thus, the entire geometry of the NFL is largely captured in the two numbers A and B.
Table 1.
Results obtained using lattices
| Retina | Small lattice |
Full lattice |
||||||||
|---|---|---|---|---|---|---|---|---|---|---|
| No. of points | A | B | Average error | SD | No. of points | A | B | Average error | SD | |
| 1 | 60 | 0.423242 | 0.162582 | 4.14074 | 5.05319 | 119 | 0.411214 | 0.161444 | 4.28272 | 5.66423 |
| 2 | 58 | 0.370233 | 0.167545 | 5.30506 | 6.43933 | 104 | 0.403745 | 0.204174 | 5.38906 | 6.81427 |
| 3 | 47 | 0.284137 | 0.199591 | 6.53438 | 8.05032 | 85 | 0.265846 | 0.209064 | 6.67256 | 9.3845 |
| 4 | 24 | 0.293008 | 0.19678 | 3.57719 | 4.36549 | 47 | 0.359887 | 0.167871 | 5.00491 | 6.28568 |
| 5 | 43 | 0.316543 | 0.139539 | 6.02755 | 7.57477 | 86 | 0.324354 | 0.118986 | 6.76119 | 8.71252 |
| 6 | 46 | 0.300033 | 0.189754 | 7.68228 | 9.14232 | 84 | 0.326471 | 0.0283469 | 6.29658 | 8.53697 |
| 7 | 40 | 0.444294 | 0.168305 | 5.15198 | 5.51421 | 79 | 0.418245 | 0.210375 | 7.2928 | 9.88282 |
Discussion
Theoretical Model of the Nerve Fiber Layer (NFL).
We propose a theoretical model to explain why NFL axons course along the contour lines of the function Ψ = α − Aβ + By. We make full use of the theorist's privilege of making simplifying assumptions:
Morphogens are presumed to be confined to the retina with little leakage into vitreous or choroid.
Axons are assumed to grow after the morphogens have reached diffusional equilibrium.
Diffusion constants do not vary appreciably throughout the posterior retina (excluding the macula).
Competitive axon-axon interactions are excluded.
Retinal growth subsequent to formation of the NFL should be largely isotropic.
Mathematical models for biological systems are necessarily oversimplifications, but they can provide a conceptual framework to isolate important features of the system.
Axon guidance morphogens have been ably reviewed in refs. 9 and 10 and are too complex and varied to permit more than a very brief and incomplete listing here. Chondroitin sulfate proteoglycans, concentrated in a ring in the peripheral retina appear to direct axons toward the central retina (11). The axon guidance molecule, Netrin-1, an axon guidance molecule, draws axons toward the optic nerve head (12). The axon's response to netrins may be attractive or repulsive, depending on regulatory modulation of cAMP levels (13). Complementary ventral-dorsal gradients (corresponding to the mature nasal-temporal axis) of EphB and B ephrin have been identified with pathfinding errors in mutant mice (14). Macular ephrins appear to play a role in macular avoidance in primates (15). The common feature of these proposals is that the morphogens are generated in three anatomically distinctive regions—the retinal periphery, the optic disk and the perimacular area—and that morphogens influence axons in the remainder of the retina through their gradients. Our methods aim to describe the axon path under the influence of morphogens in diffusional equilibrium. Over a patch of actively secreting cells, morphogen activity need not be harmonic. Our approach is only likely to be useful in a region away from sources, sinks, and distinctive anatomic landmarks.
We intend to define a harmonic function, Φ, to represent morphogen activity, the positional information available to the pathfinding ganglion cell axon, which will move down the steepest gradient of Φ. Thus, the course of the nerve fiber will be the constant contour curves of Ψ, the harmonic conjugate of Φ. Take, then, a Euclidean plane and, as in the introduction, let N = (0, 0) to represent the source of morphogen at the nerve, while M = (1, 0) and represents a macular point source. Let dist(P, Q) represent the Euclidean distance from P to Q. A harmonic point source centered at some point Q will be given at point P = (x, y) by the natural logarithm ln(dist(Q, (x, y))). Thus, the potential function Φ at (x, y) is given by
where A is the ratio of strength between the nerve and macular factors, so that A is a real number between 0 and 1, and B is another real parameter. Φ is the real part of a complex holomorphic function whose imaginary part is the harmonic conjugate, Ψ = α − Aβ + By, where, as in the introduction, α is the angle at N between the x axis and the point P, and β is the corresponding angle at M (Fig. 1C). Thus, the equation of a nerve fiber assumes the empirically observed form, α − Aβ + By = Constant. Of course, this argument is only applicable in the portion of the retina where morphogen activity is assumed harmonic, away from sources and sinks. Therefore, we restrict the domain of the function Ψ to a region R that excludes the nerve, macula and periphery. R consists of all points within a sufficiently large circle about the origin from which we have excised a small circle about the origin, N and about the point M, so that R is topologically a “pair of pants” with its conformal structure. As noted in the introduction, this region R can be conformally identified with the relevant region of the globe of the eye. Region R represents the NFL, excluding only its boundary zones. R is, then, the domain within which we suppose the potential Φ to be harmonic. In effect, this is a Dirichlet potential problem: the harmonic function Φ is constructed from certain boundary values, and the contour lines of its harmonic conjugate, Ψ will represent the gradient lines of Φ.
Harmonic Fibrations in General.
It is natural to explore the more general fibrations that arise when we alter the distribution of morphogen sources and sinks, to achieve a better fit and to extend the theory to other tissues. The nerve fibers in the retinas of raptor birds, for example, which have 2 foveae (16), could provide a good test. Imagine, then, that we are given a sufficiently differentiable fibration of our region R. There is no local obstruction to constructing a (non-harmonic) potential with the same flow lines. Locally, the orthogonals to the fibration can simply be integrated to form a new fibration, crisscrossing the original fibration (this procedure requires Frobenius integrability in higher dimensions). However, suppose we are challenged to produce a harmonic function, Ψ, whose contour lines match the given fibration. There may not be any solution, even locally: There is a geometric criterion that must be met at each point to permit a harmonic Ψ to exist—the convergence–curvature criterion. Choose a point P on fiber p: the curvature of p at P is just the reciprocal of the distance to the center of an osculating circle at P. The convergence of nerve fibers at P is the dual concept: It is the curvature of the orthogonal fibration at P. More concretely, this is the reciprocal of the distance to the focal point of the tangents to the neighboring fibers near P. In general, the rate of change of the curvature at P with respect to distance along p and the rate of change of convergence at P with respect to distance orthogonal to p are independent quantities. The convergence–curvature criterion (17,18) characterizes fibrations, which can be contour lines of a harmonic function. Such fibrations must have the rate of change of curvature equal to the rate of change of curvature at all points. No matter how one rearranges sources and sinks on the boundary, a harmonic function Ψ exists whose contours fit a given fibration only if this criterion holds; and, if it holds, a harmonic potential Φ exists whose gradient lines match the given fibration. The close match between the NFL and contour lines of a harmonic function Ψ, thus supports the notion that morphogen gradients direct the axonal growth cone.
Let us rearrange the macular sources. Our unbalanced dipole model for the NFL postulates two point sources where the potential goes to infinity, rather than patches of cell of finite potency. Although it achieves a serviceable model of the geometry of the NFL (Figs. 2–4) in most of the retina, there remains an area of significant mismatch—the area along the horizontal raphe. Here, the theoretical curves converge abruptly to one point. This suggests an alternate model in which the macular morphogen is spread along a streak—a line segment inside the raphe itself, starting at the macula. This fits with anatomic studies of ganglion cell distribution (19), which demonstrate a (weakly developed) horizontal visual streak in humans.
There will now be 3 parameters: s, the length of the segment; N, the relative strength of the streak morphogen; and C, the strength of a peripheral linear influence. Table 2 lists the results. C is quite negligible in this model, and we also list the results obtained without it. Fig. 5 gives a direct comparison of dipole and streak fibrations along the raphe. The two fibrations are asymptotic to each other away from the macula. There are a limitless variety of ever more elaborate harmonic functions one could try, but, as the number of parameters increases, they very quickly become computationally intractable, because the minimization heuristics tend to settle onto some poor, local minimum.
Table 2.
Results obtained using streak potential
| Retina | Three parameters |
Two parameters |
||||||
|---|---|---|---|---|---|---|---|---|
| s | N | C | Average error | SD | s | N | SD | |
| 1 | 0.157431 | 0.0287084 | 0.0561713 | 4.76315 | 8.7235 | 0.662493 | 0.191754 | 7.03905 |
| 2 | 0.20453 | 0.0339747 | −0.0196832 | 5.44287 | 6.79209 | 0.190373 | 0.0315248 | 6.83872 |
| 3 | 0.141787 | 0.0207482 | 0.0402631 | 6.26221 | 8.2866 | 0.712595 | 0.261441 | 7.92739 |
| 4 | 0.190474 | 0.0241281 | 0.0434665 | 3.62989 | 4.40486 | 0.165013 | 0.0209564 | 4.45705 |
| 5 | 0.317392 | 0.0534396 | −0.0337039 | 6.88943 | 8.72147 | 0.320571 | 0.0539411 | 9.23552 |
| 6 | 0.283246 | 0.044248 | −0.0175917 | 7.0697 | 9.20465 | 0.282179 | 0.0440084 | 9.31997 |
| 7 | 0.44738 | 0.0856236 | −0.026801 | 8.19416 | 10.1714 | 0.445664 | 0.0855395 | 10.5617 |
Fig. 5.
Magnified view of the raphe area of Retina7 with overlays comparing the streak fibration in the upper half with the dipole fibration in the lower half.
Prospects.
We consider the fibration equation, α − Aβ + By = Constant, a serviceable description of the NFL geometry. The parameters A and B condense a great deal of information about where retinal nerve fibers enter the optic nerve head. There are significant diseases of the human optic nerve head, such as anterior ischemic optic neuropathy and glaucoma. Even quite crude anatomic measures of nerve head structure have been shown to influence susceptibility to these diseases (20). Larger values of the A parameter would lead to a greater crowding of nerve fibers at the optic disk poles, which are areas of high susceptibility to glaucomatous damage. A better understanding of the guidance mechanisms in the NFL would advance the understanding of instances of failed guidance, leading to optic nerve hypolasia (21). The correlation of A and B with optic nerve head diseases should be investigated.
Supplementary Material
Acknowledgments.
We thank Gerard Berry, John Flynn, Max Forbes, Ira Snow Jones, and Nurit Kalderon for helpful discussions and R. Theodore Smith for much enlightenment shed upon confused issues, time after time. Support provided by Research to Prevent Blindness.
Footnotes
The authors declare no conflict of interest.
This article is a PNAS Direct Submission.
This article contains supporting information online at www.pnas.org/cgi/content/full/0801621105/DCSupplemental.
References
- 1.Vogt A. Die Nervenfaserstreifung der menschlichen Netzhaut mit besonderer Berücksichtigung der Differentialdiagnose gegenüber pathologischen streifenförmigen Reflexen (präretinalen Fältelungen) Klin Monatsbl Augenheilkd. 1917;58:399–411. [Google Scholar]
- 2.Behrendt T, Wilson LA. Spectral reflectance photography of the retina. Am J Ophthal. 1965;59:1079–1088. [PubMed] [Google Scholar]
- 3.Airaksinen PJ, Nieminen H, Mustonen E. Retinal nerve fiber layer photography with a wide angle fundus camera. Acta Ophthal. 1982;60:362–368. doi: 10.1111/j.1755-3768.1982.tb03026.x. [DOI] [PubMed] [Google Scholar]
- 4.Crick F. Diffusion in embryogenesis. Nature. 1970;225:420–422. doi: 10.1038/225420a0. [DOI] [PubMed] [Google Scholar]
- 5.Ramon y, Cajal S. La rétine des vertébrés. 1892;9:119. Available at http://web2.bium.univ-paris5.fr/livanc/?cote=ryc007&do=chapitre. [Google Scholar]
- 6.Gosse NJ, Nevin LM, Baier H. Retinotopic order in the absence of axon competition. Nature. 2008;452:892–895. doi: 10.1038/nature06816. [DOI] [PMC free article] [PubMed] [Google Scholar]
- 7.Hendrickson A, Provis J. Comparison of development of the primate Fovea centralis with peripheral retina. In: Sernagor E, Eglen S, Harris B, Wong R, editors. Retinal Development. Cambridge, UK: Cambridge Univ Press; 2006. pp. 126–149. [Google Scholar]
- 8.Springer A, Hendrickson AE. Development of the primate area of high acuity. 2. Quantitative morphological changes associated with retinal and pars plana growth. Vis Neurosci. 2005;21:775–790. doi: 10.1017/S0952523804215115. [DOI] [PubMed] [Google Scholar]
- 9.Tessier-Lavigne M, Goodman CS. The molecular biology of axon guidance. Science. 1996;774:1123–1133. doi: 10.1126/science.274.5290.1123. [DOI] [PubMed] [Google Scholar]
- 10.Brittis PA, Silver J. Multiple factors govern intra-retinal axon guidance: A time-lapse study. Mol Cell Neurosci. 1995;6:413–442. doi: 10.1006/mcne.1995.1031. [DOI] [PubMed] [Google Scholar]
- 11.Sretavan DW. Optic nerve formation. In: Sernagor E, Eglen S, Harris B, Wong R, editors. Retinal Development. Cambridge, UK: Cambridge Univ Press; 2006. pp. 150–172. [Google Scholar]
- 12.Deiner MS, et al. Netrin-1 and DCC mediate axon guidance locally at the optic disc: Loss of function leads to optic nerve hypoplasia. Neuron. 1997;19:575–589. doi: 10.1016/s0896-6273(00)80373-6. [DOI] [PubMed] [Google Scholar]
- 13.Shewan D, Dwivedy A, Anderson R, Holt CE. Age-related changes underlie switch in netrin-1 responsiveness as growth cones advance along visual pathway. Nat Neurosci. 2002;5:955–962. doi: 10.1038/nn919. [DOI] [PubMed] [Google Scholar]
- 14.Birgbauer E, Oster SF, Severin CG, Sretavan DW. Retinal axon growth cones respond to EphB extracellular domains as inhibitory axon guidance cues. Development. 2001;128:3041–3048. doi: 10.1242/dev.128.15.3041. [DOI] [PubMed] [Google Scholar]
- 15.Kullander K, Klein R. Mechanisms and functions of Eph and ephrin signaling. Nat Rev Mol Cell Biol. 2002;3:475–486. doi: 10.1038/nrm856. [DOI] [PubMed] [Google Scholar]
- 16.Tucker VA. The deep fovea, sideways vision and spiral flight in raptors. J Experimental Biol. 2000;203:3745–3754. doi: 10.1242/jeb.203.24.3745. [DOI] [PubMed] [Google Scholar]
- 17.Bivens I. When do orthogonal families of curves possess a complex potential? Math Mag. 1992;65(4):226–235. [Google Scholar]
- 18.Needham T. Visual Complex Analysis. Oxford: Oxford Univ Press; 1997. pp. 520–526. [Google Scholar]
- 19.Stone J, Johnston E. The topography of primate retina: A study of human, bushbaby, and new- and old-world monkeys. J Comp Neurol. 1981;196:205–223. doi: 10.1002/cne.901960204. [DOI] [PubMed] [Google Scholar]
- 20.Doro S, Lessell S. Cup-disc ratio and ischemic optic neuropathy. Arch Ophthal. 1985;103:1143–1144. doi: 10.1001/archopht.1985.01050080055019. [DOI] [PubMed] [Google Scholar]
- 21.Kim RY, Hoyt WF, Lessell S, Narahara MH. Superior segmental optic nerve hypoplasia. A sign of maternal diabetes. Arch Ophthal. 1989;107:1312–1315. doi: 10.1001/archopht.1989.01070020382040. [DOI] [PubMed] [Google Scholar]
Associated Data
This section collects any data citations, data availability statements, or supplementary materials included in this article.


