

Abstract
Purpose
To clarify if large numbers of wide dynamic range compression channels provide advantages for vowel identification and to measure its acoustic effects.
Methods
Eight vowels produced by 12 talkers in the /hVd/ context were compressed using 1, 2, 4, 8, and 16 channels. Formant contrast indices (mean formant peak minus mean formant trough; maximum formant peak minus minimum formant trough) were developed to quantify spectral changes. Twenty listeners with mild to moderately severe sensorineural hearing loss identified the compressed vowels in an 8-alternative forced-choice procedure.
Results
Formant contrast measures revealed significant spectral flattening for 6 of the 8 vowels as channel number increased. A significant decrease in vowel identification performance was also observed as spectral contrast decreased.
Conclusions
Increasing the number of wide dynamic range compression channels may not be beneficial for all speech signals, and individual vowel identification performance can vary greatly for listeners with similar hearing loss.
Keywords: multichannel hearing aids, vowel perception, WDRC
It has been more than 40 years since initial applications of multiple compression channels (MCC) were implemented in hearing aids (Caraway & Carhart, 1967); however, the appropriate number of channels remains an unanswered question. The rationale for splitting the audible frequency range into independent channels was to apply processing schemes such as amplitude compression (also referred to as wide dynamic range compression or WDRC) in specific frequency regions. Several studies have reported no speech recognition decrements with MCC processing with 2 to 4 channels (Barfod, 1978; Moore & Glasberg, 1986; Moore, Laurence, & Wright, 1985; Villchur, 1973; Yanick & Drucker, 1976). A single, often cited study demonstrated improvement in speech recognition in listeners with hearing impairment from 4 to 8 channels, with no further change from 8 to 16 channels (Yund & Buckles, 1995). Conversely, other studies have shown that either linear or single-channel wideband compression is superior to MCC processing (Abramovitz, 1980; Bustamante & Braida, 1987; Caraway & Carhart, 1967; Lippmann, Braida, & Durlach, 1981; I. V. Nabelek, 1983; van Buuren, Festen, & Houtgast, 1999; van Harten-de Bruijn, van Kreveld-Bos, Dreschler, & Verschuure, 1997; Walker, Byrne, & Dillon, 1984).
One explanation for a decrement in speech recognition performance after MCC processing was proposed by Plomp (1988). Plomp postulated that spectral contrasts would not be well preserved for multiple channels and high compression ratios, such that in a hypothetical situation of extremely high compression ratios with large number of channels, the output would be stationary without any structure. Other investigators have commented on the negative aspects of amplitude compression, and although not addressing channel number per se, similar decrements have been observed to those proposed by Plomp (1988): spectral shape alterations (Bustamante & Braida, 1987; De Gennaro, Braida, & Durlach, 1986; Lippmann, Braida, & Durlach, 1981), channel interactions (Walker et al., 1984), and channel summation effects (Kuk & Ludvigsen, 2003).
Vowels, which are identified primarily by their spectral shape and specific formant frequencies (Ito, Tsuchida, & Yano, 2001; Molis, 2005; Zahorian & Jagharghi, 1993), may be most susceptible to these effects. Vowel recognition has not been extensively studied in the context of current signal processing strategies, perhaps because these higher intensity sounds were traditionally considered less susceptible to changes in signal audibility with hearing loss. Nonetheless, listeners with hearing impairment show difficulties resolving cues necessary for vowel perception (Turner & Henn, 1989). Listeners with hearing impairment also have more difficulty processing changes in spectral shape and maintaining an internal representation of spectral peak to valley contrasts (Leek, Dorman, & Summerfield, 1987; Leek & Summers, 1996) and need larger spectral peaks compared to normalhearing listeners (Turner & Holte, 1987). Other investigators have noted the inability of an impaired auditory system to separate closely spaced formant peaks, which could be quite detrimental if combined with an already spectrally flattened vowel spectra (A. K. Nabelek, 1988; Richie, Kewley-Port, & Coughlin, 2003).
There are few data on vowel output of multichannel WDRC devices. Franck, Sidonne, van Kreveld-Bos, Dreschler, & Verschuure (1999) reported that an 8-channel compressor negated the benefits of spectral enhancement for vowel identification. Crain and Yund (1995) reported vowel errors after multichannel compression. They found the greatest amount of confusion between the following three pairs: /I - Ʊ, I -  , Ʊ -
, Ʊ -  /, suggesting that alteration of vowel formants may have played a role. However, in the absence of acoustic analysis, the reason for the errors is unclear. For example, vowel errors can result from inadequate audibility as well as changes to vowel spectra. Additionally, all of those studies measured recognition of vowels in the context of a consonant—vowel or consonant—vowel—consonant nonsense syllable, making it difficult to separate effects of vowel spectra change from processing effects on other speech cues, such as consonant—vowel ratio or consonant transition.
To date, there is no method of quantifying the amount of spectral flattening of vowels after multichannel compression. A new method of calculating changes in peak-to-trough amplitudes as a function of the number of compression channels will be described, with particular attention to the point at which increasing number of compression channels causes acoustically significant degradation. Our hypothesis was that increasing channel number would result in reduced spectral contrast (i.e., spectral flattening) and that this spectral flattening would be associated with poorer vowel identification.
Method
Participants
Twenty adults ages 46–85 years (M = 70 years) with mild sloping to moderately severe sensorineural hearing loss participated in this study. Sensorineural hearing loss was defined as thresholds with no air—bone gaps greater than 10 dB from 500 Hz through 4000 Hz. All participants had normal middle ear function as determined by tympanometry testing (Wiley et al., 1996). Participants were tested monaurally. Fourteen of the participants had symmetrical hearing loss, and the ear tested was chosen randomly. The remaining 6 participants were tested in the ear that had thresholds closest to the target audiometric criteria of gradually sloping, mild to moderate loss. Mean audiograms for the test ears are shown as the filled circles in Figure 1. Cognitive status was screened using the Mini-Mental State Exam (Folstein, Folstein, & McHugh, 1975), with inclusion criteria of a score of 26 or higher. The range of scores for all participants on the Mini-Mental screen ranged from 27 to the maximum 30 points (M = 28.78). Sixteen of the 20 participants were born and raised in the Pacific Northwest (i.e., Washington, Oregon, or Idaho), and standard American English was their first and primary language. The four remaining participants were born and/or raised in the following states: North Dakota, Minnesota, New York, Illinois, Kansas, and Michigan, and were also monolingual English speakers. All participants were reimbursed for their time.
Figure 1.
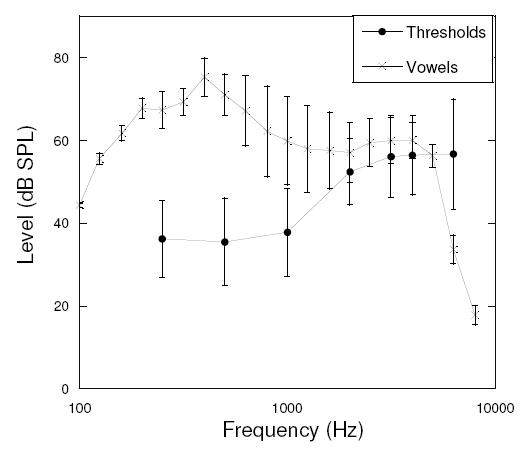
Mean vowel levels plotted with thresholds of all participants (dB SPL). Error bars show ±1 SD of the mean.
Stimuli
Eight vowels (/i, I, e, ε,  , æ, Ʊ, u/) spoken by 6 adult male and 6 adult female talkers were recorded. None of the talkers had any history of speech therapy; all had normal hearing and were also native to the Pacific Northwest region. This linguistic background criterion was a purposeful constraint in order to control for regional dialects between the stimuli and the target group of hearing-impaired participants (Wright, Bor, & Souza, 2006). All vowels except for /
 / and /e/ were read in the /hVd/ context (Hillenbrand, Getty, Clark, & Wheeler, 1995) from a word list. The vowels /
 / and /e/ were spoken without the preceding /h/ (odd and aid) due to unfamiliarity of the words hawed and hayed. The eight words in this list were randomized and repeated five times to control for list effects on pronunciation, thus removing the need for a carrier phrase. All talkers were instructed to read the list of words at a natural pace and vocal intensity. Vocal level was monitored via a VU meter to ensure sufficient output levels without clipping. Tucker-Davis Technologies System 2 with an AP2 sound card and a Shure BG 1.0 omni-directional microphone were utilized for all the recordings. Four talkers were recorded direct-to-disc at a rate of 44.1 kHz. The remaining 8 talkers were recorded at a rate of 22.05 kHz. All recordings were quantized at 16 bits and down-sampled to 11.025 kHz prior to signal processing and acoustic analysis.
One representative token of each vowel was selected for each talker based on two criteria: (a) recording fidelity and clarity of each participant’s voice without hoarseness, pitch breaks, and so forth, and (b) visual inspection of spectrograms with accompanying linear predictive coding (LPC) formant and pitch track with a narrowband spectrogram to ensure formant and pitch steady states at the vowel midpoint. A formant was considered to be steady state if a straight line could be traced and the pitch remained constant at the midpoint. Pitch was determined using a narrowband spectrogram with a 200-ms window, and the pitch track was estimated using autocorrelation with a 25-s window.
After selection of the final 96 vowels (12 talkers × 8 vowels) and the compression processing described below, the duration of each vowel was chosen based on the lowest common denominator—that is, the shortest steady state, from the entire set, which was 150 ms. The selection of 150 ms removed any formant transitions or consonantal influence from the spoken /h/ and /d/ from the recordings. This control was to deliberately remove the cues that vowel duration provides in identification (House, 1961).
Amplification
All /hVd/ tokens were digitally filtered into 1, 2, 4, 8, or 16 channels. The channels were created via 5-pole, Butterworth one-third-octave band filters. In the 16-channel condition, each channel was a one-third-octave band; the lower to upper range across all channels was set at 141 Hz and 5623 Hz respectively. All other channel conditions were evenly divided combinations of one-third-octave band filters.
Prior to the final summation of all channels, each filter output was independently compressed using compression simulation software (Armstrong, 1997). Although the variable of interest was the number of channels versus the amplification effect per se, the compression parameters selected in all channel conditions were chosen to be representative of amplification settings utilized in clinical settings. Compression ratio was set at 3:1 for all channels, which is about the upper end of what would be prescribed for listeners with similar amounts of loss when using prescriptive programs. This parameter was chosen such that this variable would be uniform across the frequency range. All vowel tokens were digitally adjusted to represent an input level of 75 dB SPL prior to compression. Compression threshold was set at 45 dB SPL, and attack and release times set at 3 ms and 50 ms, respectively, for all channels. All filtered and compressed channels were summed together using waveform processing software for the final output. With the exception of the number of channels, all parameters were held constant across all test conditions. Note that any effects of attack and release time were inconsequential for all vowels, given that a steady-state 150-ms section of each vowel was selected after compression of the entire /hVd/ syllable. To avoid the introduction of a “click” transient, a 5-ms linear amplitude ramp was applied to the onset and offset of each stimulus.
No frequency shaping was applied to the stimuli in this experiment. Frequency shaping was not needed, as the overall SPL levels were controlled; individual prescribed gain was deliberately excluded as an additional variable. All vowels were equated across conditions, and channel conditions were equalized at 94 dB SPL (the intensity level chosen after calibrating all channel conditions following compression) by adding the appropriate gain to each condition during testing. Additional random attenuation of 0, 1, or 2 dB was also provided via a TDT Programmable Attenuator (PA5) to prevent intensity biases. Figure 1 shows the vowel levels relative to participant thresholds. Although intensity levels above 3500 Hz were not audible for all participants, the essential frequency range for the first and second formant frequencies were audible. A closer examination of Figure 1 indicates a slight overlap of threshold and vowel levels from 2000 through 4000 Hz. Additional analyses regarding audibility of the vowel stimuli are discussed below.
Acoustic Analysis
The following formant frequency analysis was repeated three times throughout each vowel: at the beginning, middle, and end, to ensure that there were no changes to the steadiness or formant transitions through the duration of the vowel. Formant frequency values were taken from the middle of the steady-state vowel. All frequency centers of formant peaks and troughs between Formants 1 through 4 (F1, F2, F3, F4) were estimated from the LPC spectrum of the uncompressed speech signal. Frequency centers of troughs were defined as the lowest points between two peaks. If a trough could not be specified as the lowest point due to formant peaks lying very close to each other (e.g., F2 and F3 for /e/ are very close to each other for female talkers), the point that fell along the flattest portion of the curve (slope of zero) would be labeled as the trough. Each LPC was overlaid on a fast Fourier transform (FFT) power spectrum with a sample window of 128 points and each visually compared to its own broadband spectrogram to ensure there were no errors in the LPC spectrum. In the event that there were LPC errors for a particular talker, the number of coefficients (poles) were adjusted up or down for that entire talker’s measures. The sample window of the LPC was 25 ms, and the number of coefficients ranged between 10 and 12 depending on the talker. Each talker’s uncompressed LPC spectrum served as their own template for all of the following measurements in the analysis of multiple compression channels. All estimated male and female talkers’ formant peaks were within the range of published formant-frequency values (Kent & Read, 1992). See Figure 2 for the average F1 × F2 plot for both male and female talkers.
Figure 2.
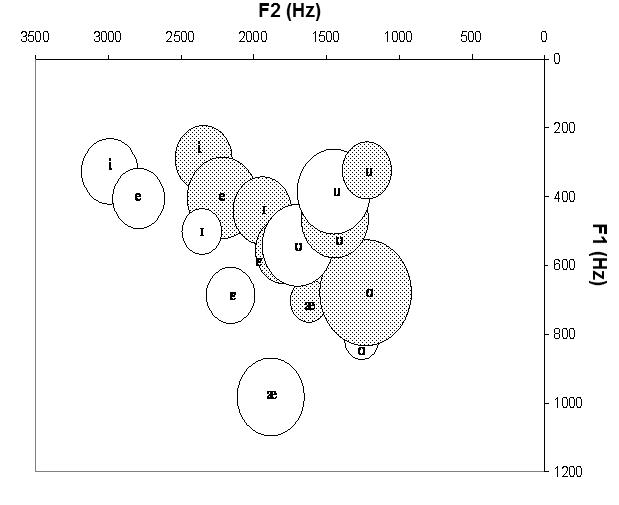
Mean F1 and F2 frequencies of all original, unprocessed, and unfiltered vowel stimuli. Diameter of each circle represents ±2 standard errors. Open circles indicate female talkers; filled circles indicate male talkers.
Measure of Spectral Flattening
A formant contrast measure was derived from the FFT analysis and was calculated for F1 and F2 for each vowel and talker. Only the first two formants were considered, because these are the most important cues for vowel identification (Kewley-Port & Watson, 1994; Liu & Kewley-Port, 2004). Formant contrast was defined as the difference between a spectral peak and the trough immediately following the peak. This was calculated in two ways: mean peak minus mean trough and maximum peak minus minimum trough. The mean peak and mean trough were found by averaging all the FFT points within a 550-ms window, with the LPC frequency as the center point of the window (275 ms before and after the frequency center point). This comparison of means eliminated the problem of an exact peak or trough location due to fluctuating amplitudes throughout an FFT spectrum. Maximum peak and minimum trough were found by taking the highest sample point in amplitude at the particular formant and the lowest sample point in amplitude at a formant trough. These two methods of measuring formant contrast are depicted in Figure 3. The resulting spectral contrast value was
where p is the spectral peak and t is the spectral trough corresponding to the specific formant frequency.
Figure 3.
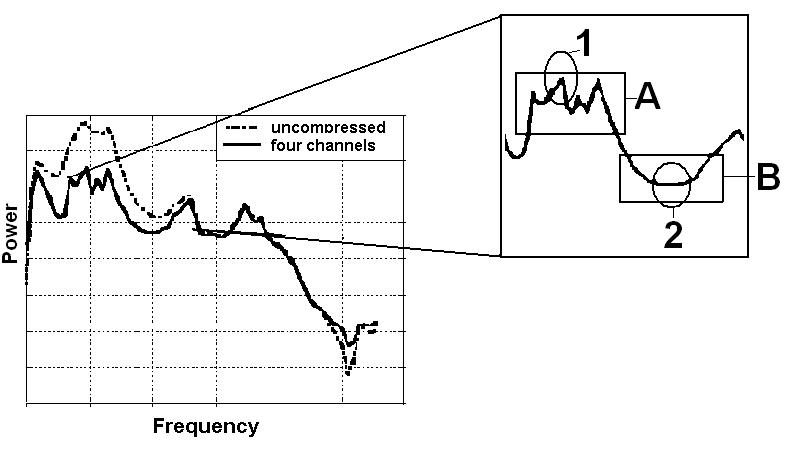
Mean peak = mean of sample points in box A; mean trough = mean of sample points in box B; maximum peak = sample point in circle 1; minimum trough = sample point in circle 2.
Vowel Identification
Participants were seated in a double-walled sound booth and completed a training task at least twice (until performance was at least 88% correct) to familiarize them with the orthography of each of the vowel sounds. This orientation task consisted of using a touch screen to match the orthographic representation of the vowel sound to a set of three words that had the same vowel sound. No auditory input of the vowels was presented. Online feedback was provided only during the training sessions.
An eight alternative forced-choice identification procedure was applied in this experiment. Stimuli were presented to the first 14 participants via Sennheiser HD-25 SP1 headphones; the remaining 6 participants used insert ER2 earphones. Participants identified the vowel stimuli by pressing the touch-screen button that included the orthographic representation of the vowel and the three example words from the training session.
A single block consisted of randomly ordered presentations of each vowel from each talker (total of 96 tokens). Four blocks were completed for each channel condition for a total of 384 presentations per condition. The order of the five channel conditions was randomized across two or three 2-hr visits for each participant. To prevent response bias, the locations of the vowel response buttons on the touch screen were randomized per channel condition. Confusion matrices were also generated for each participant.
Results
Acoustic Analysis
Figure 4 illustrates the uncompressed FFT spectrums against each of the compressed conditions for two exemplars. A large effect of channel number is seen for the low-back vowel / /, but not as much for the high-front vowel /ε/. The effect of increasing number of channels for each vowel is summarized in Figures 5 and 6 for the mean and maximum/minimum contrasts, respectively. Recall that the spectral contrast value for a single vowel/talker/channel condition was obtained by
where p is the spectral peak and t is the spectral trough corresponding to the specific formant frequency. Figure 5 depicts the mean peak and trough differences, and Figure 6 depicts the maximum peak and minimum trough difference for all vowels. The overall spectral contrast gradually decreased as the number of compression channels increased. The same downward trend occurred in both figures. Both measures of formant contrast are similar as shown by these plots.
Figure 4.
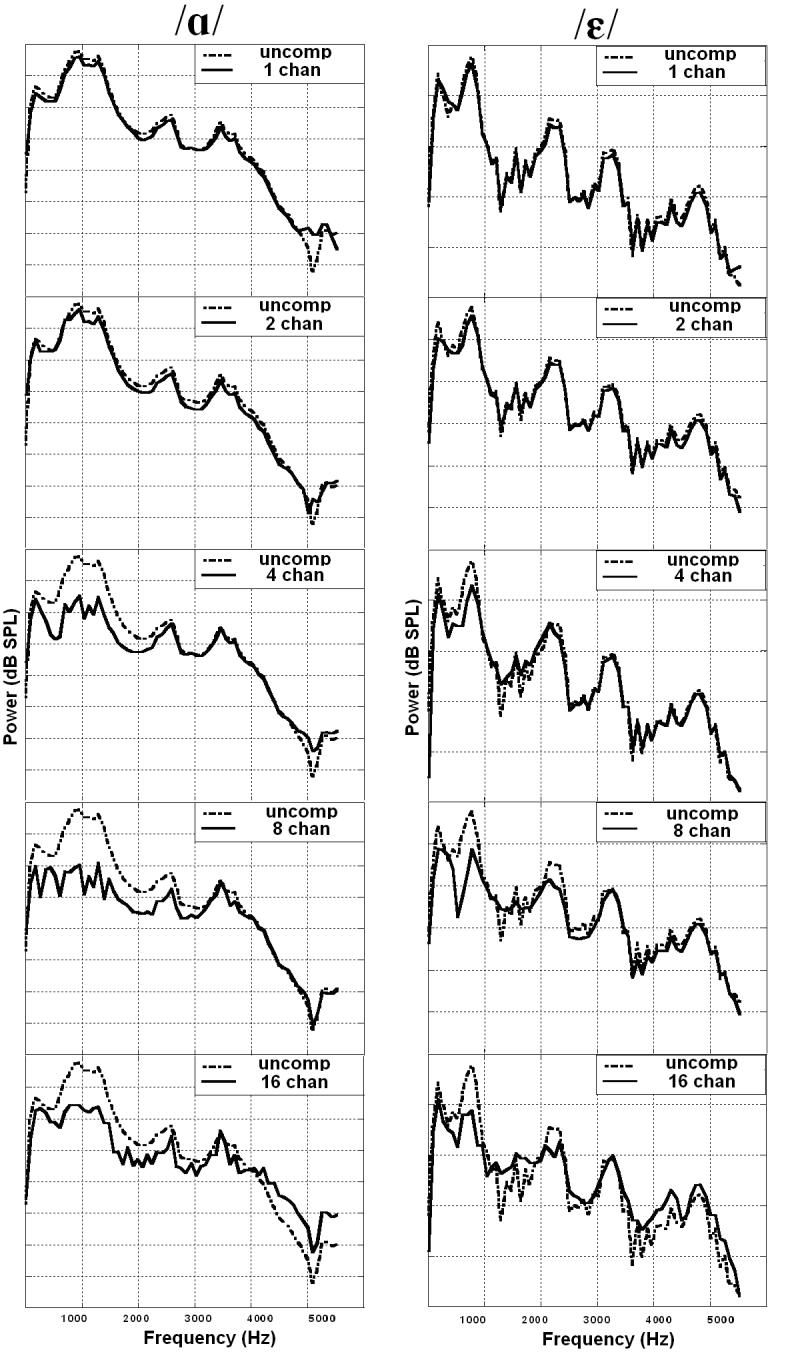
FFT curves for a female / / and /ε/ across channels. uncomp = uncompressed. chan = channels.
Figure 5.
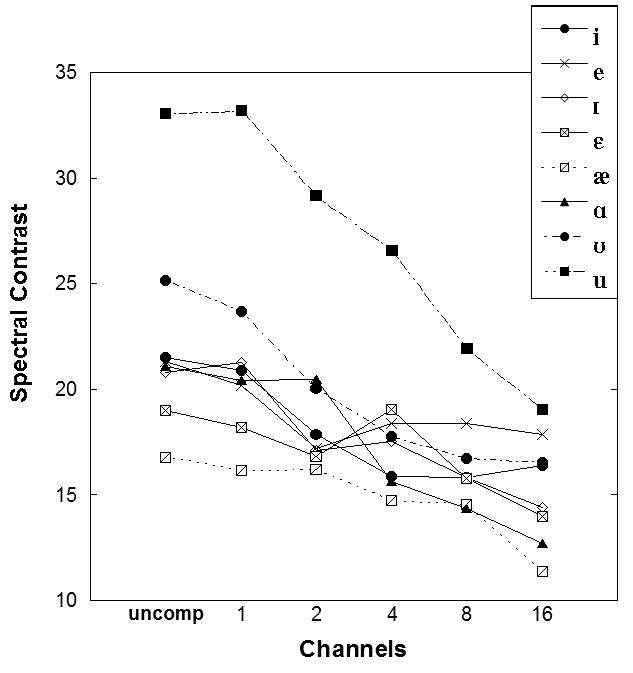
Spectral contrast measure (mean peaks minus mean troughs) for all vowels and talkers across channel condition.
Figure 6.

Spectral contrast measure (maximum peaks minus minimum troughs) for all vowels and talkers across channel condition.
Statistical analysis was completed using repeated measures analysis of variance (ANOVA). Independent variables were vowels and channels. Two separate analyses were completed, one for the formant contrast measure (mean peak minus mean trough) and another for the formant contrast (maximum peak minus minimum trough). Speaker gender was initially entered into each model as an independent variable. Because no significant effects were observed for gender of the talker for any measure (formant contrast mean peak minus mean trough, F(5, 170) = 1.04, p = .362, and formant contrast maximum peak minus minimum trough, F(5, 170) = 1.63, p = .198, the remaining results include all talkers grouped together.
A significant interaction was seen for the Number of Channels × Vowel for both formant contrast measures: mean peak minus mean trough, F(35, 1225) = 2.71, p < .0005, and maximum peak minus minimum trough, F(35, 1225) = 2.97, p < .0005. Post hoc examination for each individual vowel was completed using repeated-measures ANOVA. A Bonferroni correction value of p < .00625 (.05 divided by 8 vowels) was applied. The number of compression channels were significant for all vowels (p < .0005) except for /e/ and /ε/ for both mean peak minus mean trough and maximum peak minus minimum trough.
Post hoc analyses were completed to determine the significance level of spectral change between the numbers of compression channels. t tests with a Bonferroni-corrected p value (p < .01) indicated a trend across four out of the six vowels (i.e., /i/, /I /, /Ʊ/, /u/) for a significant spectral change between one-channel and two-channel compression.
Vowel Identification
Statistical analysis using a test of repeated measures ANOVA was applied for the independent variables of block number (four per channel condition) and channels. A significant learning effect was observed across the four runs, F(3, 57) = 10.74, p < .0005. Channel number was also a significant effect, F(5, 95) = 21.00, p < .0005, but there was no statistical interaction between the two variables. Bonferroni-corrected means comparisons were used to determine where learning occurred. Improvements were observed between blocks 1 and 2 in the 1-, 2-, and 8-channel conditions (p < .01 in each case) and between blocks 3 and 4 in the 1-channel condition. Blocks 1 and 2 were typically completed during each participant’s first visit, and Blocks 3 and 4 were completed during the second visit. Thus, although a significant amount of learning occurred for some participants at least once during each visit, there was no systematic pattern. Accordingly, scores were collapsed across the four test blocks for each condition and participant. The overall results are plotted in Figure 7. The trend was for poorer performance as channel number increased. Channel number was entered as the independent variable and performance in percentage correct entered as the dependent variable in the statistical analysis. As reported above, channel number was a statistically significant effect, F(5, 95) = 21.00, p <.0005. Post hoc analysis indicated a marginally significant improvement between 1 and 2 channels, t = -2.60, df = 19, p = .018 (Bonferroni-corrected p= .01). Significant decrements were observed between 2 and 4 channels, t = 4.65, df =19, p < .0005, and 8 and 16 channels, t = 10.59, df = 19, p < .0005. A confusion matrix describing the overall vowel errors is shown in Table 1.
Figure 7.
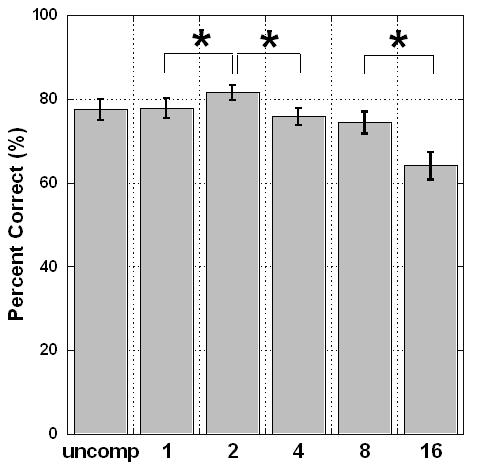
Mean vowel identification scores as a function of channel number. Asterisks indicate a significant change.
Table 1.
Confusion matrix for all participants across all channels.
| Vowel response | Vowel stimuli |
|||||||
|---|---|---|---|---|---|---|---|---|
| i | e | I | ε | æ | Ʊ | u | ||
| i | 4,830 | 680 | 45 | 9 | 3 | 0 | 10 | 237 |
| e | 103 | 3,698 | 234 | 147 | 48 | 15 | 28 | 15 |
| I | 316 | 636 | 4,260 | 376 | 25 | 8 | 419 | 82 |
| ε | 91 | 310 | 796 | 4,599 | 1196 | 197 | 401 | 38 |
| æ | 7 | 104 | 21 | 409 | 3,906 | 717 | 22 | 12 |
| 5 | 7 | 8 | 66 | 530 | 4,541 | 33 | 19 | |
| Ʊ | 182 | 208 | 350 | 153 | 50 | 277 | 4,744 | 1268 |
| u | 226 | 117 | 46 | 1 | 2 | 5 | 103 | 4,089 |
| % correct | 84 | 64 | 74 | 80 | 68 | 79 | 82 | 71 |
Note. Bolded values along the diagonal indicate correct responses.
Figure 1 indicates the possibility that for some vowels, F2 may not have been audible to all participants. When individual audiograms were qualitatively compared to vowel spectra, data for only a few vowels for 2 participants were of concern. To ensure that results across the participant group were not confounded by audibility, we devised a simple audibility measure by measuring F2 level (in dB SPL) relative to the participant’s threshold in that frequency region. F2 was used rather than F1, as inspection of individual audiograms versus vowel spectra for this group, with normal or near-normal low-frequency hearing, raised no concerns about F1 audibility. The F2 minus threshold audibility value was entered as a covariate in a regression analysis, and results indicated that audibility was not a significant predictor of performance: R2 = .005, F(3, 956) = 1.53, p = .205. Admittedly, this brief measure cannot characterize audibility of every aspect of the vowel, but it is reassuring evidence that no overall confound of vowel audibility occurred.
Relationship Between Spectral Contrast and Vowel Identification
Recall that our working hypothesis was poorer vowel identification with decreasing spectral contrast. Because the results of the acoustic analysis indicated that some vowels were affected more than others, each vowel was analyzed separately. Figure 8 shows this relationship for each of the eight vowels. One-way ANOVAs confirmed that decreasing spectral contrast resulted in poorer identification scores for the majority of the vowels: /e/ (p = .025), /I/ (p = .009), /æ/ (p = .045), / / (p = .010), /u/ (p = .035) and borderline significant for /i/ (p = .064). This effect was not significant for /ε/ (p = .270) or /Ʊ/ (p = .190).
Figure 8.

Performance for each individual vowel by spectral contrast value. Error bars indicate ±2 standard errors of the mean. Note that there are only 5 spectral contrast values for /u/—twice as many data points averaged at 33.19.
Does the spectral contrast measure provide useful information beyond number of compression channels? Although related, spectral contrast was not precisely dictated by channel number. Correlations between the spectral contrast and number of channels ranged from r = -.53 for /e/ to r = -.98 for /æ/.
Finally, although the study parameters were strictly controlled and hence not generalizable to all hearing aid fittings, it was of clinical interest to determine how many channels could be used without detrimental effects on vowel identification. Accordingly, post hoc means comparisons were conducted on the data shown in Figure 8 and considering only vowels where decreasing spectral contrast had a significant effect. In each case, there was a significant decrease in performance (Fisher’s least significant difference, p < .05) for the lowest spectral contrast. Expressed as number of compression channels, this usually occurred between 8 and 16 channels.
Discussion
Channel Number Versus Spectral Contrast
Multichannel compression significantly altered vowel spectrum by changing the formant peak-to-trough ratios, with the most dramatic effect for large numbers of compression channels. These amplitude changes were observed for almost all vowels chosen in this study: high front, high back, low back, and low front. The mid-front vowels (i.e., /e, ε/) were the only vowels that did not display any significant change after amplitude compression. Although the effect of channel numbers on vowel performance was not a startling effect, the interaction between channel number and vowel for spectral contrast measures was unexpected. This was first observed in the acoustic analysis, which suggested that spectral contrast may be a better descriptor of the spectral changes in each vowel, rather than simply the gross channel number. In other words, the amount of spectral flattening in each vowel is more clearly expressed by the proposed spectral contrast measure.
Spectral Contrast Measure and Vowel Errors
The present study also demonstrated that vowels with greater reduction of formant contrast were, in most cases, more difficult to identify. The greatest decrease in performance occurred at the lowest spectral contrast conditions (between 8 and 16 channels). These results also suggest that Crain and Yund’s (1995) findings of poorer performance in hearing-impaired listeners at 8 channels (no frequency shaping) combined with higher compression ratios are likely driven by changes to vowel spectra.
The point of spectral contrast reduction at which performance begins to drop is probably related to the hearing-impaired listeners’ ability to extract the formant peak from the background “noise” (i.e., spectral valleys). Dreisbach, Leek, and Lentz (2005) found that listeners with hearing impairment needed greater spectral contrast as frequency increased, particularly in the F2 and F3 frequency regions. Their listeners with hearing impairment needed spectral peaks relative to the background to be 4–19 dB higher than listeners with normal hearing. This may also vary across individuals, as in the current study: one listener dropped only 6% in performance for the vowel /i/ from 1 to 16 channels, whereas another listener dropped 38% for the same vowel.
This detrimental effect not only varied by individual but again across vowels, with the largest overall effects for /e/ and fewest errors with /i/ and /Ʊ/. Many of the confusions that occurred were between vowels that had overlapping first and second formant frequencies in the unprocessed and unfiltered condition (see Figure 2 for a F1 × F2 vowel diagram of the stimuli and Table 1 for the confusion matrix). This agrees with previous data that vowel identification errors occur for vowels that have similar spectral content (Kewley-Port & Watson, 1994; Kewley-Port & Zheng, 1999; Pickett, 1957). However, results also indicated confusions between vowels that were less similar in terms of their F1 and F2: /u/ - /i/ and /Ʊ/-/I /. Hedrick and Nabelek (2004) reported the lowering of F2 intensity in degraded listening conditions caused /u/ to be perceived more as /i/ by listeners with hearing loss. The noise-masked vowel in their experiment can be compared to a vowel with higher troughs as noise fills in the less intense portions of the input signal. When comparing the FFT vowel curves of this current analysis, the 16-channel /i/ appears very similar to the 16-channel /u/, and presumably listeners with hearing loss will have difficulties discriminating the location of a flattened F2 between /I/ and /Ʊ/ as well. The spectral contrast measure also indicated that these four vowels have a relatively large amount of spectral change from uncompressed to 16 channels, with /u/ showing the greatest change, from a value of 33 to 19.
Another vowel confusion error that appeared due to similar spectra occurred between /e/ and /Ʊ/. The vowel pairs described above were mistaken for each other, but in the case of /e/ and /Ʊ/, /e/ was confused with /Ʊ/, but /Ʊ/ was rarely confused with /e/. There is typically a large trough between F1 and F2 for /e/ (i.e., high and closely spaced F2 and F3), but after 16-channel compression, the trough becomes shallower. It is possible that F2 and F3 are identified as F3 in /Ʊ/, whereas the rising trough combined with the flattening of the F1 peak increased the probability of listeners misperceiving the F1 as a combined low F2 and F1. In the 16-channel /Ʊ/, all three formant peaks were altered resulting in poorer scores, although without an /e/ bias. This confusion is merely one example of how changing the relative amplitude of formant frequencies through multiple channels may have effects that are complex and difficult to predict without direct measurement.
Another approach to describing vowel differences and confusion may be from the perspective of audibility of F2 in relation to the spectral contrast. For instance, consider the vowel confusion between /i/ and /u/. Although audibility was not correlated with vowel errors, we can speculate on the improvement observed from a spectral contrast value of 18.71 to 18.56 for the vowel /i/ and the decrement from 21.95 to 19.05 for the vowel /u/. The troughs between F1 and F2 are very distinct between these two vowels, and the audibility of F2 depends on the slope of the hearing loss, as depicted in Figure 9. The same steep hearing loss (bold line) and shallow hearing loss (thin line) are plotted with both vowels. The average location of F2 for all the male and female speakers is indicated by an arrow for each vowel. Figure 9 clearly shows how the slope of the loss will determine whether or not F2 is audible for both vowels; any part of the vowel curve that lies below the hearing level lines is inaudible. The potential for improvement may be higher for /i/ as F2 is higher in frequency and for the same two hearing loss slopes, if the vowel /u/ was already difficult to identify after spectral flattening (F2 is audible for both hypothetical slopes), then performance will continue to be difficult to identify. Consequently, it may be possible to make clinical recommendations based on audiometric characteristics. Additional work on these issues is underway in our laboratory.
Figure 9.

Vowel formant frequency curve for /u/ and /i/. The bold line indicates hypothetical steeper hearing loss slope, and the thin line indicates a hypothetical shallower hearing loss. Arrow indicates location of averaged F2 for male and female talkers.
Would simply increasing overall intensity of the vowel at a constant level improve performance for all listeners, no matter the slope of hearing loss? Crain and Yund (1995) found a detrimental effect on vowel performance beyond eight channels even when signal intensity was increased. Because vowels have F2 frequency regions at different frequency locations, it may seem reasonable to improve performance with individual frequency-shaping amplification. Interestingly, these previous studies reported no significant changes in vowel identification with frequency-shaping manipulations (Crain & Yund, 1995; Yund & Buckles, 1995). When compression ratios were individually selected for each participant with hearing loss, there was no significant difference between the unprocessed vowel discrimination score and any of the shaped conditions and, additionally, no detrimental effect of higher channel numbers. Crain and Yund speculated that the lack of both advantage and decrement in their results of increasing channel number for the shaped condition was due to the individual determination of compression ratios in each channel, which allowed the stimuli to be above threshold. Although encouraging in terms of clinical implementation of multichannel compression, this point is not entirely clear. Both the present data and Crain and Yund’s nonshaped condition found detrimental effects of large channel numbers, even when signal audibility was sufficient. Thus, simple changes in audibility do not seem to explain the reduced performance at higher channel numbers. Instead, this may be related to issues of overall spectral shape. Additional work is needed to further define these issues.
Another study analyzed the question of channel number in the context of audibility (Woods, Van Tasell, Rickert, & Trine, 2006) and looked at the amount of benefit for audiograms of various configurations. That study used a nonlinear prescriptive algorithm to determine individual gain and compression ratios (up to 3:1), together with the same one-third-octave band filter cutoffs and quiet environment as the present study. For mild-to-moderate audiograms, Woods et al. estimated that five channels or less was sufficient for maximum speech recognition performance. (All calculations reached ceiling.) Interestingly, whether computing the amount of benefit according to hearing loss configuration, maximal speech intelligibility index (SII), percentage correct, or least amount of root-mean-square error, all calculations indicated a plateau between 6 and 8 channels. Together with the current study, we conclude that when audibility is maximized, performance will eventually plateau and benefit will no longer increase by about 8 channels. However, it is possible that a larger number of channels might confer other advantages such as better feedback reduction. The point of interest taken from this current study is that benefit may be different depending on the vowel.
To reiterate, it is important not to view spectral contrast as a deterministic measure, such that any decrease in spectral contrast degrades performance. Only when spectral contrast drops below a certain point (specific to each vowel) is performance affected. This was illustrated by the trend towards improved vowel identification between 1 and 2 channels, even though spectral contrast decreased. That finding was encouraging in that it reiterated the benefit of a small number of channels over single-channel WDRC, as demonstrated in behavioral studies (Kiessling & Steffens, 1993; Yanick & Drucker, 1976). In a wearable aid, however, two channels usually confer an audibility advantage over single-channel amplification. That was not the case in the current study, in which essential vowel cues were audible even for the 1-channel condition. Here, the change from 1- to 2-channel compression may have had other advantages such as subtly tilting the vowel spectrum to reduce upward spread of masking.
Although much attention has been given to how consonants are affected by WDRC processing, it is also important to consider the role of vowels on overall speech perception. Just as there may be benefits and detriments to consonant identification with WDRC processing, this study now provides quantitative evidence for detriments in vowel identification with multiple compression channels. As discussed in the introduction, vowels are the more robust element of speech; however, the results of the current analysis also support the notion that there must be a compromise within WDRC processing for both consonantal and vowel identification. Many variables were held constant in this study, such as vowel duration, compression ratio, and formant transitions, in order to directly observe the effect of channel number and spectral flattening on vowel perception. In natural speech, vowels that are amplified through hearing aids would retain many of these cues. On the other hand, there is evidence that listeners with hearing loss may not be able to take full advantage of dynamic spectral cues like duration and formant transitions (Dorman, Marton, Hannley, & Lindholm, 1985). In that sense, the current study offers a strictly controlled test of essential auditory information.
The results of this study demonstrate that although particular attention may be given to personalize more and more hearing aid parameters, adding more channels does not automatically benefit every signal. Moreover, the ability to resolve vowel spectra can vary greatly in a group of listeners with similar hearing loss.
Summary
The main findings are as follows:
Overall spectral contrasts of vowels are significantly reduced as the number of compression channels increases; however, the amount of decrement depends on the vowel. Significant decrements were observed between 2 and 4 channels and 8 and 16 channels. Spectral differences can be described with either of the spectral contrast measure methods (mean peak minus mean trough or maximum peak minus minimum trough).
Listeners with mild sloping to moderately severe hearing loss demonstrated poorer vowel identification scores with decreasing spectral contrast for most vowels.
Audibility was not a significant factor affecting vowel identification performance. Vowel confusions made by listeners with hearing loss suggested that the ability to correctly identify vowels with degraded spectral resolution may depend not only on resolving formant frequencies but also on overall spectral shape and individual audiometric characteristics.
Acknowledgments
This study was supported by the Bloedel Hearing Research Center, Training Grant DC00033 from the National Institute on Deafness and Other Communication Disorders, and National Institutes of Health RO1 Grant DC006014. The authors acknowledge Marc Caldwell, Dennis Tang, and Kerry Witherall for their assistance in data collection, processing, and analysis, and Steve Armstrong and Gennum Corporation for providing the compression simulation software. Portions of this work were presented at the 2005 Acoustical Society of America Meeting in Minneapolis, MN; the 2006 Acoustical Society of America Meeting in Honolulu, HI; and the 2006 American Auditory Society Conference in Scottsdale, AZ.
References
- Abramovitz RS. Frequency shaping and multiband compression in hearing aids. Journal of Communication Disorders. 1980;13:483–488. doi: 10.1016/0021-9924(80)90047-7. [DOI] [PubMed] [Google Scholar]
- Armstrong S. Version 1.0 Gennum Corporation; Burlington, Ontario, Canada: 1997. GennEM - Single Channel AGC Emmulator. [Google Scholar]
- Barfod J. Multichannel compression hearing aids: Experiments and consideration on clinical applicability. Scandinavian Audiology Supplement. 1978;6:315–340. [PubMed] [Google Scholar]
- Bustamante DK, Braida LD. Principle component amplitude compression for the hearing impaired. The Journal of the Acoustical Society of America. 1987;82:1227–1242. doi: 10.1121/1.395259. [DOI] [PubMed] [Google Scholar]
- Caraway BJ, Carhart R. Influence of compressor action on speech intelligibility. The Journal of the Acoustical Society of America. 1967;41:1424–1433. doi: 10.1121/1.1910502. [DOI] [PubMed] [Google Scholar]
- Crain TR, Yund EW. The effect of multichannel compression on vowel and stop-consonant discrimination in normal-hearing and hearing-impaired subjects. Ear and Hearing. 1995;16:529–543. doi: 10.1097/00003446-199510000-00010. [DOI] [PubMed] [Google Scholar]
- De Gennaro S, Braida LD, Durlach NI. Multichannel syllabic compression for severely impaired listeners. Journal of Rehabilitation Research Development. 1986;23:17–24. [PubMed] [Google Scholar]
- Dorman MF, Marton K, Hannley MT, Lindholm JM. Phonetic identification by elderly normal and hearing-impaired listeners. The Journal of the Acoustical Society of America. 1985;77:664–670. doi: 10.1121/1.391885. [DOI] [PubMed] [Google Scholar]
- Dreisbach LE, Leek MR, Lentz JJ. Perception of spectral contrast by hearing-impaired listeners. Journal of Speech, Language, and Hearing Research. 2005;48:910–921. doi: 10.1044/1092-4388(2005/063). [DOI] [PubMed] [Google Scholar]
- Folstein MF, Folstein SE, McHugh PR. “Mini-mental state.” A practical method for grading the cognitive state of patients for the clinician. Journal of Psychiatric Research. 1975;12:189–198. doi: 10.1016/0022-3956(75)90026-6. [DOI] [PubMed] [Google Scholar]
- Franck BAM, Sidonne C, van Kreveld-Bos GM, Dreschler WA, Verschuure H. Evaluation of spectral enhancement in hearing aids combined with phonemic compression. The Journal of the Acoustical Society of America. 1999;106:1452–1464. doi: 10.1121/1.428055. [DOI] [PubMed] [Google Scholar]
- Hedrick MS, Nabelek AK. Effect of F2 intensity on identity of /u/ in degraded listening conditions. Journal of Speech, Language, and Hearing Research. 2004;97:1012–1021. doi: 10.1044/1092-4388(2004/075). [DOI] [PubMed] [Google Scholar]
- Hillenbrand JM, Getty LA, Clark MJ, Wheeler K. Acoustic characteristics of American English vowels. The Journal of the Acoustical Society of America. 1995;97:3099–3111. doi: 10.1121/1.411872. [DOI] [PubMed] [Google Scholar]
- House AS. On vowel duration in English. The Journal of the Acoustical Society of America. 1961;33:1174–1178. [Google Scholar]
- Ito M, Tsuchida J, Yano M. On the effectiveness of whole spectral shape for vowel perception. The Journal of the Acoustical Society of America. 2001;110:1141–1149. doi: 10.1121/1.1384908. [DOI] [PubMed] [Google Scholar]
- Kent RD, Read C. The acoustic characteristics of vowels and diphthongs. In: Esperti CL, editor. The acoustic analysis of speech. Singular; San Diego: 1992. pp. 105–137. [Google Scholar]
- Kewley-Port D, Watson CS. Formant-frequency discrimination for isolated English vowels. The Journal of the Acoustical Society of America. 1994;95:485–496. doi: 10.1121/1.410024. [DOI] [PubMed] [Google Scholar]
- Kewley-Port D, Zheng Y. Vowel formant discrimination: Towards more ordinary listening conditions. The Journal of the Acoustical Society of America. 1999;106:2945–2958. doi: 10.1121/1.428134. [DOI] [PubMed] [Google Scholar]
- Kiessling J, Steffens T. Comparison of a programmable 3-channel compression hearing system with single-channel AGC instruments. Scandinavian Audiology. 1993;38(Suppl):65–74. [PubMed] [Google Scholar]
- Kuk F, Ludvigsen C.Changing with the times: Choice of stimuli for hearing aid verification: pure-tones, speech or composite signals? Here’s what to use and why Hearing Review 20031024–28., 56–57. [Google Scholar]
- Leek MR, Dorman MF, Summerfield Q. Minimum spectral contrast for vowel identification by normal-hearing and hearing-impaired listeners. The Journal of the Acoustical Society of America. 1987;81:148–154. doi: 10.1121/1.395024. [DOI] [PubMed] [Google Scholar]
- Leek MR, Summers V. Reduced frequency selectivity and the preservation of spectral contrast in noise. The Journal of the Acoustical Society of America. 1996;100:1796–1806. doi: 10.1121/1.415999. [DOI] [PubMed] [Google Scholar]
- Lippmann RP, Braida LD, Durlach NI. Study of multichannel amplitude compression and linear amplification for persons with sensorineural hearing loss. The Journal of the Acoustical Society of America. 1981;69:524–534. doi: 10.1121/1.385375. [DOI] [PubMed] [Google Scholar]
- Liu C, Kewley-Port D. Vowel formant discrimination for high-fidelity speech. The Journal of the Acoustical Society of America. 2004;116:1224–1233. doi: 10.1121/1.1768958. [DOI] [PubMed] [Google Scholar]
- Molis MR. Evaluating models of vowel perception. The Journal of the Acoustical Society of America. 2005;118:1062–1071. doi: 10.1121/1.1943907. [DOI] [PubMed] [Google Scholar]
- Moore BC, Glasberg BR. A comparison of two-channel and single-channel compression hearing aids. Audiology. 1986;25:210–226. [PubMed] [Google Scholar]
- Moore BC, Laurence RF, Wright D. Improvements in speech intelligibility in quiet and in noise produced by two-channel compression hearing aids. British Journal of Audiology. 1985;19:175–187. doi: 10.3109/03005368509078972. [DOI] [PubMed] [Google Scholar]
- Nabelek AK. Identification of vowels in quiet, noise, and reverberation: Relationships with age and hearing loss. The Journal of the Acoustical Society of America. 1988;84:476–484. doi: 10.1121/1.396880. [DOI] [PubMed] [Google Scholar]
- Nabelek IV. Performance of hearing-impaired listeners under various types of amplitude compression. The Journal of the Acoustical Society of America. 1983;74:776–791. doi: 10.1121/1.389865. [DOI] [PubMed] [Google Scholar]
- Pickett JM. Perception of vowels heard in noises of various spectra. The Journal of the Acoustical Society of America. 1957;29:613–620. [Google Scholar]
- Plomp R. The negative effect of amplitude compression in multichannel hearing aids in the light of the modulation-transfer function. The Journal of the Acoustical Society of America. 1988;83:2322–2327. doi: 10.1121/1.396363. [DOI] [PubMed] [Google Scholar]
- Richie C, Kewley-Port D, Coughlin M. Discrimination and identification of vowels by young, hearing-impaired adults. The Journal of the Acoustical Society of America. 2003;114:2923–2933. doi: 10.1121/1.1612490. [DOI] [PubMed] [Google Scholar]
- Turner CW, Henn CC. The relation between vowel recognition and measures of frequency resolution. Journal of Speech & Hearing Research. 1989;32:49–58. doi: 10.1044/jshr.3201.49. [DOI] [PubMed] [Google Scholar]
- Turner CW, Holte LA. Discrimination of spectral-peak amplitude by normal and hearing-impaired subjects. The Journal of the Acoustical Society of America. 1987;81:445–451. doi: 10.1121/1.394909. [DOI] [PubMed] [Google Scholar]
- van Buuren RA, Festen JM, Houtgast T. Compression and expansion of the temporal envelope: Evaluation of speech intelligibility and sound quality. The Journal of the Acoustical Society of America. 1999;105:2903–2913. doi: 10.1121/1.426943. [DOI] [PubMed] [Google Scholar]
- van Harten-de Bruijn HE, van Kreveld-Bos CS, Dreschler WA, Verschuure H. Design of two syllabic nonlinear multichannel signal processors and the results of speech tests in noise. Ear and Hearing. 1997;18:26–33. doi: 10.1097/00003446-199702000-00003. [DOI] [PubMed] [Google Scholar]
- Villchur E. Signal processing to improve speech intelligibility in perceptive deafness. The Journal of the Acoustical Society of America. 1973;53:1646–1657. doi: 10.1121/1.1913514. [DOI] [PubMed] [Google Scholar]
- Walker G, Byrne D, Dillon H. The effects of multichannel compression/expansion amplification on the intelligibility of nonsense syllables in noise. The Journal of the Acoustical Society of America. 1984;76:746–757. doi: 10.1121/1.391261. [DOI] [PubMed] [Google Scholar]
- Wiley TL, Cruickshanks KJ, Nondahl DM, Tweed TS, Klein R, Klein BE. Tympanometric measures in older adults. Journal of the American Academy of Audiology. 1996;7:260–268. [PubMed] [Google Scholar]
- Woods WS, Van Tasell DJ, Rickert ME, Trine TD. SII and fit-to-target analysis of compression system performance as a function of number of compression channels. International Journal of Audiology. 2006;45:630–644. doi: 10.1080/14992020600937188. [DOI] [PubMed] [Google Scholar]
- Wright R, Bor S, Souza P. Region, gender and vowel quality: A word to the wise hearing scientist. The Journal of the Acoustical Society of America. 2006;120:3294. [Google Scholar]
- Yanick P, Jr., Drucker H. Signal processing to improve intelligibility in the presence of noise for persons with ski-slope hearing impairment. IEEE Transactions on Acoustics, Speech, & Signal Processing. 1976;24:507–512. [Google Scholar]
- Yund EW, Buckles KM. Multichannel compression hearing aids: Effect of number of channels on speech discrimination in noise. The Journal of the Acoustical Society of America. 1995;97:1206–1223. doi: 10.1121/1.413093. [DOI] [PubMed] [Google Scholar]
- Zahorian SA, Jagharghi AJ. Spectral-shape features versus formants as acoustic correlates for vowels. The Journal of the Acoustical Society of America. 1993;94:1966–1982. doi: 10.1121/1.407520. [DOI] [PubMed] [Google Scholar]