Abstract
A 10,000-rad radiation hybrid cell panel of the rhesus macaque was generated to construct a comprehensive RH map of chromosome 5. The map represents 218 markers typed in 185 RH clones. The 4,846 cR length map has an average marker spacing of 798 kb. Alignments of the RH map to macaque and human genome sequences confirm a large inversion and reveal a previously unreported telomeric inversion. The macaque genome sequence indicates small translocations from the ancestral homolog of macaque chromosome 5 to macaque chromosome 1 and 6. The RH map suggests that these are likely assembly artifacts. Unlike the genome sequence, the RH mapping data indicate the conservation of synteny between macaque chromosome 5 and human chromosome 4. This study shows that the 10,000-rad panel is appropriate for the generation of a high-resolution whole genome RH map suitable for the verification of the rhesus genome assembly.
Keywords: Comparative mapping, Macaque and Human genomes, Rhesus macaque, RH map, Radiation hybrid
Introduction
The rhesus monkey (Macaca mulatta) is the most commonly used non-human primate animal model for human biomedical research [see review 1]. Important applications include studies on diabetes, cardiovascular disease, obesity, AIDS vaccine development, and hypertension (http://www.ncrr.nih.gov/compmed/rhesusworkshopreport). The analysis of the rhesus genome is important to maximize our understanding of the molecular and cellular basis of the human disease processes being modeled.
A 5.2 X draft genome sequence (Mmul_1.0) of an Indian-origin female rhesus macaque and BAC mapping data are now available [1]. Although special attention was given during the assembly of the genome sequences to avoid the generation of a “humanized” genome sequence [1], the comparative assembly procedures are still likely to have introduced biases towards the human genome organization, especially in assembling repeat-containing regions or duplicated sequences. For the construction, de novo macaque assemblies were always given precedence over the human genome in merging and assigning scaffolds onto the chromosomes, but human data were used to place large merged scaffolds onto the macaque chromosomes [1].
Recently, RH maps have been employed to either align scaffolds onto chromosomes or to identify and resolve errors in the assembly of genome sequences [2,3]. Significant gene order differences have been reported between high-resolution RH maps and cattle genome sequence assemblies based on 6.0 X (Btau_2) or 7.1 X (Btau_3.1) sequencing efforts [4–7]. These studies suggest that integrated genome maps are an efficient means of improving genome sequence assemblies.
The rhesus 5,000-rad whole genome RH map [8] was used to scaffold the genome sequences [1]. This RH map identified 23 breakpoints between human and macaque genomes. However, a comparison of the reconstructed human-chimpanzee ancestral genome and rhesus genome indicates 43 large-scale breakpoints and 820 intermediate breakpoints [1]. This discrepancy suggests the need for a higher resolution RH map to screen the genome assembly.
In this study we report the generation of a 10,000-rad RH panel, with an Indian-origin male rhesus macaque as a donor, and the construction of a high resolution RH map of chromosome 5 (Mmul 5), the homolog of human chromosome 4 (Hsap 4) [9,10]. Rhesus macaque specific gene-based sequence tagged site (STS) markers were designed from 3’UTR, intronic and exonic sequences available from the sequencing data [1,11]. In addition, we used STS and microsatellite markers incorporated in previous macaque genome maps [8,10]. Mmul 5 was chosen to test the resolving power of the panel and to screen the genome assembly. We have compared our RH map with the 5,000-rad RH map, the meiotic map, and the macaque and human sequence maps.
Results
RH map
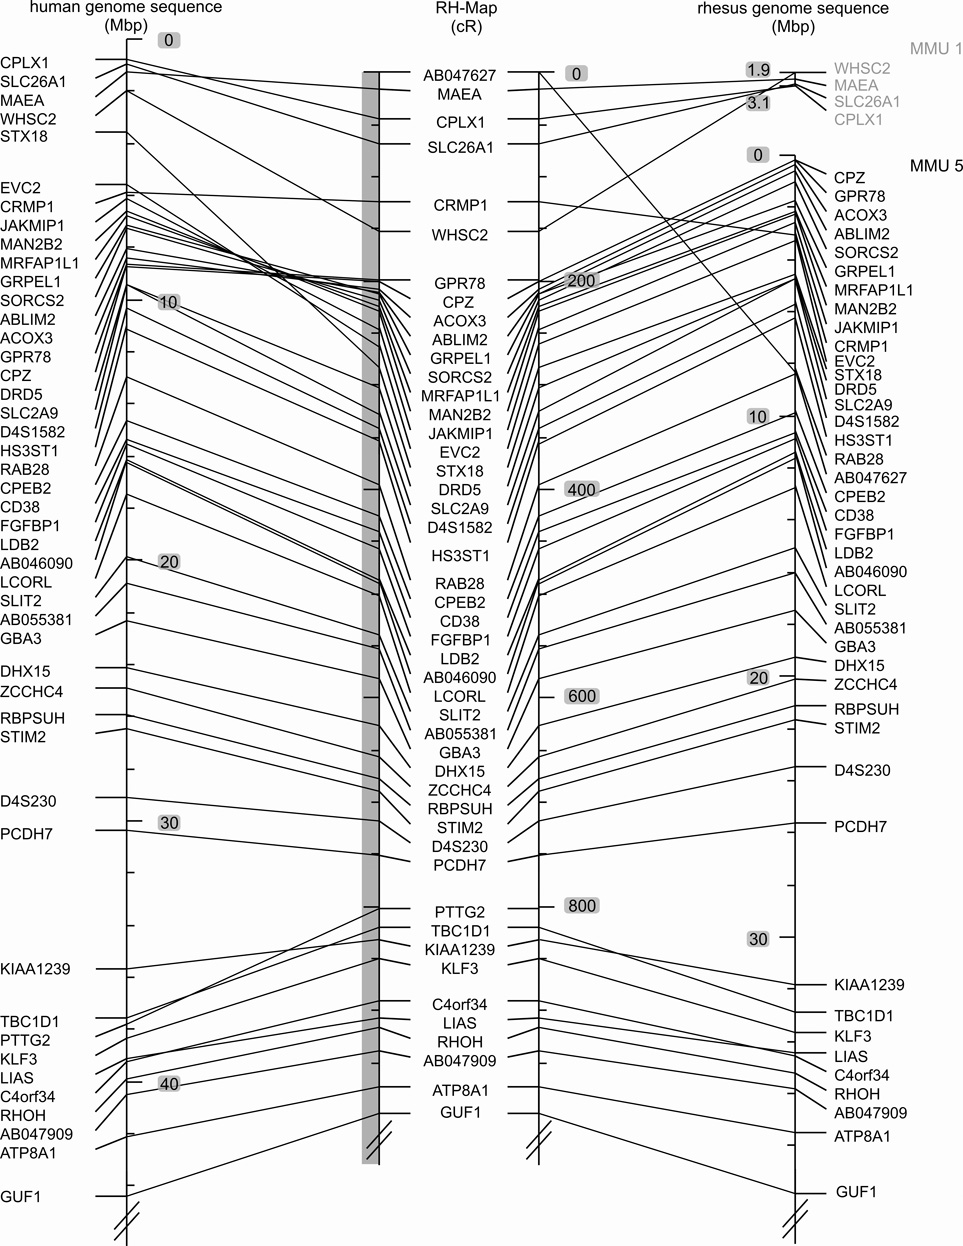
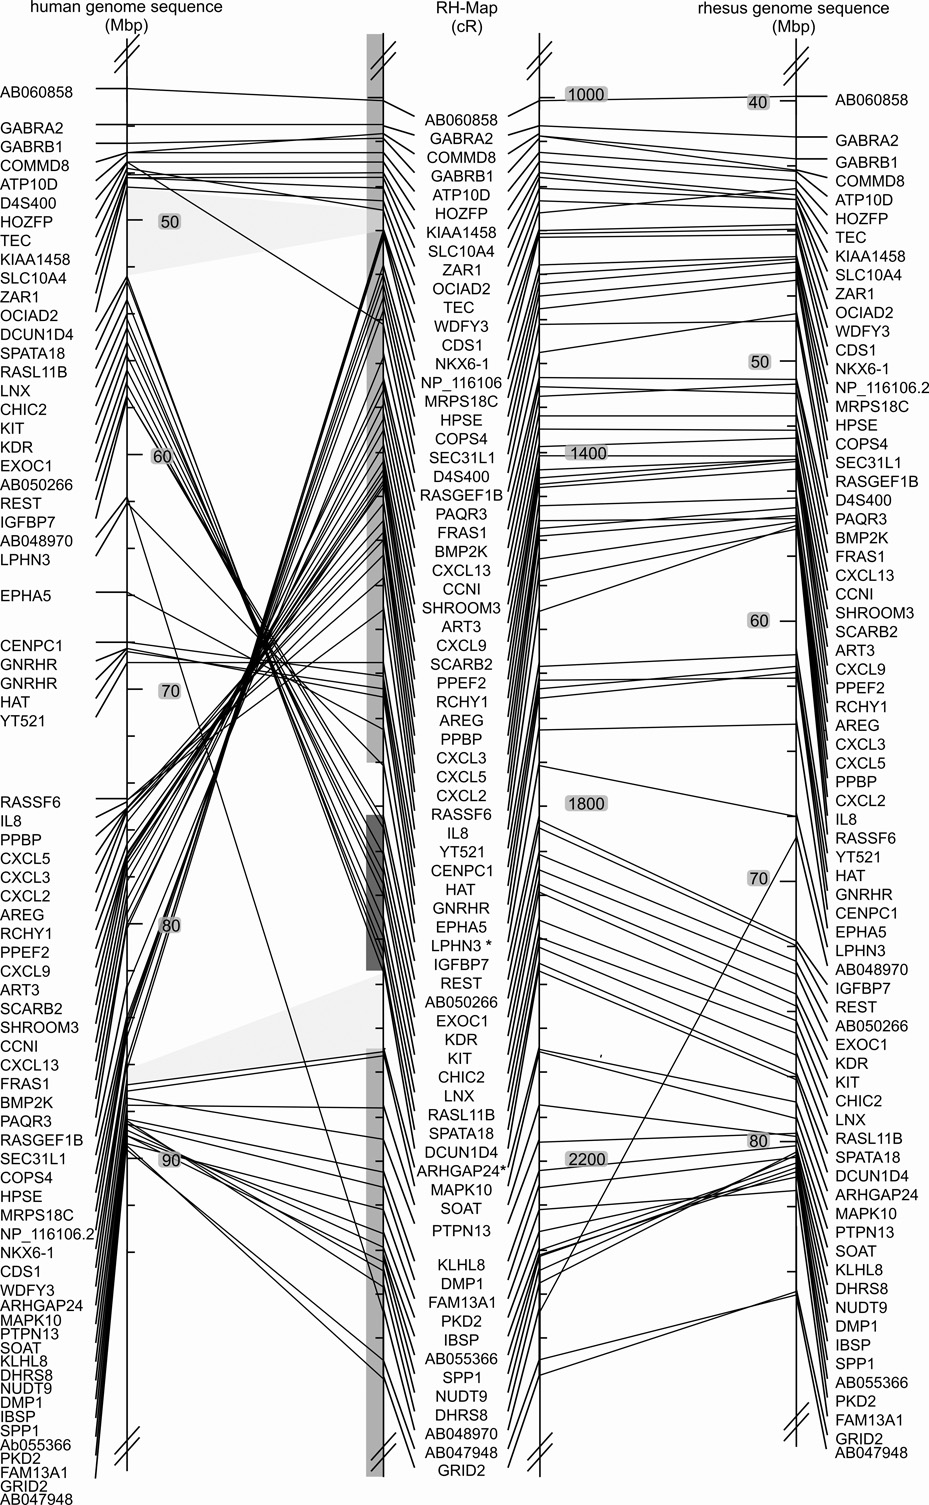
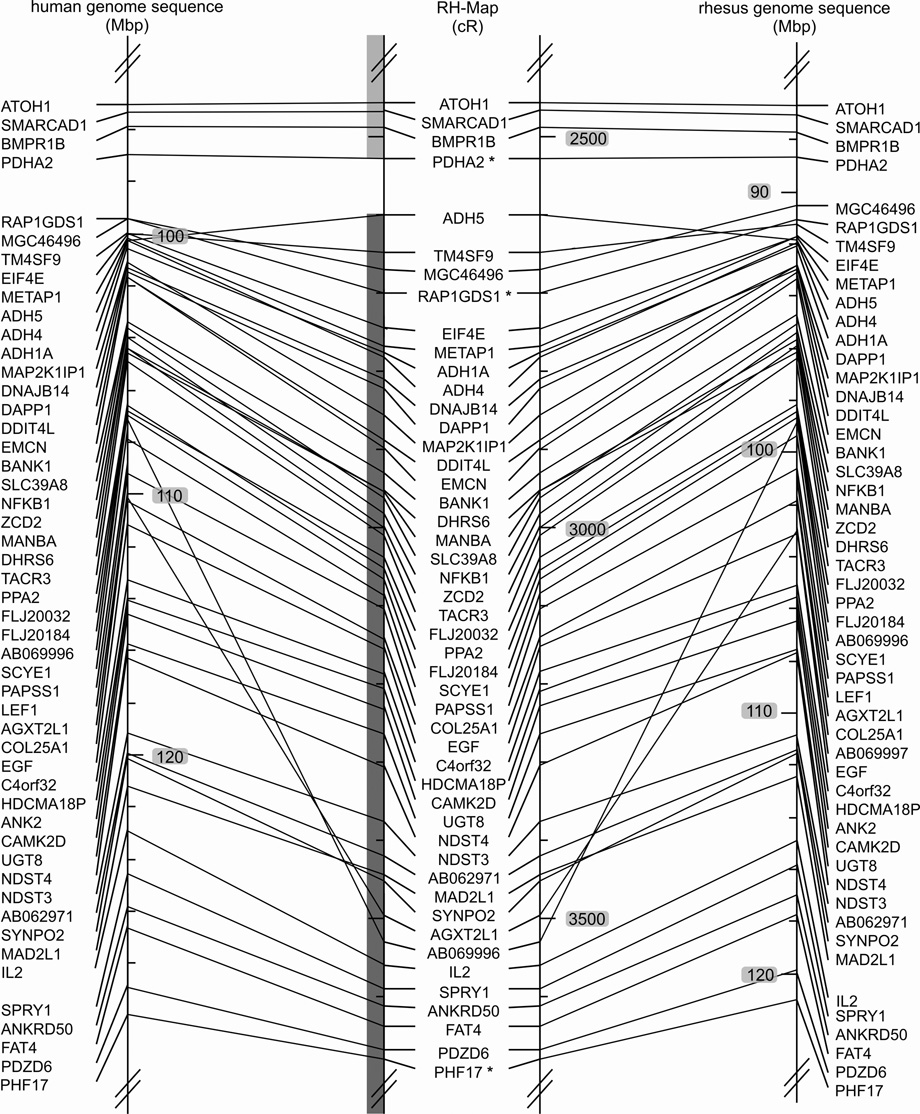
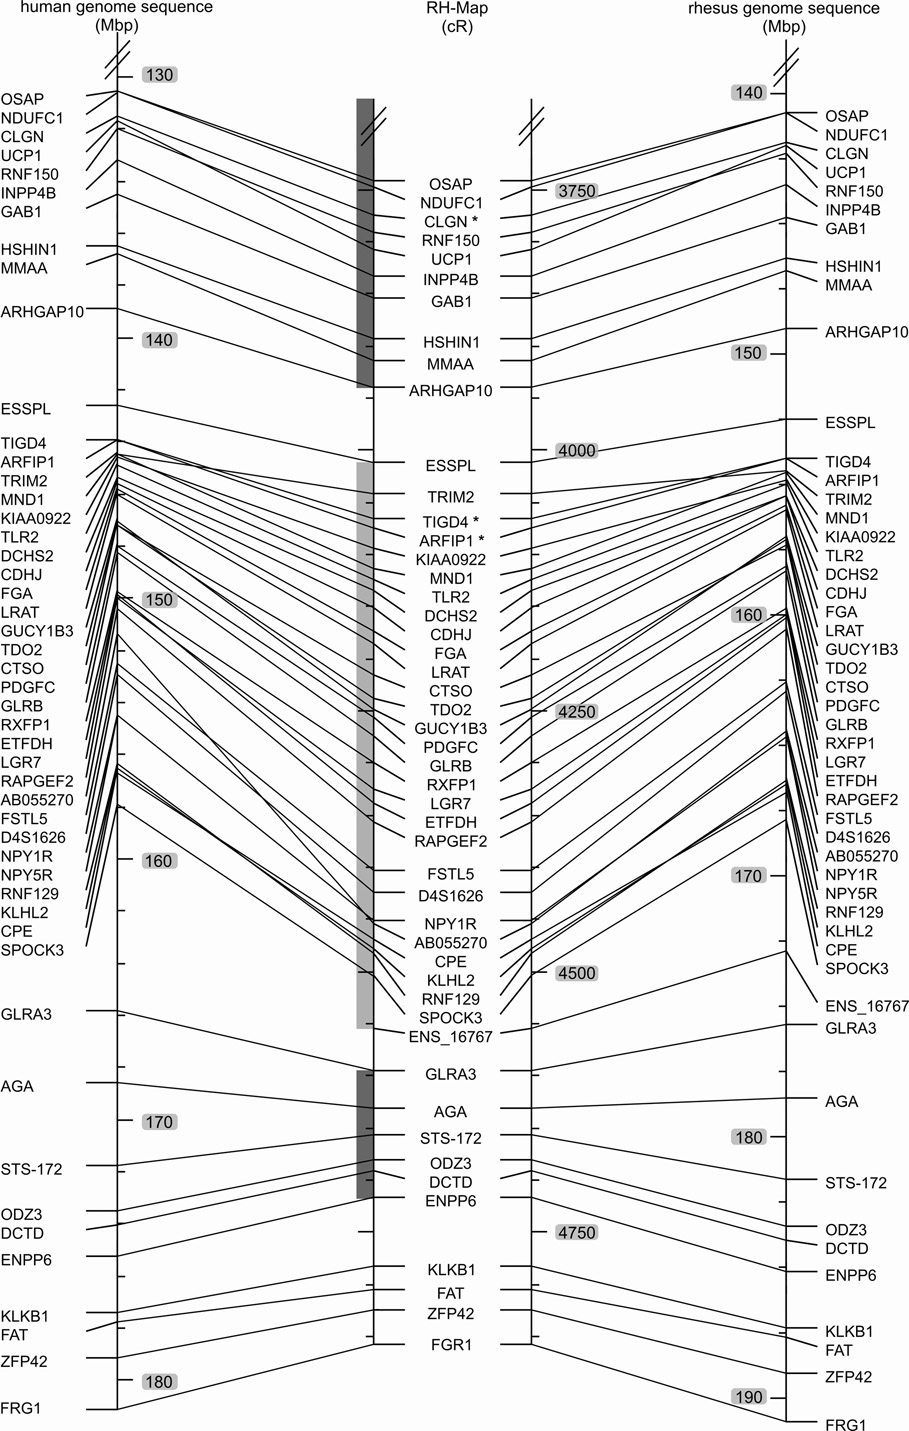
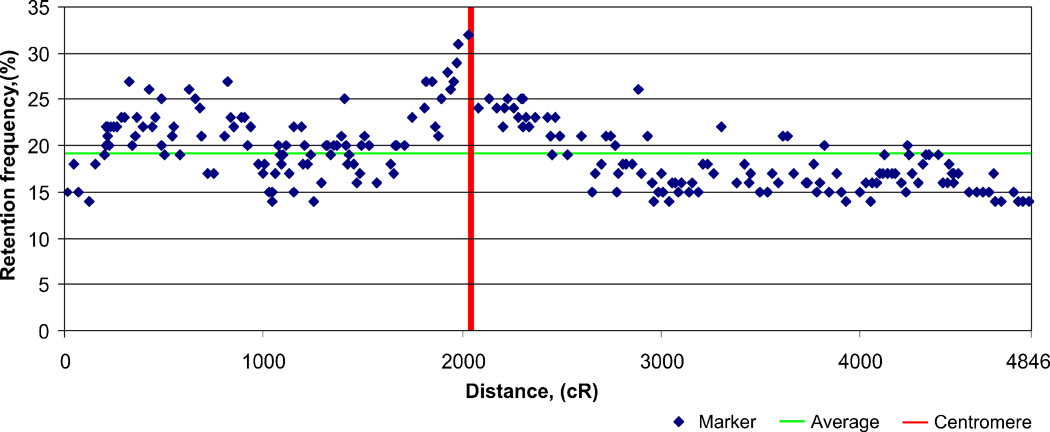
The rhesus 10,000-rad panel consists of 185 clones. A total of 218 markers (204 gene-associated STS markers and 14 microsatellites) were included in the RH map of macaque chromosome 5 spanning 4,846 cR10,000 (Fig. 1). The average marker spacing is 798 kb, with a ratio of physical distance and irradiation-induced breakage of 37.5 kb per cR10,000. Analysis of closely spaced STS markers (as identified by genome sequence data) shows that the RH panel is capable of reliably ordering markers down to a resolution of 30 kb for marker-dense parts of the chromosome. The mapping data as well as marker coordinates are presented in the supplemental table 1. The mapped markers had an average retention frequency (RFs) of 19%, ranging from 12 to 32%. The RF distribution displays a certain asymmetry (Fig. 2). The highest RFs are observed for the peri-centromeric region and an interstitial region of the short arm, ranging from 200 to 800 cR. The short arm pericentromeric region has RFs even more elevated than the ones of the long arm. The telomere-near markers show below average retention frequencies.
Fig. 1. Comparison of marker order on the 10,000-rad RH map of the rhesus macaque chromosome 5 (Mmul5) with the macaque genomic map and the human homolog, Hsap 4.
Left: Hsap 4 genomic map, Middle: RH map developed in this report, Right: Macaque genome sequence assembly of Mmul5 (Ensembl v.47, UCSC v.173). The positions of the BACs used to orient the linkage groups are indicated by asterisks added to the corresponding markers. The extent of the initial large linkage groups is indicated by the grey shaded vertical bars to the left of the macaque RH-map data. Comparisons of the RH and human genomic maps reveal two larger rearrangements, one involving the centromere and a second subtelomeric inversion on the p-arm. Comparisons of the RH and macaque genomic maps detect likely genome sequence assembly artifacts for regions assigned to Mmul 1 and 6. These regions are identified by four genes (WHSC2, MAEA, SLC26A1, CPLX1) and a single gene (PTTG2). The RH map displays complete synteny conservation between Mmul 5 and Hsap 4.
Fig. 2. A scattergram of the retention frequencies of 218 markers along rhesus macaque chromosome 5.
High retention frequencies were observed for the markers mapped around the centromere. On average, the markers on the short-arm exhibited a higher retention frequency than markers of the long-arm of the chromosome.
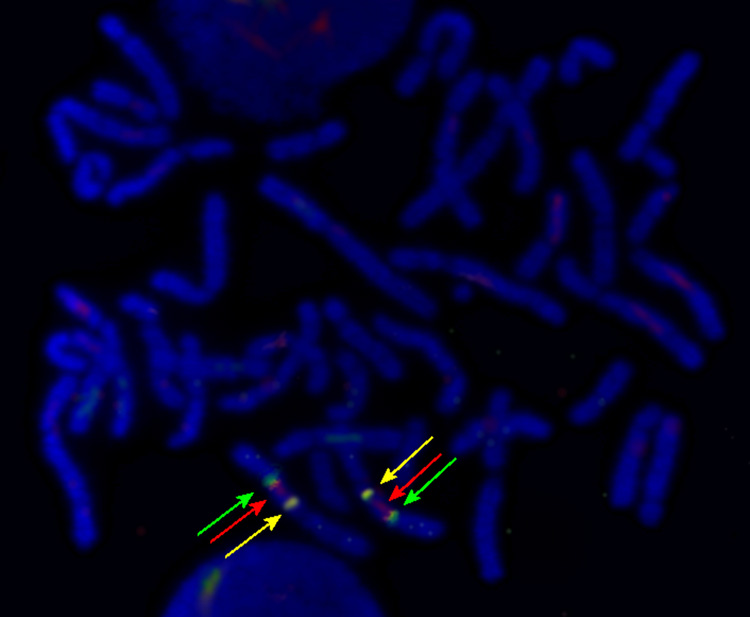
We used algorithms embedded in CarthaGene software [12] to perform two-point loci analysis with a LOD threshold set at 9 and inter-marker distances of 50 cR. The markers clustered in five linkage groups of more than 10 markers. The largest group with 93 markers covers the p-arm of chromosome 5. The orientation of the linkage groups in relation to the macaque and human sequence maps was verified by fluorescence in situ hybridization (FISH) with BAC clones containing sequences representing the linkage group ends (Fig. 3). A modified comparative mapping approach [13] was used to construct the RH map of macaque chromosome 5. A framework map derived from the aligned linkage groups was employed to build a comparative RH map.
Fig. 3. Three color fluorescent in situ hybridization with BAC clones identifying the orientation of RH linkage groups on macaque chromosome 5.
The red and green signals (BAC clone CH-250 14B16 and CH-250 11I13, respectively) delineate the adjoining borders of two RH linkage groups. The yellow signal delineates the hybridization of BAC clone CH-250 1K22. The picture shows hybridization signals of three out of seven BAC clones used to orient the linkage groups.
Comparison with the 5000-rad RH map and the meiotic map of Mmul 5
The present paper uses the chromosomal nomenclature adapted by the genome sequence consortium [1]. However, in the previous RH map [8] Mmul 5 had been identified as MMA 4. Twenty-one of the 218 markers are present in both the 5,000-rad RH map [8] and the 10,000-rad RH map. Overall the marker orders are in agreement, except for three closely linked markers (AB046090, SLIT2, AB055381) demonstrating an inversion. Both RH maps, and the meiotic map [10] show a large inversion when aligned to human chromosome 4. However, there is disparity in the definition of the breakpoint regions and the average marker spacing (Table 1).
Table 1.
Comparisons of marker numbers and of the major inversion breakpoint interval sizes in the 10,000Rad and 5,000-rad RH maps and the meiotic map of the rhesus chromosome 5
| 10,000-rad RH map | 5,000-rad RH map | meiotic map | |
|---|---|---|---|
| Murphy et al. [15] | Rogers et al. [1] | ||
| Average marker spacing | 798 kb | 4.4 Mb | 16.5 cM |
| No. of markers | 218 | 41 | 11 |
| Short-arm BPa size (Mb) | 0.46 (3.9) | 6.2 (9.0) | 3.72 (15.0) |
| Centromeric BPa size (Mb) | 1.32 (0.8) | 12.8 (4.0) | -- (48.0) |
Breakpoint is abbreviated as BP. Breakpoint interval sizes are given for macaque genome sequence coordinates first. The interval sizes based on human coordinates are given in parentheses.
Comparison with the human chromosome 4 sequence map (NCBI build 36)
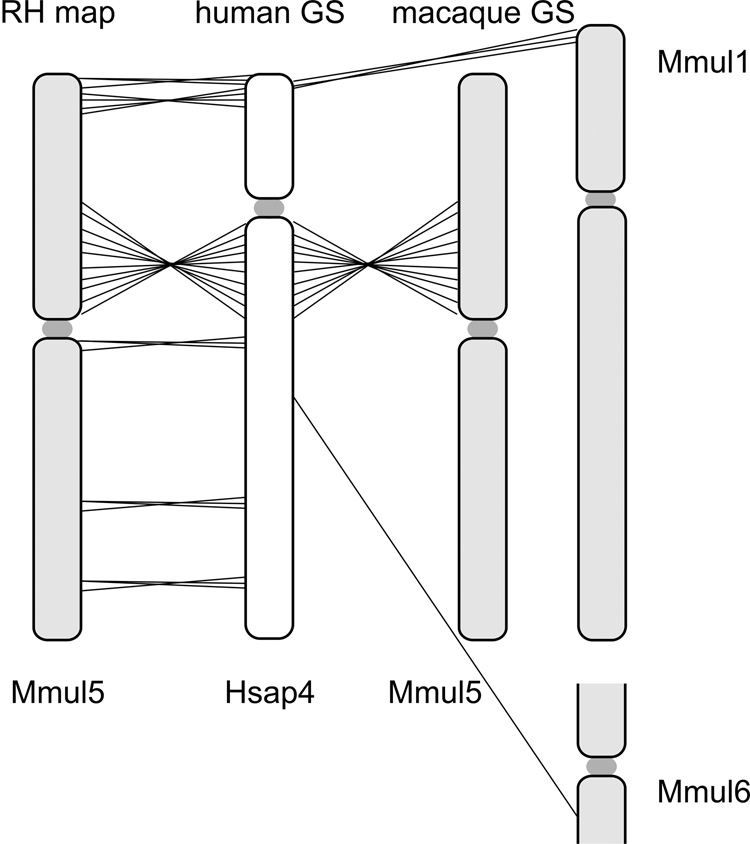
The 10,000-rad RH map confirms a previously cytogenetically described large inversion and a subtelomeric inversion on the p-arm (Fig. 1 and Fig. 4). Comparisons of our RH map and human sequence indicate that the first breakpoint of the large inversion is located in the centromere and the second is defined by an 800 kb interval between human WDFY3 and ARHGAP24 on the q-arm. While the inverted region itself has maintained perfect colinearity between the human and the macaque, the region that immediately flanks the second breakpoint is internally rearranged and depicts a smaller inversion (Fig. 4). Comparisons to the order of orthologous genes in mouse, cattle, macaque, and human indicate that the large inversion is macaque specific; the gene order is conserved between the three species.
Fig. 4. Schematic comparison of the macaque RH map with human and macaque genome sequence maps.
The figure depicts only markers revealing rearrangements between the different maps as recognized by the crossing lines. Markers in regions for which the maps are collinear are not connected for simplification.
Two further previously unidentified rearrangements between human and macaque genomes are indicated by the RH map (Fig. 1). The first rearrangement involves CTSO, TDO2, and GUCY1B3 at about 4,000 cR. The second involves CPE, KLHL2, and RNF129 at about 4,500 cR on the 10,000-rad RH.
Comparisons with the macaque genome sequence (Mmul_1.0)
The 10,000-rad RH map indicates several potential amendments to the macaque genome sequence assembly. Based on the RH data, small chromosomal translocations between macaque chromosome 5 and chromosomes 1 and 6 present in the macaque genome sequence map are likely assembly artifacts (Fig. 1 and Fig. 4). A 1.2 Mbp-sized telomeric segment (including WHSC2, MAEA, SLC26A1, CPLX1) homologous to human chromosome 4 unequivocally maps to macaque chromosome 5. Moreover, PTTG2 placed onto macaque chromosome 6 (UCSC genome browser v173) according to the assembly is also syntenic to macaque chromosome 5. Our RH map indicates a complete conservation of synteny between macaque chromosome 5 and human chromosome 4.
Differences between the RH map and the macaque genome sequence are also evident on two smaller inversions (Fig. 1 and Fig. 4). Further, the following marker pairs are flipped: OCIAD2/TEC, COMMD8/GABRB1, LIAS/C4orf34, SYNPO2/MAD2L1, OSAP/NDUFC1, UCP1/RNF150, TIGD4/ARFIP1, KIAA0922/MND1, LGR7/ETFDH, NPY1R/AB055270, ADH4/ADH1A, and DDIT4L/EMCN. These differences could be caused by artifacts of the RH mapping process or by micro-inversion polymorphisms. For five regions with minor gene order differences between human and macaque genome sequences the RH map agrees in three cases with the macaque assembly and suggests a different third gene order for 2 of the regions (Supplemental Table 2).
Discussion
10,000-rad RH map construction
We have used a 10,000-rad panel to generate a high-resolution RH map of macaque chromosome 5. The RH map serves as an independent mapping resource for comparisons of the rhesus macaque genome sequence assembly, thus enabling the verification of the assembly and the identification of potential errors. We chose chromosome 5 to confirm previous reports of internal rearrangements on the chromosome based on RH data [8] and cytogenetic observations (unpublished).
The present RH map is based on data from 185 clones; about twice the number most often employed for radiation hybrid mapping [14]. When the panel was reduced to 92 clones no more than 159 markers could be included into the linkage groups and no fewer than 8 linkage groups were defined. Repeated analyses of RH vectors with different sets of 92 clones did not improve on this result. In contrast, the 185 clone analysis resulted in only 5 large linkage groups with the largest group encompassing 93 markers. Elsewhere, a RH map generated from 180 clones detected discrepancies in the cattle genome assembly (Btau_3.1) [4], which were not revealed by a map developed from 94 clones [5]. Both of these cattle RH maps were built from 3,000-rad panels. Thus the results of both the present and the Marques et al. study [4] indicate that higher clone numbers can provide substantially higher resolving power. This is in agreement with the theoretical considerations for high-resolution RH mapping [15–17].
Our map displays a ratio of 37.5 kb/cR for the genomic distance and the radiation-induced breakage. The average marker distance is 798 kb as compared to the 4.4 Mb value for the same chromosome in the 5,000-rad RH map [8]. Based on the chromosome 5 data, the highest achievable resolution of the panel can be estimated to be about 30 kb. This indicates that the rhesus 10,000-rad panel is suitable for generating chromosomal maps of high-resolution, providing an efficient means of testing the genome assembly.
The average retention frequency of our mapped makers (19%) is significantly higher than the ones reported for other 10,000-rad panels. For example, the human panel has a retention frequency of 15% for the homologous chromosome [18]. The distribution of retention frequencies (RFs) along macaque chromosome 5 concurs partly with previous studies [14,18–20] by displaying the highest RFs around the centromere (Fig. 2). It is conceivable that centromere containing fragments have a selective advantage, as these fragments might be able to achieve replication in the hamster cells without integration into hamster chromosomes. The short arm displays an interstitial high retention frequency region, reaching peri-centromere like RF values (Fig. 2). There could be two potential explanations for this phenomenon. First, the region could contain particular sequences leading to preferential recombination with the hamster genome. Secondly, the region could contain a neo-centromere that might have been activated after the fusion of hamster and macaque cells. Although a Mmul 5 neocentromere has not been described, the orthologous human chromosome 4 bears a neocentromere region [21] that, as a consequence of the discussed chromosomal inversion, is located in the region displaying the atypically high retention frequencies.
The RH map of chromosome 5 provides a substantial increase in marker density compared to existing physical [8] and meiotic maps [10] of the rhesus macaque (41 and 11 markers, respectively). Because of the increased marker density, the new RH map may help to assemble additional scaffolds not yet assigned in the Mmul_1.
Alignment with the RH 5,000-rad map
Comparisons of the 10,000-rad RH map with the 5,000-rad RH map [8] reveal an overall consistency in loci order except for one region involving three closely linked markers (AB046090, SLIT2, AB055381) that show an inversion. These markers have the same order in the present 10,000-rad RH map, and in the human and macaque sequence assemblies. The divergent order in the 5,000-rad RH could be due to artifacts or to an inadequate resolution of the 5,000-rad panel. Whereas both RH maps demonstrate a large inversion when compared to the human chromosome 4, the 10,000-rad RH map indicates four further regions of rearrangements not previously reported (Fig. 1).
Comparison with macaque and human genome sequence assemblies
The ultimate genome map of a species is the correctly assembled DNA sequence. It has been shown that an integrated mapping approach combining sequence data, genetic map, and high resolution physical map data is helpful towards this goal as all mapping approaches are prone to errors [2,4,5].
During the assembly of the rhesus genome sequences, precedence was given to the de novo macaque assemblies over mapping to the human genome [1]. However, inconsistencies such as improper joins of different chromosomes were identified, and human data were used to split misassembled scaffolds. Since the human genome map was also used to help place large merged scaffolds onto the macaque chromosomes, it is possible that artifacts were introduced into the macaque genome sequence assembly by this procedure. Human and macaque genome sequences have been reported to have a sequence homology of 93.54% for the alignable regions [1]. The present 10,000-rad RH map has enabled the identification of potential artifacts in the macaque assembly, including placements of five genes on non-orthologous chromosomes (Fig. 1 and Fig. 4) rather than on chromosome 5. Moreover, the 10,000-rad RH map indicates an internal rearrangement in the region flanking the inversion breakpoint defined by DCUN1D4 and ARHGAP24 in the RH map. This rearrangement is also evident in comparison to the macaque genome sequence (Fig. 1). In this case, the differences between the macaque RH map and the genome sequence could be due to either an RH mapping artifact, an inversion polymorphism or due to a genome assembly error introduced by the usage of the human genome order to orient macaque scaffolds [1].
We investigated the possible correspondence between segmental duplications (SDs) and regions flanking the inversions in accordance with a previous report [8]. The study by Murphy et al. [8] indicated a complete association of SDs (≥ 10 Kb) to large-scale human evolutionary breakpoints. Here we identified segmental duplications through the UCSC genome browser and found 12 times more SDs of sizes larger than 5 Kb in the breakpoint intervals flanking the large inversion in humans than in the corresponding breakpoints in the macaque (Table 2). The human centromeric breakpoint harbors also segmental duplications of sizes larger than 10 Kb, which were not observed in the macaque. A segmental duplication associated with human chromosome 19 is strikingly conserved between macaques and humans with 84% sequence identity. We found no SDs in the long-arm breakpoint in humans. We also did not observe SDs in the breakpoint regions of the minor inversions (Fig. 4) in the macaque. Segmental duplications have been proposed to provide the substrate for non-allelic homologous recombination events and thus to have a functional role in rearrangements [22–24]. Our data do suggest that a complete association between SDs and inversions, as it has been described for the major human rearrangements, might not hold true for the macaque. However, rearrangements observed in the macaque might not be fully comparable as the large inversion involves the centromere and the other inversions are minor.
Table 2.
Comparison of the number of segmental duplications (SD) in the breakpoints of the large inversion between human and macaque chromosomes.
| short-arm break point (OCIAD2/WDFY3)a | centromeric breakpoint (DCUN1D4/ARHGAP24) | |
|---|---|---|
| Mmu 5 | 44,210,389-44,665,077 | 77,544,699-78,865,778 |
| Size of interval | 455 kb | 1.32 Mb |
| No. of SDs ≥5 kb | 5 | none |
| ≥10 kb | none | none |
| centromeric break point (OCIAD2/DCUN1D4) | long-arm breakpoint (WDFY3/ARHGAP24) | |
| Hsap 4 | 48,482192-52,404,057 | 85,809,719-86,615,555 |
| Size of interval | 3.9 Mb | 800 kb |
| bNo. of SDs ≥ 5kb | 61 | none |
| ≥10 kb | 46 | none |
The breakpoint interval size was calculated for the coordinates of OCIAD2 and WDFY3 because TEC is rearranged in the RH map in comparison to the macaque sequence.
The number of SDs ≥ 5 kb reported here includes the ≥10 kb segmental duplications.
The present data identify the breakpoints of the inversion more precisely than previous mapping efforts. For example, the short arm breakpoint is mapped to an interval of 0.46 Mb as compared to 6.2 and 3.72 Mb intervals for the 5000-rad RH map and the genetic map respectively [8,10] (Table 1). The present study further identifies a previously unreported sub-telomeric inversion.
RH maps have been used previously to screen and improve draft sequences of species such as cattle and human [2–6]. Two separate studies by Jann et al. [5] and McKay et al. [6] have reported inconsistencies in order and assignment of scaffolds between bovine RH map and 6X (Btau_2.0) draft assembly of bovine sequences. In a recent study [4], an alignment of a high resolution 12,000-rad RH map with an improved cattle assembly (Btau_3.1) indicated a major inconsistency in order of scaffolds on the centromeric region of the cattle chromosome 14. Further, a human 50,000-rad RH map [2] was able to resolve the marker order in 60% of the discrepancies between the Human Genome Project and the Celera draft genome sequence assemblies. These studies indicate that high-resolution RH maps are suitable for detecting and resolving misassembled sequences, and thus are aiding in the continued improvement of genome assemblies.
The Mmul_1 genome sequence of rhesus macaque enables efficient marker design and will greatly facilitate RH mapping in Old World monkeys. Developing RH data analysis and map construction methods [12,13] as well as new high throughput genotyping techniques, such as SNP assays [4,6], will enhance the generation and accuracy of physical maps and thus aid in the improvement of genome sequence assemblies. The present RH map shows that the 10,000-rad panel has potential to detect misassembled regions in the rhesus genome assembly. However, it will be important to integrate information from various sources to resolve the discrepancies.
Methods
Generation of the rhesus macaque RH panel
We generated a 10,000-rad RH panel by fusing a fibroblast donor cell line, developed from a male rhesus macaque housed at the California National Primate Research Center (CNPRC), with an A23 thymidine kinase (TK)-deficient Chinese hamster fibroblast cell line. Procedures for fusion, isolation, selection, and initial cloning of the panel were as described by Chowdhary et al. [25]. Hybrid cell lines (N = 206) were expanded in duplicate in DMEM medium containing 10% FBS and 1% of penicillin/streptomycin, and incubated at 37°C. The growth media was changed every 2 days until the cells were confluent. The cells were detached from the flasks with trypsin and resuspended in Hanks balanced salt solution. For each hybrid clone, one third of the cells were cryopreserved in freezing medium containing 10% DMSO. Genomic hybrid cell DNA was extracted using a standard phenol/chloroform method [26] from the remaining cells.
Primer design
We employed Primer3 (www.frodo.wi.mit.edu/cgi-bin/primer3) and NetPrimer (www.premierbiosoft.com/netprimer) online programs to design sequence-tagged site (STS) markers from the 3’UTR sequences generated by the rhesus gene chip project [11], and from the Mmul_1 sequence data [1]. Where 3’UTR sequences were not available, we designed markers to span the intron/exon boundaries to minimize amplification of the hamster background and allow gene identification. The sequences were also screened with Repeat Masker available through the UCSC genome browser. In addition, we genotyped 24 microsatellites previously incorporated into the rhesus macaque meiotic and 5,000-rad RH maps of the rhesus macaque [8,10].
Radiation hybrid genotyping
All STS and microsatellite markers were tested for optimal annealing temperatures. Optimized markers were typed on a 185-clone RH panel, prealiquoted into 384 well plates. PCR reaction was performed in duplicate in a final volume of 15 µl volume on a Perkin Elmer GeneAmp (ABI) 9700 thermal cycler with the following profile: 1) initial denaturation for 5 min at 95° C, 2) 35 cycles of 95° C at 1 min, 56–64° C at 1 min and 72° C at 1 min, and 3) a final primer extension at 72° C for 20 min. The PCR reaction included 40 ng hybrid cell line DNA, 0.05 U Full Taq DNA polymerase (Clontech, Mountain View, CA), 1.5 mM magnesium chloride, 0.5 M Betaine PCR enhancer, 0.2 mM dNTP, and 1X PCR buffer containing Tween detergent and BSA at 0.01% final concentration. Experimental controls included water, and hamster, human and macaque genomic DNA. The PCR products were run on 2% agarose gels, visualized by ethidium bromide staining, digitally recorded, and scored with GelScore software (http://www.wesbarris.com/GelScore).
Map construction
We used CarthaGene software [12] to perform 2-point linkage analyses and to determine marker order and inter-marker distances in cR. Marker consensus vectors were grouped with Nicemapl and Nicemapd algorithms at LOD 9 and a maximum distance of 50 cR. Markers with the lowest and highest retention frequencies were dropped until any further analysis did not improve the contiguity of linkage groups. The final map includes markers with retention frequencies between 12 and 32%. The order of the markers in each linkage group was analyzed and improved iteratively with Build, Annealing, Taboo, Genetic and Lin-Kernighan traveling salesman problem (TSP) algorithms. In most cases, TSP algorithms provided the greatest improvements of the map likelihood. Final enhancements were performed with iterative Flips (employing 7 loci windows) and Polish algorithms. For the generation of the chromosome 5 RH map we employed a modified version of the comparative mapping approach [13]. The initial five large linkage groups identified by CarthaGene algorithms were oriented to the consensus of macaque and human genome sequences. The orientation was further verified with FISH [27] of BAC clones (CH250-276N18, 258C10, 272N1, 1K22, 14B16, 11I13, 65C1) representing termini of the linkage groups and additional markers were typed attempting to narrow the gaps between the linkage groups. A framework map was constructed from the linkage group markers that were collinear to both human and macaque genome sequence maps. The RH vector data were integrated into the framework map by using both, dataset merging and comparative mapping functions provided by Carthagene. The dsbplambda parameter was chosen to indicate minimal chances of rearrangements of the framework. The resulting maps were optimized iteratively using the algorithms described above to integrate the remaining markers into the framework map, applying a threshold LOD score of 6.
Supplementary Material
Acknowledgments
This study was supported financially by NIH-NCRR R24 RR017584 grant to Leslie Lyons (University of California, Davis). We thank Elaine Owens (Texas A&M University) for the technical support in generating the hybrid cells and Carolyn Erdman for reviewing the manuscript.
Footnotes
Publisher's Disclaimer: This is a PDF file of an unedited manuscript that has been accepted for publication. As a service to our customers we are providing this early version of the manuscript. The manuscript will undergo copyediting, typesetting, and review of the resulting proof before it is published in its final citable form. Please note that during the production process errors may be discovered which could affect the content, and all legal disclaimers that apply to the journal pertain.
References
- 1.Gibbs RA, et al. Evolutionary and biomedical insights from the rhesus macaque genome. Science. 2007;316:222–234. doi: 10.1126/science.1139247. [DOI] [PubMed] [Google Scholar]
- 2.Olivier M, et al. A high-resolution radiation hybrid map of the human genome draft sequence. Science. 2001;291:1298–1302. doi: 10.1126/science.1057437. [DOI] [PubMed] [Google Scholar]
- 3.Weikard R, Goldammer T, Laurent P, Womack JE, Kuehn C. A gene-based high-resolution comparative radiation hybrid map as a framework for genome sequence assembly of a bovine chromosome 6 region associated with QTL for growth, body composition, and milk performance traits. BMC Genomics. 2006;7:53. doi: 10.1186/1471-2164-7-53. [DOI] [PMC free article] [PubMed] [Google Scholar]
- 4.Marques E, et al. A high resolution radiation hybrid map of bovine chromosome 14 identifies scaffold rearrangement in the latest bovine assembly. BMC Genomics. 2007;8:254. doi: 10.1186/1471-2164-8-254. [DOI] [PMC free article] [PubMed] [Google Scholar]
- 5.Jann OC, et al. A second generation radiation hybrid map to aid the assembly of the bovine genome sequence. BMC Genomics. 2006;7:283. doi: 10.1186/1471-2164-7-283. [DOI] [PMC free article] [PubMed] [Google Scholar]
- 6.McKay SD, et al. Construction of bovine whole-genome radiation hybrid and linkage maps using high-throughput genotyping. Anim Genet. 2007;38:120–125. doi: 10.1111/j.1365-2052.2006.01564.x. [DOI] [PMC free article] [PubMed] [Google Scholar]
- 7.Prasad A, et al. High resolution radiation hybrid maps of bovine chromosomes 19 and 29: comparison with the bovine genome sequence assembly. BMC Genomics. 2007;8:310. doi: 10.1186/1471-2164-8-310. [DOI] [PMC free article] [PubMed] [Google Scholar]
- 8.Murphy WJ, et al. A rhesus macaque radiation hybrid map and comparative analysis with the human genome. Genomics. 2005;86:383–395. doi: 10.1016/j.ygeno.2005.05.013. [DOI] [PubMed] [Google Scholar]
- 9.Cambefort Y, Mounie C, Colombies P, Moro F. [Toporaphy of chromosome banding in Papio papio] Ann Genet. 1976;19:5–9. [PubMed] [Google Scholar]
- 10.Rogers J, et al. An initial genetic linkage map of the rhesus macaque (Macaca mulatta) genome using human microsatellite loci. Genomics. 2006;87:30–38. doi: 10.1016/j.ygeno.2005.10.004. [DOI] [PubMed] [Google Scholar]
- 11.Duan F, Spindel ER, Li YH, Norgren RB., Jr Intercenter reliability and validity of the rhesus macaque GeneChip. BMC Genomics. 2007;8:61. doi: 10.1186/1471-2164-8-61. [DOI] [PMC free article] [PubMed] [Google Scholar]
- 12.Schiex T, Gaspin C. CARTHAGENE: constructing and joining maximum likelihood genetic maps. Proc Int Conf Intell Syst Mol Biol. 1997;5:258–267. [PubMed] [Google Scholar]
- 13.Faraut T, et al. A comparative genome approach to marker ordering. Bioinformatics. 2007;23:e50–e56. doi: 10.1093/bioinformatics/btl321. [DOI] [PubMed] [Google Scholar]
- 14.Murphy WJ, Page JE, Smith C, Jr, Desrosiers RC, O'Brien SJ. A radiation hybrid mapping panel for the rhesus macaque. J Hered. 2001;92:516–519. doi: 10.1093/jhered/92.6.516. [DOI] [PubMed] [Google Scholar]
- 15.Lunetta KL, Boehnke M. Multipoint radiation hybrid mapping: comparison of methods, sample size requirements, and optimal study characteristics. Genomics. 1994;21:92–103. doi: 10.1006/geno.1994.1229. [DOI] [PubMed] [Google Scholar]
- 16.Lunetta KL, Boehnke M, Lange K, Cox DR. Experimental design and error detection for polyploid radiation hybrid mapping. Genome Res. 1995;5:151–163. doi: 10.1101/gr.5.2.151. [DOI] [PubMed] [Google Scholar]
- 17.Matise TC, Wasmuth JJ, Myers RM, McPherson JD. Somatic Cell Genetics and Radiation Hybrid Mapping. In: Birren B, Green ED, Klapholz S, Myers MR, Roskams J, editors. Genome analysis. 1999. pp. 259–296. [Google Scholar]
- 18.Stewart EA, et al. An STS-based radiation hybrid map of the human genome. Genome Res. 1997;7:422–433. doi: 10.1101/gr.7.5.422. [DOI] [PubMed] [Google Scholar]
- 19.Murphy WJ, et al. A radiation hybrid map of the cat genome: implications for comparative mapping. Genome Res. 2000;10:691–702. doi: 10.1101/gr.10.5.691. [DOI] [PMC free article] [PubMed] [Google Scholar]
- 20.Raudsepp T, et al. Conservation of gene order between horse and human X chromosomes as evidenced through radiation hybrid mapping. Genomics. 2002;79:451–457. doi: 10.1006/geno.2002.6723. [DOI] [PubMed] [Google Scholar]
- 21.Warburton PE. Chromosomal dynamics of human neocentromere formation. Chromosome Res. 2004;12:617–626. doi: 10.1023/B:CHRO.0000036585.44138.4b. [DOI] [PubMed] [Google Scholar]
- 22.Armengol L, et al. Murine segmental duplications are hot spots for chromosome and gene evolution. Genomics. 2005;86:692–700. doi: 10.1016/j.ygeno.2005.08.008. [DOI] [PubMed] [Google Scholar]
- 23.Armengol L, Pujana MA, Cheung J, Scherer SW, Estivill X. Enrichment of segmental duplications in regions of breaks of synteny between the human and mouse genomes suggest their involvement in evolutionary rearrangements. Hum Mol Genet. 2003;12:2201–2208. doi: 10.1093/hmg/ddg223. [DOI] [PubMed] [Google Scholar]
- 24.Bailey JA, Baertsch R, Kent WJ, Haussler D, Eichler EE. Hotspots of mammalian chromosomal evolution. Genome Biol. 2004;5:R23. doi: 10.1186/gb-2004-5-4-r23. [DOI] [PMC free article] [PubMed] [Google Scholar]
- 25.Chowdhary BP, et al. Construction of a 5000(rad) whole-genome radiation hybrid panel in the horse and generation of a comprehensive and comparative map for ECA11. Mamm Genome. 2002;13:89–94. doi: 10.1007/s00335-001-2089-8. [DOI] [PubMed] [Google Scholar]
- 26.Sambrook DWRJ. Molecular Cloning: A Laboratory Manual. New York: Cold Spring Harbor Laboratory Press; 2001. Preparation and analysis of eukaryotic genomic DNA. 2001. [Google Scholar]
- 27.Froenicke L, Anderson LK, Wienberg J, Ashley T. Male mouse recombination maps for each autosome identified by chromosome painting. Am J Hum Genet. 2002;71:1353–1368. doi: 10.1086/344714. [DOI] [PMC free article] [PubMed] [Google Scholar]
Associated Data
This section collects any data citations, data availability statements, or supplementary materials included in this article.


