

Abstract
The Microphthalmia-associated transcription factor (Mitf) is an essential basic helix-loop-helix leucine zipper transcription factor for mast cell development. Mice deficient in Mitf harbor a severe mast cell deficiency, and Mitf-mutant mast cells cultured ex vivo display a number of functional defects. Therefore, an understanding of the genetic program regulated by Mitf may provide important insights into mast cell differentiation. Multiple, distinct isoforms of Mitf have been identified in a variety of cell types; we found that Mitf-a, Mitf-e, and Mitf-mc were the major isoforms expressed in mast cells. To determine the physiologic function of Mitf in mast cells, we restored expression of these isoforms in primary mast cells from Mitf−/−mice. We found that these isoforms restored granular morphology and integrin-mediated migration. By microarray analysis, proteases, signaling molecules, cell surface receptor, and transporters comprised the largest groups of genes up-regulated by all isoforms. Furthermore, we found that isoforms also regulated distinct genes sets, suggesting separable biological activities. This work defines the transcriptome regulated by Mitf in mast cells and supports its role as master regulator of mast cell differentiation. Expression of multiple isoforms of this transcription factor may provide for redundancy of biological activities while also allowing diversity of function.
Mast cells are central effectors of allergic and hypersensitivity reactions (1). Mast cells have also been implicated in the pathogenesis of a variety of other diseases such as rheumatoid arthritis (2), congestive heart failure (3), and multiple sclerosis (4). Although mast cells have the capacity to promote diverse pathologic states, they also participate in normal physiologic processes, such as innate immunity against parasitic and bacterial infections (5, 6). These diverse functions may be regulated by distinct and shared pathways. A dissection of these pathways may allow selective regulation of these processes for therapeutic benefit.
A number of transcription factors play essential roles in mast cell development, including the zinc finger factors GATA-1 (7) and GATA-2 (8), the Ets family member PU.1 (9), and the helix-loop-helix leucine zipper factor, Microphthalmia-associated transcription factor (Mitf)4 (10, 11). These factors regulate sets of genes, or transcriptomes, essential for the genetic program of differentiation and function of the mast cell. The central role that Mitf plays in mast cell development is clearly demonstrated by the phenotype of mice with mutations in Mitf. Mitf mutant mice are deficient in the mast cells that populate the skin and peritoneum; furthermore, primary mast cells cultured from these animals harbor a number of functional defects ex vivo. In addition, Mitf mutant mast cells are deficient in a number of genes that encode for proteins that participate in biologically important processes, including proteases (12–15), adhesion molecules (16, 17), metabolic enzymes (15, 18, 19), and growth factor receptors (20, 21). Thus, a comprehensive understanding of the gene program regulated by Mitf in mast cells, or the Mitf transcriptome, can lead to important insights into mast cell biology.
To date, nine distinct isoforms of Mitf have been identified (22). These isoforms arise from an alternative splicing event that joins a unique first exon with the common body of the gene. The resulting proteins possess distinct amino termini, but share transactivation, DNA binding, and dimerization motifs. The expression of alternatively spliced transcripts may be controlled by distinct promoter/enhancer elements, allowing for differential regulation of isoforms. Furthermore, transcripts that encode for unique proteins species may possess distinct biological functions. Alternative splicing of mRNA transcripts is a widespread mechanism for generating diversity in multicellular organisms. Thirty-five to 65% of human genes are predicted to undergo alternative splicing, the majority of which encode for distinct protein species (23). This mechanism is particularly widespread in complex systems such as the immune system (24). The genomic organization of the Mitf locus allows for highly regulated, tissue-selective expression of each isoform. However, cell-restricted isoforms may also exhibit distinct functions, a feature that may further expand the functional diversity of the Mitf gene.
Mitf is essential for the development of a diverse array of tissue types other than mast cells, including osteoclasts, melanocytes, and retinal pigmented epithelium. Two Mitf isoforms have been shown to display a cell-restricted pattern of expression (22): the Mitf-mc (25) isoform identified in mast cells and the Mitf-m (26, 27) iso-form expressed in melanocytes. These isoforms possess identical functional domains including the transactivation, the DNA-binding basic domain, and the helix-loop-helix leucine zipper dimerization domain. They differ only by the presence of unique amino-terminal domains. Despite these shared motifs, we have previously shown that these two isoforms display a differential capacity to transactivate gene targets in reporter assays (25). This finding suggests that Mif isoforms may regulate distinct gene targets in vivo.
Prior studies have identified several important Mitf gene targets by comparing wild-type mast cells to either Mitf null or Mitf dominant-negative mast cells. The expression of some of these genes are selectively impaired in the Mitf dominant-negative and not in Mitf null mast cells, a finding that suggests that the genes reported in these studies may also be regulated by factors other than Mitf. None of these studies have examined the shared and differentially expressed gene targets of the physiologically expressed Mitf isoforms in mast cells. A comprehensive examination of the transcriptome of the in vivo-expressed Mitf isoforms in mast cells has not been reported and may provide important knowledge about the true biologic function of Mitf. Thus, the aim of this study was to investigate the role of Mitf isoforms in mast cell development. To address this question, we first determined the Mitf isoforms expressed in mast cells. We then restored the expression of the mast cell-expressed Mitf isoforms into Mitf−/− primary mast cells and examined their capacity to restore Mitf-dependent function. We determined the transcriptome of these Mitf isoforms by microarray analysis, and identified the common and distinct gene sets that they regulate. The expression of physiologically important genes were verified by quantitative PCR analysis.
Materials and Methods
Animals
The vga9 mice were provided by Dr. D. Fisher (Dana-Farber Cancer Institute, Boston, MA). These mice harbor a transgene of the vasopressin-β galactosidase that disrupts the 5′genomic locus of the Mitf gene (27). These mice do not express Mitf at the protein and RNA level. These mice are bred on a C57BL/6 background. Four- to 8-wk-old vga9/vga9 (Mitf−/−) mice and wild-type littermates (Mitf+/+) were used to obtain splenocytes and bone marrow. Mice were maintained in the Johns Hopkins University Animal Facilities in accordance with institutional guidelines.
Cells
Murine embryonic stem cells were differentiated into mast cells according to the method described by Tsai et al. (28) with minor modifications. Briefly, strain 129v murine embryonic stem cells were grown on a feeder layer of mitomycin-treated mouse embryonic fibroblasts in DMEM (In-vitrogen Life Technologies) supplemented with 15% ES grade FBS (HyClone), 1% penicillin/streptomycin and glutamine, 100 μM 2-ME, 1 mM sodium pyruvate, 1% nonessential amino acids (Invitrogen Life Technologies), and 100 U/cc mouse recombinant leukemia inhibitory factor (Chemicon International). Embryonic stem cells were adapted to IMDM (Invitrogen Life Technologies) with supplements as listed above and grown on 0.2% gelatin-coated plates before differentiation. To differentiate embryonic stem cells, 5000 cells were plated on bacterial-grade petri dishes in 1.5 cc of IMDM with 0.9% methycellulose (StemCell Technologies) supplemented with 15% ES grade FBS, 1% penicillin/streptomycin and glutamine, 434 μM monothioglycerol, 1 mM sodium pyruvate, 1% non-essential amino acids, with 50 ng/cc stem cell factor (SCF) and 5 ng/cc IL-11. After 1 wk, developing embryoid bodies were supplemented with culture medium containing 60 ng/cc SCF, 30 ng/cc mouse rIL-3, and 30 ng/cc IL-6. At wk 2 of culture, embryoid bodies were transferred to tissue culture flasks and allowed to differentiate in DMEM supplemented with 10% FCS, 1% penicillin/streptomycin and glutamine as well as 20% WEHI supernatant, and 50 ng/cc SCF. Bone marrow-derived mast cells (BMMC) were derived from 4- to 8-wk-old Mitf+/+ and Mitf−/− mice. Bone marrow obtained from femurs and tibias and splenocytes obtained from spleens from these mice were cultured in DMEM with 10% FCS supplemented with 1% penicillin/streptomycin and glutamine as well as 20% WEHI supernatant and 50 ng/cc mouse recombinant SCF as described previously (25). Peritoneal mast cells were isolated from 4- to 8-wk-old Mitf+/+ mice. A total of 10 cc of PBS was injected into the peritoneal cavity and aspirated. The cell suspension was then layered on a 17.5% NycoPrep gradient (Axis-Shield) and centrifuged at 400 × g for 20 min. The cell pellet was enriched for peritoneal mast cells and was expanded for 2 wk in DMEM supplemented with 10% FCS, 1% penicillin/streptomycin and glutamine as well as 10 ng/cc IL-3, and 50 ng/cc SCF. Intestinal mast cells were obtained as described previously (29). Briefly, small intestines were removed from 4- to 8-wk-old Mitf+/+mice and flushed with 40 –50 cc of HBSS. The intestines were opened and rinsed with HBSS, finely chopped with a razor blade, and then enzymatically digested in 30 cc of RPMI 1640 (Invitrogen Life Technologies) with 10% FBS with 1 mg/cc collagenase IV (Worthington). Three enzymatic digestions were done at 37°C with shaking for 20 min. The cell suspension was pelleted and resuspended in 44% Percoll (Sigma-Aldrich), underlayed with a 67% Percoll layer, and centrifuged at 400 × g for 20 min. Cells at the interface were collected, washed, and expanded for 3 wk in DMEM supplemented with 10% FCS, 1% penicillin/streptomycin and glutamine as well as 10 ng/cc IL-3, and 50 ng/cc SCF. All cytokines were mouse recombinant products obtained from R&D Systems.
Plasmids
The pMMP-IRES-puro was constructed from the pMMP retrovirus (30) (donated by Dr. R. Mulligan, Harvard Medical School, Boston, MA). The puromycin N-acetyltransferase (streptomyces) gene that encodes puromycin resistance (599 bp) was amplified by PCR with a SmaI site engineered at the 5′end and an Age1 site engineered at the 3′end. The puromycin N-acetyltransferase PCR insert was subcloned into the SmaI/Age1 site of pIRES-EGFP (Clontech). Thus, the puromycin resistance gene was placed downstream of the IRES element. The IRES-puromycin resistance cassette (IRES-puro) was released from the pIRES-EGFP backbone with BamH1 and Age1. The overhanging ends were filled in with Klenow. The pMMP backbone was cut with BamH1, and the overhanging ends were filled in with Klenow, then dephosphorylated with calf intestinal phosphatase. The IRES-puro cassette was blunt end cloned into the pMMP backbone. Mitf isoforms were constructed by releasing the full-length cDNA of Mitf isoforms from pEBB-Mitf (25) with NcoI and inserting them into the NcoI site of pMMP-IRES-puro. These fragments contain a hemagglutinin amino-terminal tag. All constructs were verified by DNA sequencing.
Retroviral transduction of BMMCs
Retrovirus was produced by the method as described by Ory et al. (31). The 293GPG cell line was grown in 15-cm tissue culture plates with DMEM supplemented with 10% FBS and 1% penicillin/streptomycin and glutamine and 1 μg/cc doxycycline. The 293GPG cell line was transfected with 25 μg of pMMP-IRES-puro-Mitf and 75 μg of FuGENE 6 (Invitrogen Life Technologies). Medium was replaced daily and doxycycline was removed to induce expression of VSV-G. Supernatant was collected on days 4 – 8 after transfection. Retrovirus was concentrated by centrifuging supernatant at 26,000 × g in an ultracentrifuge for 1.5 h. Concentrated retrovirus was resuspended in TEN buffer overnight at 4°C. BMMCs were cultured from bone marrow cells and splenocytes that were obtained from Mitf+/+mice and Mitf−/− mice as outlined above. After 1–2 wk in culture, 2 × 10⁶ cells per cc from Mitf−/− mice were transduced with concentrated retrovirus (100 –200 mcl) with 8 μg/cc polybrene, for ~ 24 h. Retroviral transduction was repeated twice, after which cells were resuspended in fresh medium. After 2–3 days in culture, 2 μg/cc puromycin was added and maintained in culture to select for stably transduced cells.
Flow cytometry
All flow cytometry was performed on the FACScan with CellQuest software (BD Biosciences). For Ab labeling, cells were washed with PBS and 2% FBS. Low-affinity Fcε and -γreceptors were first blocked with anti-CD23 Abs (B3B4; BD Pharmingen) and anti-CD16/32 (2.4G2; BD Pharmingen) at 10 μg/cc for 15 min on ice. Staining for α4 integrin was done with FITC-labeled Abs to VLA4 (clone P2/2; Chemicon International) at 10 μg/cc for 15 min on ice. Staining for c-Kit was done with biotin-labeled Abs (clone 2B8; BD Pharmingen) at 15 μg/cc for 15 min on ice. Labeling was then done with quantum Red streptavidin (Sigma-Aldrich).
Integrin-directed migration (haptotaxis) assay
Haptotaxis assays were performed as described previously (32). Briefly, Transwell chambers (Costar) were coated with RetroNectin (Takara). RetroNectin is a chimeric peptide of human fibronectin. Mitf+/+, Mitf−/−, and retrovirally transduced Mitf−/− BMMCs were removed from SCF and maintained in IL-3 for 48 h before assay. Equal numbers of cells were aliquoted in fibronectin-coated Transwell chambers. Cells were plated on BSA-coated chambers for a negative control. The chambers were immediately placed within the wells of 24-well plates containing medium with or without SCF. Plates were incubated for 4 – 8 h at 37°C with 5% CO2. The chambers were removed and washed with PBS. Cells remaining on the inner surface of the chambers were removed using a Q-Tip. The cells that migrated to the opposite side of the plate were stained with crystal violet stain and counted using an inverted microscope at X40 magnification. The total number of cells from 20 fields was counted, and the average number of cells per field was determined. Experiments were performed in triplicates and on three separate occasions.
Microarray expression profiling and data analysis
Messenger RNA was collected from Mitf+/+, Mitf−/−, and retrovirally transduced Mitf−/− BMMCs that were cultured in IL-3 and SCF for 8 –12 wk. The mRNA samples were submitted to Johns Hopkins Hospital Microarray core facility, and expression profiling was performed using Affymetrix MOE430A Chips. To estimate the gene expression signals, data analysis was conducted on the chips’ CEL file probe signal values at the Affymetrix probe pair (perfect match probe and mismatch probe) level, using the statistical technique GCRMA (Robust Multiarray Analysis Using GC content for Background adjustment) (33, 34) with the bioconductor package gcrma available at www.bioconductor.org. This probe level data processing includes a normalization procedure using quantile normalization (35) to reduce the obscuring variation between microarrays, which might be introduced during the processes of sample preparation, manufacture, fluorescence labeling, hybridization, and/or scanning. With the signal intensities estimated above, an empirical Bayes method with the γ-γ modeling, as implemented in the R package EBarrays, was used to estimate the posterior probabilities of the differential expression of genes between Mitf−/− BMMCs, which were transduced with individual Mitf isoforms and Mitf−/− cells that were transduced with the vector control (36–38). The criterion of the posterior probability >0.5, which means the posterior odds favoring change, was used to produce the differentially expressed gene lists. All computation was performed under R environment, and all bioconductor packages are available at www.bioconductor.org. This method was also used to estimate the probabilities of differentially expressed genes between Mitf+/+ and Mitf−/− BMMCs.
The microarray experiments were performed twice on mRNA obtained from two separate retroviral transductions. Data from the two experiments were pooled to obtain the differentially expressed probe sets between Mitf isoform-expressing cells and vector-transduced cells. Probe sets that were up-regulated by Mitf isoforms compared with the vector alone were identified and annotated with the GeneSpring software (Agilent Technologies). The resulting lists of annotated genes were visually inspected, and duplicates were removed. Probe sets that were differentially regulated between Mitf+/+ and Mitf−/− cells were also identified; genes up-regulated by Mitf isoforms that were also up-regulated in Mitf−/− cells were removed from the list. The Venn diagram analysis of overlapping and unique gene sets was performed with the GeneSpring software. Gene function was annotated visually as well as with GeneSpring software and EASE software (39). Using the EASE software, genes were grouped based on biological function using the gene ontogeny program level 3. Unique gene lists for each of the isoforms, Mitf-mc, Mitf-e, and Mitf-a, were identified using the GeneSpring software program. These lists, which include GenBank accession number and the average fold increase of signal intensity compared with vector, can be found in the supplemental material.5
Quantitative real-time PCR
RNA was harvested from cells with TRIzol (Invitrogen Life Technologies), and cDNA was made with the first-strand synthesis kit (Invitrogen Life Technologies). One to 5 μg of RNA was used as starting material for synthesis. Conventional PCR for Mitf isoforms was performed with primers and conditions as described previously (25). Real-time quantitative PCR was performed using a SYBR Green mix (Bio-Rad) on an iQ5 multicolor Real-Time PCR Detection System (Bio-Rad). Primers were optimized for temperature and were used at a concentration of 200 nM. Primer sequences and melting temperatures are as follows: αE integrin sense 5′AAC GGA GGG TCC TTT CTG TGT GAA and antisense 5′-TGG ATC TCA GCG ATG CAG AAC ACT (Tm 60); α4 integrin sense 5′-CGC TGT GGA CCT CAA TGC and antisense 5′-GTC AAT GTC GCC AAG ATT CG (Tm 55); β -actin sense 5′GTG ACG AGG CCC AGA GCA AGA G and antisense 5′-AGG GGC CGG ACT CAT CGT ACT C (Tm 55); cathepsin G sense 5′-GCC TCT CCT GCT CCT GTT G and antisense 5′-AGT TGC TGG GTC CTT TCT CG (Tm 55); c-kit sense 5′-CCT CAG CCT CAG GAC ATAGC and antisense 5′-GAA CAC TCC AGA ATC GTC AAC TC (Tm 55); SgIGSF sense 5′-AAG GCA AAT CAG AGG TGG AGG AGT and antisense 5′-TCA CCC AAG TTA CCA TCA CAG GCT (Tm 55); mouse mast cell protease (mMCP)-1 sense 5′-CAC TTC TCT TGC CTT CTG and antisense 5′-ATT CAC TCT TGC TCA CAT C (Tm 55); mMCP-2 sense 5′-GCA AAA TGC AGG CCC TAC TA and antisense 5′-GTG TGC AGC AGT CAT CAC AA (Tm 55); mMCP-4 sense 5′-GCC AAA GAG ACT CCC TCT GTG ATT and antisense 5′-GCA TCT CCG CGT CCA TAA GAT ACA (Tm 55); mMCP-5 sense 5′-CAC TGT GCG GGA AGG TCT ATA ACA and antisense 5′-TT ACT TCC TGC AGT GTG TCG GAG (Tm 60); mMCP-6 sense 5′-GCC TCT CCC ACC TCC TTA TC and antisense 5′-TCA GCG GTG AAG AGT GTG AC (Tm 60); mMCP-8 sense 5′-ATG TTC CTG CTC CTG GTC CT and antisense 5′-CCA TTA CAG TGA GCT GCT GT (Tm 55); RSK sense 5′-GAT GCT GAG TAT GCT GTG AAG and antisense 5′-GTC CTG GCG ATG GTA TAG AG (Tm 55); Src-like adapter protein (SLAP) sense 5′-ATC TCA CCA AGG CTC ACC TTC CAA and antisense 5′-TGC TTT CCC GAA GAC CAT AGC TGA (Tm 55). Relative quantification of mRNA was determined by the 2−ΔΔCT (cycle threshold) method (40). β -Actin was used for an internal control, and relative expression was normalized to the Mitf−/− cells so that ΔΔCt = (Cttarget gene –β -actin) –(CtMitf−/− – Ctβ actin) Experiments were performed in triplicate and repeated at least twice. Data are from a representative experiment.
Results
Identification of Mitf isoforms expressed in mast cells
To determine the Mitf isoforms expressed in mast cells, we examined Mitf expression in mast cells derived from several tissue sources by RT-PCR (Fig. 1, A and B). We found that three Mitf isoforms were predominantly expressed in mast cells: the mast cell isoform (Mitf-mc), the e-isoform (Mitf-e), and the a-isoform (Mitf-a). These isoforms were strongly expressed in primary BMMC, in vitro-differentiated mast cells from murine embryonic stem cells, and mast cells derived from the small intestine. We previously identified Mitf-mc from mast cells (25) and its expression has been shown to be mast cell-specific (22). Mitf-e was also originally identified from mast cells (41) and is highly expressed in mast cells, but also in other selected cell types (22). The Mitf-a isoform is widely expressed in many tissues. Using the in vitro mast cell differentiation system, we found that Mitf-e and Mitf-mc expression commenced with the appearance of morphologically identifiable mast cells in wk 3 and 4 (Fig. 1A). In contrast, the ubiquitously expressed isoform, Mitf-a, was expressed from the beginning of culture and was maintained throughout differentiation. Mitf-mc, Mitf-e, and Mitf-a were also detected in primary BMMCs, intestinal mast cells, and the mast cell line, C57 (Fig. 1B). The intestinal mast cells also expressed the heart isoform. The melanocyte and the heart isoforms were not detected in BMMCs or embryonic stem cell-derived mast cells. Interestingly, Mitf was detected from peritoneal mast cells with PCR primers to the common Mitf sequence (25), but specific Mitf isoform expression was not found.
FIGURE 1.

Mitf isoform expression in mast cells. A, RT-PCR analysis of in vitro-differentiated mast cells from murine embryonic stem cells shows expression of the mast cell isoform (mast), e-isoform (E-form), and a-isoform (A-form). Wright-Geimsa stain of cytospin preparations from differentiated cells at weekly time points above (original magnification, X60). Mast cell isoform and e-isoform expression is detectable with the appearance of morphologically identifiable mast cells at wk 3 and wk 4. B, RT-PCR analysis of specific Mitf isoforms from various tissue sources. Primary bone marrow-derived wild-type (Mitf+/+) mast cells (1°BMMC), intestinal mast cells, and the mast cell line, C57, show expression of mast cell, e- and a-isoforms. The heart isoform is also detected from intestinal cells. The melanoma cell line (B16), macrophage cell line (RAW), and heart tissue are used for controls for the heart, melanocyte, and a-isoforms. Specific isoforms are not detected from peritoneal mast cells, and no Mitf expression is detectable from Mitf−/− BMMCs. C, Schematic representation of protein domains of the Mitf isoforms expressed in mast cells show the unique amino-terminal domains of the mast cell isoform (▤, 43 aa) and the a-isoform (▨, 35 aa). The contiguous B-domain (
 , 83 aa) is shared between mast cell and a-isoform. The e-isoform harbors a truncated B domain amino terminus (66 aa). All isoforms share the transactivation domain (TAD), as well as the DNA binding basic domain and helix-loop-helix leucine zipper dimerization motif (b-hlh-zip).
The Mitf-a and Mitf-mc isoforms differ only by their unique amino termini. Contiguous with these unique domains is the B-domain, which is common to both isoforms. The Mitf-e isoform essentially harbors a truncated B domain at its amino terminus. All isoforms share the functional transactivation, DNA binding, and dimerization motifs (Fig. 1C). Given our previous findings in vitro that suggested preferential gene target specificity between isoforms, we next addressed whether these isoforms regulated distinct biological functions in vivo.
Restoration of Mitf isoforms into Mitf−/− mast cells
Mitf-mc was previously shown to differentially activate gene target promoters when compared with Mitf-m in luciferase reporter assays (25). This finding prompted the question of whether Mitf isoforms regulated distinct gene targets, and thus possessed distinct biologic functions in vivo. To address this question, we restored individual Mitf isoform expression into Mitf−/− primary mast cells with the pMMP-IRES-puro retrovirus as described in Material and Methods. We estimate that ~30% of cells were transduced. After 2–3 wk in culture with puromycin, stable selectants were expanded; these selectants sustained Mitf expression that was readily detectable by Western blot (Fig. 2).
FIGURE 2.
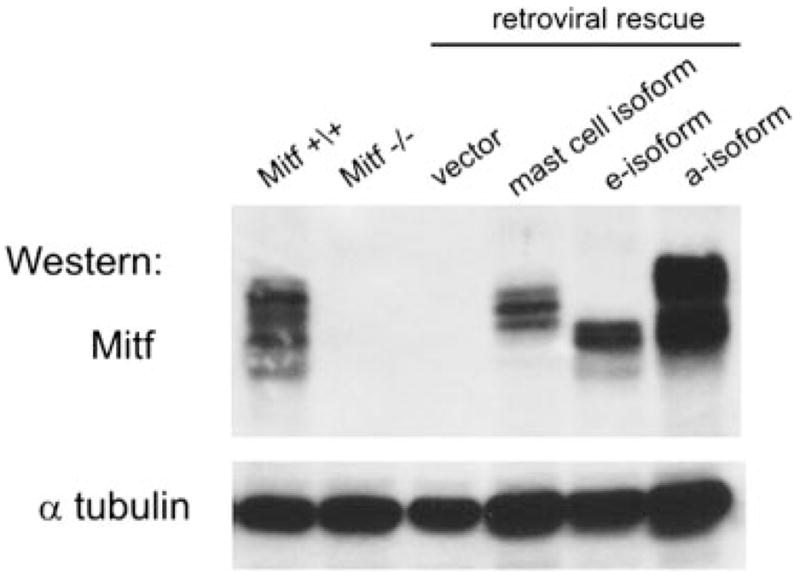
Restoration of Mitf isoform expression in Mitf−/− BMMCs. Mitf−/− BMMCs were transduced with modified pMMP retroviruses that express the mast cell isoform (Mitf-mc), the e-isoform (Mitf-e), and the a-isoform (Mitf-a) (e-isoform). Transduced cells were stably selected in puromycin. The Western blot analysis shows protein expression of each of the individual Mitf isoforms and the vector control. Protein expression in wild-type (Mitf+/+) and Mitf−/− BMMCs are also shown. The Western blot for anti-tubulin (α tubulin) expression demonstrated comparable loading of samples.
Mitf isoforms restore granular morphology of Mitf−/− mast cells
Mitf null mast cells display a number of phenotypic abnormalities. We have observed that BMMCs from Mitf−/− cultured in IL-3 and SCF are hypogranular. Differences in granularity can be appreciated by staining with toluidine blue and by measuring side scatter (SSC) with flow cytometry. High signal intensity detected by SSC indicates increased granularity. Mitf +/+ mast cells display heterogeneity in the degree of granularity that can be demonstrated by morphologic assessment of toluidine blue staining as well as a wide range of signal by SSC measurements (Fig. 3, A and B). In contrast, Mitf null mast cells are relatively hypogranular with less toluidine blue staining and low SSC signal. We examined the morphologic changes of Mitf−/− BMMCs expressing the individual Mitf isoforms, Mitf-mc, Mitf-e, and Mitf-a. By SSC analysis on flow cytometry, the heterogenous granular phenotype was restored by all Mitf isoforms. However, by toluidine blue staining, the granules appeared most prominent in cells expressing the Mitf-mc and Mitf-a isoforms. We also observed that the mast cells expressing the Mitf-e isoform were more adherent to the cell culture flask during culture (data not shown). In addition, a proportion of the cells expressing the Mitf-e was larger as demonstrated by an increase in cells with higher forward scatter signal.
FIGURE 3.

Correction of hypogranular phenotype by Mitf isoform expression in Mitf−/− mast cells. A, Toluidine blue stains of cytospin preparations of wild-type (Mitf+/+) and Mitf−/− BMMCs demonstrate the hypogranular phenotype of Mitf−/− cells. BMMCs expressing the mast cell isoform (Mitf-mc), the e-isoform (Mitf-e), and the a-isoform (Mitf-a) demonstrate restoration of the granular phenotype by all isoforms, but most notably by the mast cell and a-isoform. Magnification at X60. B, Flow cytometry analysis demonstrates heterogeneous granule expression by the wide range of SSC signal in Mitf +/+ cells. All Mitf isoforms restore heterogenous granule expression as shown by SSC signal. FSC denotes forward scatter, which is a measure of cell size.
Mitf isoforms rescue integrin-directed migration
Mitf−/− mast cells display impaired adhesion to fibroblasts (42). We examined the capacity for Mitf isoforms to restore integrin-directed (haptotactic) binding to fibronectin. This function has been shown to be dependent on both SCF and the integrin α4 β1 (32). Fig. 4 shows that Mitf +/+ cells migrate and bind to fibronectin in the presence of SCF. In contrast, Mitf−/− mast cells do not migrate and bind to fibronectin despite SCF treatment. Expression of the Mitf-mc, Mitf-e, and Mitf-a isoforms restores this capacity for SCF-dependent haptotaxis. No significant difference was seen in the degree of haptotaxic function between isoforms.
FIGURE 4.
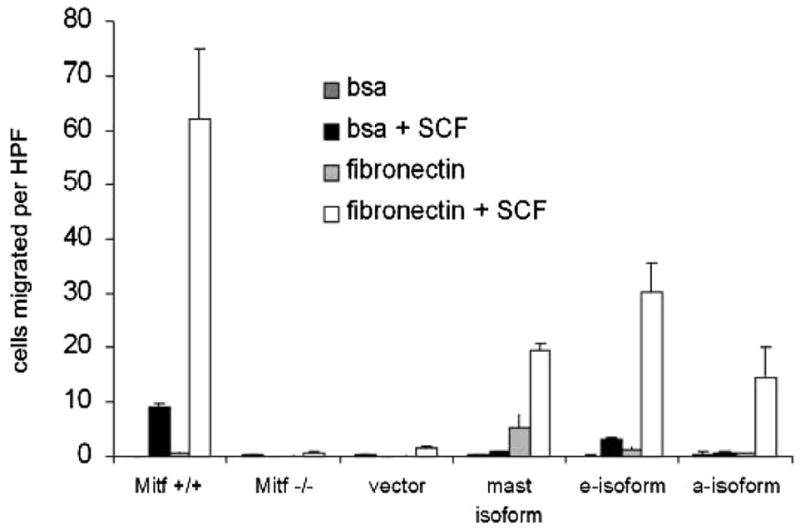
Mitf isoforms restore SCF-directed migration in Mitf−/− cells. BMMCs were placed in Transwell chambers coated with fibronectin or BSA as a control (described in Material and Methods). Chambers were placed in medium with or without SCF. Migration and binding to fibronectin was quantified by counting adherent cells on an inverted microscope at X40 and indicated on y-axis by cells migrated per HPF (high-powered field). In wild-type cells (Mitf+/+), binding to fibronectin was dependent on SCF treatment (□); in Mitf−/− cells, binding was severely impaired. Expression of the mast cell isoform (Mitf-mc), the e-isoform (Mitf-e), and the a-isoform (Mitf-a) restored SCF-dependent binding. Data are expressed as the mean result of experiments performed in triplicate. Error bars indicate SD.
Mitf isoforms regulate shared and distinct transcriptomes in mast cells
Analysis of granule expression and SCF-dependent migration suggested both shared and distinct biological activities of Mitf isoforms. To more comprehensively evaluate the potential functions of Mitf in mast cells, we examined the direct and indirect targets of individual Mitf isoforms by microarray analysis using the Affymetrix MOE430A chips. We identified gene sets that were up-regulated in Mitf isoform-expressing cells compared with the vector-transduced cells, and compared these sets for overlapping and distinct genes. These gene sets comprise the transcriptomes of the Mitf isoforms in mast cells. The Venn diagram shown in Fig. 5 demonstrates that a number of genes (57) were commonly up-regulated by all isoforms. However, each of the individual Mitf isoforms also regulated a unique set of genes (104 genes for Mitf-a, 80 genes for Mitf-mc, and 52 genes for Mitf-e).
FIGURE 5.

Microarray analysis of BMMCs expressing Mitf isoforms. Gene sets that were up-regulated by individual Mitf isoforms compared with the vector control were identified by microarray analysis using the Affymetrix MOE430A chips, which contain probe sets for 22,223 genes. The Venn diagram shows the number of shared and unique gene sets regulated by the Mitf isoforms. Probe sets were annotated with the GeneSpring software. The shared genes (white) are listed in Table I. Unique gene sets are available in the supplemental material.
The 57 genes commonly regulated by all three Mitf isoforms expressed in mast cells were grouped into classes based on function assigned by visual inspection and by the gene ontogeny tools that are part of the GeneSpring and the EASE software (39) (http://david.niaid.nih.gov/david/ease.htm). This gene set comprises the transcriptome regulated by Mitf and represent both direct and indirect gene targets (Table I). The largest group represented was proteases (8 genes), followed by cell surface receptors and transporters (7 genes). We also identified a large number of signaling molecules and cell adhesion proteins (6 genes each). Of this common set of 57 genes, 21 were confirmed to be up-regulated in Mitf +/+ mast cells as well. Several of the genes within this list had been identified previously as Mitf target genes, including the proteases mMCP-4 (12), mMCP-5 (13), mMCP-6 (14), granzyme B (15), and the adhesion molecule, SgIGSF4 (16). However, a number of potential novel and physiologically significant genes were also identified including the proteases mMCP-2 and mMCP-8, the signaling molecules ribosomal S6 kinase (RSK), SLAP, the chemokine ligands C-C 2, 3, 7, and the platelet-derived growth factor α.
Table I.
Mitf transcriptome: genes regulated by all Mitf isoformsa
| GenBank Accession No. | Genes Up-Regulated by All Isoforms | GenBank Accession No. | Genes Up-Regulated by All Isoforms |
|---|---|---|---|
| Proteases (8) | AV231288 | N-sulfoglucosamine sulfohydrolase (sulfamidase) | |
| NM_008571# | mMCP-2 | BB829192# | Sialyltransferase 9 (CMP-NeuAc:lactosylceramide α-2,3-sialyltransferase) |
| BC026198*# | mMCP-4 | ||
| NM_010780*# | mMCP-5 | AK002700# | RIKEN clone:0610030E04 product:sulfotransferase family 1A, phenol-preferring, member 1 |
| NM_010781*# | mMCP-6 | ||
| NM_008572 | mMCP-8 | ||
| NM_012034 | Tryptase γ 1 | Chemokine/growth factor (4) | |
| NM_013542* | Granzyme B | AF065933# | Chemokine (C-C motif) ligand 2 |
| X78543# | Mus musculus MCP-Y1 mRNA, serine protease pseudogene | NM_011337 | Chemokine (C-C motif) ligand 3 |
| AF128193 | Chemokine (C-C motif) ligand 7 | ||
| Receptor/transporter (7) | NM_008808# | Platelet derived growth factor, α | |
| NM_010188 | Fc receptor, IgG, low-affinity III | Protein cross-linking (3) | |
| BC003476 | Ia-associated invariant chain | NM_028784 | Coagulation factor XIII, α subunit |
| NM_009779 | Complement component 3a receptor 1 | BC016492 | Transglutaminase 2, C polypeptide |
| BB041811 | RIKEN cDNA clone 6030458C10 3′similar to M55154 mouse transglutaminase (TGase) mRNA sequence | ||
| NM_016894# | Receptor (calcitonin) activity modifying protein 1 | ||
| X83934 | Ryanodine receptor 3 | Oxidative stress (3) | |
| NM_022026 | Aquaporin 9 | NM_008161 | Glutathione peroxidase 3 |
| NM_009303# | Synaptogyrin 1 | BC025936 | Similar to cytochrome P450, 4a10 |
| Signaling (6) | AW321975 | Mus musculus transcribed sequence with weak similarity to protein pir:A39045 protein- glutamine γ-glutamyltransferase (EC 2.3.2.13) 2, splice form 1-human | |
| NM_009192# | SLAP | ||
| NM_011299# | RSK | ||
| NM_008152# | G-protein-coupled receptor 25 | ||
| AK002933# | Neurogranin | Apoptosis (2) | |
| BC013532 | Chromatin assembly factor 1, subunit B (p60) | AF201289# | Glucocorticoid-induced leucine zipper |
| AV238793 | Apoptosis, caspase activation inhibitor | ||
| NM_026523 | Neuromedin B | Iron transport (1) | |
| Cell adhesion (6) | AF440692 | Transferrin | |
| NM_021293# | CD33 Ag | Unknown function (12) | |
| X66083 | CD44 Ag | BC002232 | Dip3 β |
| BB832194*# | Ig superfamily, member 4 (SgIGSF4) | NM_008681# | N-myc downstream regulated 1 |
| BC022734 | N-acetylneuraminate pyruvate lyase | ||
| NM_010796 | Macrophage galactose N-acetyl- galactosamine specific lectin 1 | BC027314 | DNA segment, Chr 17, human D6S56E 5 |
| BC025823 | cDNA sequence BC011467 | ||
| BM241485 | Expressed sequence AI595338 | ||
| NM_020001 | C-type (calcium dependent, carbohydrate recognition domain) lectin, superfamily member 10 | BB026027 | RIKEN cDNA 2210023K21 gene |
| NM_133187# | RIKEN cDNA 1110032E23 gene | ||
| BC004065 | Mus musculus, clone IMAGE:3590633, mRNA, partial cds | ||
| NM_007644 | Scavenger receptor class B, member 2 | BB233088 | RIKEN cDNA clone A630041P16 3′similar to L24118 mouse primary response gene B94 mRNA, 3′end, mRNA sequence |
| Metabolism (5) | |||
| NM_016893 | Fucosyltransferase 8 | BI106458 | RIKEN clone: C130061L11 |
| AK010101# | Galactosylceramidase | BI101050 | RIKEN clone:E030018G17 product: tensin |
Genes were annotated with GeneSpring and EASE software, as well as visually, and grouped into functional classes.
Previously identified Mitf gene targets.
Genes that were also up-regulated in wild-type BMMC compared to Mitf−/− cells.
We identified unique, nonoverlapping gene sets that were regulated by each of the individual Mitf isoforms, Mitf-e, Mitf-mc, and Mitf-a. The functions of these genes were annotated using the EASE gene ontogeny software (39) and grouped by biological activity (Table II). The largest categories of genes regulated by the two mast cell selective isoforms, Mitf-mc and Mitf-e, were those involved in cell growth and/or maintenance and protein metabolism. In contrast, the most abundant group regulated by the ubiquitously expressed Mitf-a isoform was comprised of genes involved in signal transduction. Visual inspection of the unique gene lists revealed some intriguing results. In the Mitf-e-expressing cells, the gene with the highest signal intensity was proliferin (223-fold increase). The function of proliferin is not well characterized, but it may play a role in hemopoietic stem cell expansion (43). Its expression and role in mast cells has not been described. The second most abundant gene was histocompatibility 2, class II Ag A, α (43-fold increase), which is involved in Ag presentation. In the gene list unique to Mitf-mc, the most highly expressed gene was the protease cathepsin G (supplemental material). We determined by quantitative PCR analysis that cathepsin G was also regulated by the other isoforms (Fig. 6), but to a lesser degree. We also found that the genes for myeloperoxidase, proteinase 3, and neutrophil elastase were on this list, which are genes that are commonly expressed in the neutrophil lineage. These gene sets are available in the supplemental material.
Table II.
Distinct Mitf isoform transcriptomes: functional classes of unique gene setsa
| Unique to Mitf-mc Category | Number | Unique to Mitf-e Category | Number | Unique to Mitf-a Category | Number |
|---|---|---|---|---|---|
| Cell growth and/or maintenance | 15 | Protein metabolism | 6 | Signal transduction | 12 |
| Protein metabolism | 14 | Cell growth and/or maintenance | 5 | Cell growth and/or maintenance | 11 |
| Biosynthesis | 9 | Catabolism | 4 | Protein metabolism | 10 |
| Nucleobase, nucleoside, nucleotide and nucleic acid metabolism | 8 | Cell adhesion | 3 | Phosphorus metabolism | 7 |
| Signal transduction | 7 | Signal transduction | 3 | Nucleobase, nucleoside, nucleotide and nucleic acid metabolism | 4 |
| Phosphorus metabolism | 6 | Unclassified | 18 | Organogenesis | 4 |
| Response to external stimulus | 6 | Response to external stimulus | 4 | ||
| Catabolism | 4 | Cell adhesion | 3 | ||
| Immune response | 3 | Electron transport | 3 | ||
| Response to stress | 3 | Unclassified | 29 | ||
| Unclassified | 20 |
Genes unique to individual isoforms grouped in functional categories using the EASE gene ontogeny software program.
FIGURE 6.

Mitf isoforms regulate protease gene expression. Quantitative PCR analysis of protease genes in Mitf isoform cells compared with vector alone, wild-type (Mitf +/+), and Mitf−/− cells. Expression is normalized to β-actin. All Mitf isoforms regulate the expression of mMCP-1, -2, -4, -5, -6, and granzyme B. mMCP-8 and cathepsin G are preferentially regulated by the mast cell and e-isoforms. Values (Relative Expression) are expressed as relative ratios to expression of Mitf−/− cells on the y-axis (described in Materials and Methods). Data are expressed as the mean result of experiments performed in triplicate. Error bars indicate SD.
Validation of Mitf gene targets
We used quantitative real-time PCR to validate potential Mitf gene targets. We chose to examine a number of previously described targets as well as potentially novel and physiologically important gene targets that were identified in our microarray analysis. Given the fact that proteases comprised the largest group of genes regulated by Mitf isforms, we quantified the expression of the mMCPs as well as the protease cathepsin G and the previously identified Mitf target granzyme B (15). We confirmed that the previously identified Mitf gene targets, mMCP-4, mMCP-5, mMCP-6, and granzyme B were up-regulated by all Mitf isoforms. However, we found that the potential novel targets, mMCP-1 and mMCP-2 also were up-regulated by all Mitf isoforms. In addition, two other proteases, mMCP-8 and cathepsin G, appeared to be selectively regulated by the mast cell-specific isoforms, Mitf-mc and Mitf-e (Fig. 6).
We also examined the expression of RSK and SLAP, two signaling molecules that were identified by the microarray analysis as potential novel Mitf gene targets. Fig. 7A shows that the expression of both RSK and SLAP were up-regulated by all three Mitf isoforms, concurring with the microarray data. We also examined the expression of c-Kit, which had been identified previously as a potential Mitf target gene (44). By quantitative PCR analysis, we found a 4-fold increase in expression between Mitf +/+ and Mitf−/− mast cells, and that c-Kit expression was restored to wild-type levels only by Mitf-a expression in mast cells. This pattern of c-Kit expression was also correlated at the protein level by flow cytometry. Mitf−/− cells expressed c-Kit on their surface, but at a lower intensity compared with Mitf +/+ mast cells. The Mitf-mc and Mitf-e cells expressed c-Kit at comparable levels to the Mitf−/− cells. In contrast, cells expressing Mitf-a restored c-Kit expression to wild-type levels (Fig. 7B).
FIGURE 7.

Mitf isoforms regulate genes involved in signaling. A, Quantitative PCR analysis of genes encoding signaling proteins in Mitf isoform-cells compared with vector alone, wild-type (Mitf +/+), and Mitf−/− cells. Expression is normalized to β-actin. All Mitf isoforms regulate the expression of RSK and SLAP. The receptor tyrosine kinase, c-Kit mRNA is increased about 4-fold in wild-type cells (+/+) compared with Mitf−/− cells; however, only the a-isoform restores c-Kit expression to wild-type levels. Values (Relative Expression) are expressed as relative ratios to expression of Mitf−/− cells on the y-axis (described in Materials and Methods). Data are expressed as the mean result of experiments performed in triplicate. Error bars indicate SD. B, Flow cytometry analysis for c-Kit protein expression shows a moderate impairment of c-Kit in Mitf−/− cells (dark line) compared with Mitf +/+ cells (shaded histogram). Only the a-isoform restores c-Kit expression to wild-type levels, consistent with quantitative PCR data. Dark shaded histogram denotes isotype Ab control.
A number of genes encoding proteins that regulate cell adhesion were also identified by the microarray analysis, including SgIGSF4, a previously identified Mitf gene target (16). Upon inspection of the genes common to the Mitf-mc and Mitf-e isoforms identified by microarray analysis, we also identified αE integrin, another protein with a role in cell adhesion. Quantitative real-time PCR confirmed that both of these genes were up-regulated by all Mitf isoforms. Another protein important for the adhesion and migration of mast cells is the α4 integrin. This gene has previously been described to be a Mitf target in mast cells (17), but we did not identify it in our microarray analysis. By quantitative PCR analysis, however, we found that integrin α4mRNA was highly expressed in Mitf-mc and Mitf-e mast cells. In contrast, α4 integrin expression in Mitf-a was comparable to that of Mitf−/− cells (Fig.8A). In concurrence with the quantitative PCR analysis, α4 integrin was selectively expressed on the surface of the Mitf-mc and Mitf-e mast cells as assessed by flow cytometry for VLA4 (very late activation protein receptor 4, comprised of α4 and β1 subunits), whereas Mitf-a cells had no detectable levels of α4 integrin on their surface (Fig. 8B).
FIGURE 8.

Mitf isoforms regulate genes involved in cell adhesion and migration. A, Quantitative PCR analysis of cell adhesion and migration genes in Mitf isoform cells compared with vector alone, wild-type (Mitf +/+), and Mitf−/− cells. Expression is normalized to β-actin. All Mitf isoforms regulate the expression of SgIGSF4 and αE integrin. However, only the mast cell and e-isoforms restores α4 integrin expression. Values (Relative Expression) are expressed as relative ratios to expression of Mitf−/− cells on the y-axis (described in Materials and Methods). Data are expressed as the mean result of experiments performed in triplicate. Error bars indicate SD. B, Flow cytometry analysis for α4 integrin (Vla4) shows a moderate protein expression in Mitf +/+ cells and no detectable expression in Mitf−/− cells. The mast cell and e-isoforms up-regulate α4 expression, whereas the a-isoform does not, consistent with quantitative PCR data. Dark shaded histogram denotes isotype Ab control.
Discussion
In this study, we report a comprehensive analysis of the function of the in vivo-expressed isoforms of the transcription factor, Mitf, in mast cells. The gene targets we identified define the mast cell Mitf transcriptome. Multiple, distinct, isoforms are expressed in mast cells and provide a mechanism for highly restricted, tissue-selective regulation of their expression; multiple isoforms also allow for redundancy in critical shared functions and diversity of unique functions. The major classes of genes regulated by Mitf in mast cells include proteases, cell surface receptors/transporters, signaling molecules, and cell adhesion proteins. These genes play roles in critical functions of the mast cell, and support the paradigm in which Mitf is a master regulator of mast cell differentiation.
We found that Mitf-a, Mitf-e, and Mitf-mc were the major isoforms detected from immature or “mucosal-type” mast cells (BMMC and intestinal mast cells). In contrast, peritoneal mast cells, which are phenotypically mature and represent “connective tissue-type” mast cells, did not express these isoforms by RT-PCR. These findings suggest that other isoform(s) are expressed in connective tissue-type mast cells, or that the expression of these Mitf isoforms were below the limits of detection in our PCR assay. The heart isoform was also detected from intestinal mast cells (Fig. 1B); we and others (22, 25, 41) have detected this isoform and other Mitf isoforms from mast cells. However, we found that Mitf-a, Mitf-e, and Mitf-mc were the most strongly and consistently expressed isoforms in the different mast cells types; therefore, we focused on these isoforms in this study.
We have found that Mitf regulates the expression of the two major classes of proteases in mast cells; the chymases and the tryptases. In rodents, the chymases include mMCP-1,-2, -4, -5, and -9, whereas the tryptases included mMCP-6 and mMCP-7. In addition, cathepsin G is a protease closely related to chymases (45). mMCP-8 is a serine protease that is distinct from chymases and tryptases, but most closely resembles cathepsin G (46). These mast cell proteases have been implicated in a wide variety of physiologic processes including inflammation, fibrosis, and wound healing. We validated previously identified Mitf targets, including mMCP-4, mMCP-5, mMCP-6, granzyme B, and cathepsin G. In addition, we have also found potential new targets, including mMCP-1, mMCP-2, mMCP-8, and tryptase γ1.
The finding that signal transduction molecules are regulated by Mitf may provide insight into the basis of the poor response of Mitf−/− mast cells to SCF. Our screen identified RSK and SLAP as potential novel Mitf targets. We also confirmed the impaired expression of c-Kit in Mitf−/− mast cells, which had been described previously. RSK is known to function downstream of c-Kit signaling, and thus the deficient expression of both RSK and c-Kit in Mitf−/− cells may partly explain the lack of response to SCF stimulation. All Mitf isoforms restored the expression of RSK, but interestingly, only the ubiquitously expressed Mitf-a isoform restored c-Kit expression to wild-type levels. However, all Mitf isoforms were able to restore SCF-directed migration (haptotaxis assay). In addition, all Mitf isoforms restored SCF-induced proliferation as measured by colorimetric viability assays (3-(4,5-dimethylthiazol-2-2yl)-5-(3-carboxymethoxyphenyl)-2-(4-sulfophenyl)-2H-tetrazolium) to various degrees (data not shown). Thus, Mitf may regulate components of the signaling machinery required for SCF function. An alternative hypothesis to explain the defect in SCF response is that SCF signaling targets Mitf for phosphorylation and that SCF function may require Mitf phosphorylation. We have previously shown that SCF signaling targets Mitf in melanocytes (47). Taken together, these findings support a model in which c-Kit signaling phosphorylates Mitf, and phosphorylated Mitf subsequently regulates the expression of c-Kit and other signaling molecules in a positive feedback loop.
We found several genes that were preferentially regulated by the relatively specific mast cell isoforms, Mitf-mc and Mitf-e. These included the proteases cathepsin G and mMCP-8, as well as the adhesion molecule α4 integrin (Figs. 6 and 8). Analysis of the unique gene sets regulated by these two isoforms identified many genes involved in general biological processes such as cell growth and protein metabolism. Intriguingly, several neutrophil-specific genes were identified in the unique gene set of Mitf-mc, suggesting either a direct or indirect role for this isoform in regulating these genes (see supplemental material). We have not, however, found Mitf-mc expressed in neutrophil cell lines (A. H. Shahlaee, unpublished data). The unique gene list of the Mitf-e cells was not comprised of cell-specific genes; however, these cells did adhere to the culture flask with a morphologic appearance reminiscent of macrophages. In addition, histocompatibility class II Ag was one of the genes with the highest expression (42-fold; supplemental material), characteristic of APCs such as macrophages or dendritic cells. Although this study identified the genes regulated by individual Mitf isoforms, it is possible that the complete mast cell program regulated by Mitf requires the coexpression of these isoforms.
This analysis compared differentially expressed genes in the presence and absence of Mitf. However, a number of Mitf target genes have been identified that are selectively impaired by dominant-negative Mitf alleles, and not Mitf null alleles. This finding suggests that a set of Mitf gene targets requires Mitf protein partners. Thus, gene targets regulated preferentially by heterodimers of Mitf isoforms or those that require Mitf protein partners may not be identified in our analysis. The fact that isoforms regulated distinct gene sets in vivo suggests that their unique amino termini may mediate specific protein-protein interactions and/or may alter DNA-binding specificity. We have previously shown that the mast cell and melanocyte isoforms possess a differential capacity to activate promoters in reporter assays, but they can bind identical DNA sequences in vitro (25). Thus, the amino-terminal domains may participate in the recruitment of protein complexes to the promoter. Further examination of the sequences of these promoters may provide insight into the mechanisms by which Mitf isoforms regulate these genes. Our previous analysis of Mitf target sequences revealed that DNA binding sites in melanocytes are distinct from those in mast cells (25). However, inspection of the promoters of the genes identified in our study with known Mitf binding sites (c-Kit, α4 integrin, mMCP-4, -5, -6, granzyme B, and cathepsin G) did not reveal isoform-specific sequences.
Our experimental design identified genes up-regulated after several weeks of expression of Mitf, therefore determining both direct and indirect targets of Mitf. The verification of direct gene targets of Mitf will require further studies, such as chromatin immuno-precipitation, EMSAs, and reporter assays. We have found that the relative transactivation potential between Mitf isoforms when measured by reporter assays did not reliably correlate with expression determined by quantitative PCR. For example, we found that the Mitf-a, Mitf-mc, and Mitf-e isoforms have a comparable trans-activation potential on the promoters for α4 integrin (17) and c-Kit (44) in luciferase assays (data not shown). In contrast, Figs. 7 and 8 suggest that these Mitf isoforms have a differential capacity to regulate these genes when expressed in vivo. This discrepancy highlights the many factors that may determine the genes identified on this screen, including the influence of chromatin structure, DNA methylation, other cell-specific coregulatory proteins that interact with Mitf, and the presence of distant enhancer or silencing elements; in vitro assays may not account for these factors. Taken together, these findings define the genetic program regulated by the physiologically expressed isoforms of Mitf, and suggest a central role for Mitf in directing the expression of a number of genes critical for the function and development of mast cells.
Footnotes
This work was supported in part by the Basil O’Conner Starter Scholar Research Award Grant 5-FY04-30 from the March of Dimes Birth Defects Foundation; a Children’s Cancer Foundation Grant; and National Institutes of Health Grant 5R01HL077178.
Abbreviations used in this paper: Mitf, Microphthalmia-associated transcription factor; SCF, stem cell factor; BMMC, bone marrow-derived mast cell; mMCP, mouse mast cell protease; CT, cycle threshold; SSC, side scatter; RSK, ribosomal S6 kinase; Vla4, very late activation protein receptor 4.
The online version of this article contains supplemental material.
References
- 1.Williams CM, Galli SJ. The diverse potential effector and immunoregulatory roles of mast cells in allergic disease. J Allergy Clin Immunol. 2000;105:847–859. doi: 10.1067/mai.2000.106485. [DOI] [PubMed] [Google Scholar]
- 2.Lee DM, Friend DS, Gurish MF, Benoist C, Mathis D, Brenner MB. Mast cells: a cellular link between autoantibodies and inflammatory arthritis. Science. 2002;297:1689–1692. doi: 10.1126/science.1073176. [DOI] [PubMed] [Google Scholar]
- 3.Hara M, Ono K, Hwang MW, Iwasaki A, Okada M, Nakatani K, Sasayama S, Matsumori A. Evidence for a role of mast cells in the evolution to congestive heart failure. J Exp Med. 2002;195:375–381. doi: 10.1084/jem.20002036. [DOI] [PMC free article] [PubMed] [Google Scholar]
- 4.Secor VH, Secor WE, Gutekunst CA, Brown MA. Mast cells are essential for early onset and severe disease in a murine model of multiple sclerosis. J Exp Med. 2000;191:813–822. doi: 10.1084/jem.191.5.813. [DOI] [PMC free article] [PubMed] [Google Scholar]
- 5.Galli SJ, Maurer M, Lantz CS. Mast cells as sentinels of innate immunity. Curr Opin Immunol. 1999;11:53–59. doi: 10.1016/s0952-7915(99)80010-7. [DOI] [PubMed] [Google Scholar]
- 6.Wedemeyer J, Tsai M, Galli SJ. Roles of mast cells and basophils in innate and acquired immunity. Curr Opin Immunol. 2000;12:624–631. doi: 10.1016/s0952-7915(00)00154-0. [DOI] [PubMed] [Google Scholar]
- 7.Migliaccio AR, Rana RA, Sanchez M, Lorenzini R, Centurione L, Bianchi L, Vannucchi AM, Migliaccio G, Orkin SH. GATA-1 as a regulator of mast cell differentiation revealed by the phenotype of the GATA-1 low mouse mutant. J Exp Med. 2003;197:281–296. doi: 10.1084/jem.20021149. [DOI] [PMC free article] [PubMed] [Google Scholar]
- 8.Tsai FY, Orkin SH. Transcription factor GATA-2 is required for proliferation/survival of early hematopoietic cells and mast cell formation, but not for erythroid and myeloid terminal differentiation. Blood. 1997;89:3636–3643. [PubMed] [Google Scholar]
- 9.Walsh JC, DeKoter RP, Lee HJ, Smith ED, Lancki DW, Gurish MF, Friend DS, Stevens RL, Anastasi J, Singh H. Cooperative and antagonistic interplay between PU.1 and GATA-2 in the specification of myeloid cell fates. Immunity. 2002;17:665–676. doi: 10.1016/s1074-7613(02)00452-1. [DOI] [PubMed] [Google Scholar]
- 10.Stechschulte DJ, Sharma R, Dileepan KN, Simpson KM, Aggarwal N, Clancy J, Jr, Jilka RL. Effect of the mi allele on mast cells, basophils, natural killer cells, and osteoclasts in C57BL/6J mice. J Cell Physiol. 1987;132:565–570. doi: 10.1002/jcp.1041320321. [DOI] [PubMed] [Google Scholar]
- 11.Stevens J, Loutit JF. Mast cells in spotted mutant mice (W Ph mi) Proc R Soc Lond B Biol Sci. 1982;215:405–409. doi: 10.1098/rspb.1982.0050. [DOI] [PubMed] [Google Scholar]
- 12.Jippo T, Lee YM, Katsu Y, Tsujino K, Morii E, Kim DK, Kim HM, Kitamura Y. Deficient transcription of mouse mast cell protease 4 gene in mutant mice of mi/mi genotype. Blood. 1999;93:1942–1950. [PubMed] [Google Scholar]
- 13.Morii E, Jippo T, Tsujimura T, Hashimoto K, Kim DK, Lee YM, Ogihara H, Tsujino K, Kim HM, Kitamura Y. Abnormal expression of mouse mast cell protease 5 gene in cultured mast cells derived from mutant mi/mi mice. Blood. 1997;90:3057–3066. [PubMed] [Google Scholar]
- 14.Morii E, Tsujimura T, Jippo T, Hashimoto K, Takebayashi K, Tsujino K, Nomura S, Yamamoto M, Kitamura Y. Regulation of mouse mast cell protease 6 gene expression by transcription factor encoded by the mi locus. Blood. 1996;88:2488–2494. [PubMed] [Google Scholar]
- 15.Ito A, Morii E, Maeyama K, Jippo T, Kim DK, Lee YM, Ogihara H, Hashimoto K, Kitamura Y, Nojima H. Systematic method to obtain novel genes that are regulated by mi transcription factor: impaired expression of granzyme B and tryptophan hydroxylase in mi/mi cultured mast cells. Blood. 1998;91:3210–3221. [PubMed] [Google Scholar]
- 16.Ito A, Jippo T, Wakayama T, Morii E, Koma Y, Onda H, Nojima H, Iseki S, Kitamura Y. SgIGSF: a new mast-cell adhesion molecule used for attachment to fibroblasts and transcriptionally regulated by MITF. Blood. 2003;101:2601–2608. doi: 10.1182/blood-2002-07-2265. [DOI] [PubMed] [Google Scholar]
- 17.Kim DK, Morii E, Ogihara H, Hashimoto K, Oritani K, Lee YM, Jippo T, Adachi S, Kanakura Y, Kitamura Y. Impaired expression of integrin α4 subunit in cultured mast cells derived from mutant mice of mi/mi genotype. Blood. 1998;92:1973–1980. [PubMed] [Google Scholar]
- 18.Morii E, Ogihara H, Oboki K, Sawa C, Sakuma T, Nomura S, Esko JD, Handa H, Kitamura Y. Inhibitory effect of the mi transcription factor encoded by the mutant mi allele on GA binding protein-mediated transcript expression in mouse mast cells. Blood. 2001;97:3032–3039. doi: 10.1182/blood.v97.10.3032. [DOI] [PubMed] [Google Scholar]
- 19.Morii E, Oboki K. MITF is necessary for generation of prostaglandin D2 in mouse mast cells. J Biol Chem. 2004;279:48923–48929. doi: 10.1074/jbc.M407026200. [DOI] [PubMed] [Google Scholar]
- 20.Isozaki K, Tsujimura T, Nomura S, Morii E, Koshimizu U, Nishimune Y, Kitamura Y. Cell type-specific deficiency of c-kit gene expression in mutant mice of mi/mi genotype. Am J Pathol. 1994;145:827–836. [PMC free article] [PubMed] [Google Scholar]
- 21.Jippo T, Morii E, Tsujino K, Tsujimura T, Lee YM, Kim DK, Matsuda H, Kim HM, Kitamura Y. Involvement of transcription factor encoded by the mouse mi locus (MITF) in expression of p75 receptor of nerve growth factor in cultured mast cells of mice. Blood. 1997;90:2601–2608. [PubMed] [Google Scholar]
- 22.Hershey CL, Fisher DE. Genomic analysis of the Microphthalmia locus and identification of the MITF-J/Mitf-J isoform. Gene. 2005;347:73–82. doi: 10.1016/j.gene.2004.12.002. [DOI] [PubMed] [Google Scholar]
- 23.Modrek B, Lee C. A genomic view of alternative splicing. Nat Genet. 2002;30:13–19. doi: 10.1038/ng0102-13. [DOI] [PubMed] [Google Scholar]
- 24.Lynch KW. Consequences of regulated pre-mRNA splicing in the immune system. Nat Rev Immunol. 2004;4:931–940. doi: 10.1038/nri1497. [DOI] [PubMed] [Google Scholar]
- 25.Takemoto CM, Yoon YJ, Fisher DE. The identification and functional characterization of a novel mast cell isoform of the microphthalmia-associated transcription factor. J Biol Chem. 2002;277:30244–30252. doi: 10.1074/jbc.M201441200. [DOI] [PubMed] [Google Scholar]
- 26.Hughes MJ, Lingrel JB, Krakowsky JM, Anderson KP. A helix-loop-helix transcription factor-like gene is located at the mi locus. J Biol Chem. 1993;268:20687–20690. [PubMed] [Google Scholar]
- 27.Hodgkinson CA, Moore KJ, Nakayama A, Steingrimsson E, Copeland NG, Jenkins NA, Arnheiter H. Mutations at the mouse microphthalmia locus are associated with defects in a gene encoding a novel basic-helix-loop-helix-zipper protein. Cell. 1993;74:395–404. doi: 10.1016/0092-8674(93)90429-t. [DOI] [PubMed] [Google Scholar]
- 28.Tsai M, Wedemeyer J, Ganiatsas S, Tam SY, Zon LI, Galli SJ. In vivo immunological function of mast cells derived from embryonic stem cells: an approach for the rapid analysis of even embryonic lethal mutations in adult mice in vivo. Proc Natl Acad Sci USA. 2000;97:9186–9190. doi: 10.1073/pnas.160254997. [DOI] [PMC free article] [PubMed] [Google Scholar]
- 29.Abonia JP, Hallgren J, Jones T, Shi T, Xu Y, Koni P, Flavell RA, Boyce JA, Austen KF, Gurish MF. α4 Integrins and VCAM-1, but not MAdCAM-1, are essential for recruitment of mast cell progenitors to the inflamed lung. Blood. 2006;108:1588–1594. doi: 10.1182/blood-2005-12-012781. [DOI] [PMC free article] [PubMed] [Google Scholar]
- 30.Pulsipher M, Kupfer GM, Naf D, Suliman A, Lee JS, Jakobs P, Grompe M, Joenje H, Sieff C, Guinan E, et al. Subtyping analysis of Fanconi anemia by immunoblotting and retroviral gene transfer. Mol Med. 1998;4:468–479. [PMC free article] [PubMed] [Google Scholar]
- 31.Ory DS, Neugeboren BA, Mulligan RC. A stable human-derived packaging cell line for production of high titer retrovirus/vesicular stomatitis virus G pseudotypes. Proc Natl Acad Sci USA. 1996;93:11400–11406. doi: 10.1073/pnas.93.21.11400. [DOI] [PMC free article] [PubMed] [Google Scholar]
- 32.Tan BL, Yazicioglu MN, Ingram D, McCarthy J, Borneo J, Williams DA, Kapur R. Genetic evidence for convergence of c-Kit- and α4 integrin-mediated signals on class IA PI-3kinase and the Rac pathway in regulating integrin-directed migration in mast cells. Blood. 2003;101:4725–4732. doi: 10.1182/blood-2002-08-2521. [DOI] [PubMed] [Google Scholar]
- 33.Irizarry RA, Hobbs B, Collin F, Beazer-Barclay YD, Antonellis KJ, Scherf U, Speed TP. Exploration, normalization, and summaries of high density oligonucleotide array probe level data. Biostatistics. 2003;4:249–264. doi: 10.1093/biostatistics/4.2.249. [DOI] [PubMed] [Google Scholar]
- 34.Wu Z, Irizarry R, Gentleman R, Martinez-Murillo F, Spencer F. A model-based background adjustment for oligonucleotide expression arrays. J Am Stat Assoc. 2004;99:909–917. [Google Scholar]
- 35.Bolstad BM, Irizarry RA, Astrand M, Speed TP. A comparison of normalization methods for high density oligonucleotide array data based on variance and bias. Bioinformatics. 2003;19:185–193. doi: 10.1093/bioinformatics/19.2.185. [DOI] [PubMed] [Google Scholar]
- 36.Newton MA, Kendziorski CM, Richmond CS, Blattner FR, Tsui KW. On differential variability of expression ratios: improving statistical inference about gene expression changes from microarray data. J Comput Biol. 2001;8:37–52. doi: 10.1089/106652701300099074. [DOI] [PubMed] [Google Scholar]
- 37.Kendziorski CM, Newton MA, Lan H, Gould MN. On parametric empirical Bayes methods for comparing multiple groups using replicated gene expression profiles. Stat Med. 2003;22:3899–3914. doi: 10.1002/sim.1548. [DOI] [PubMed] [Google Scholar]
- 38.Newton MA, Kendziorski CM. Parametric empirical Bayes methods for microarrays. In: Parmigiani G, Garrett ES, Irizarry R, Zeger SL, editors. The Analysis of Gene Expression Data: Methods and Software. Springer; New York: 2003. pp. 251–271. [Google Scholar]
- 39.Hosack DA, Dennis G, Jr, Sherman BT, Lane HC, Lempicki RA. Identifying biological themes within lists of genes with EASE. Genome Biol. 2003;4:R70. doi: 10.1186/gb-2003-4-10-r70. [DOI] [PMC free article] [PubMed] [Google Scholar]
- 40.Livak KJ, Schmittgen TD. Analysis of relative gene expression data using real-time quantitative PCR and the 2ΔΔCT method. Methods. 2001;25:402–408. doi: 10.1006/meth.2001.1262. [DOI] [PubMed] [Google Scholar]
- 41.Oboki K, Morii E, Kataoka TR, Jippo T, Kitamura Y. Isoforms of mi transcription factor preferentially expressed in cultured mast cells of mice. Biochem Biophys Res Commun. 2002;290:1250–1254. doi: 10.1006/bbrc.2002.6332. [DOI] [PubMed] [Google Scholar]
- 42.Ebi Y, Kanakura Y, Jippo-Kanemoto T, Tsujimura T, Furitsu T, Ikeda H, Adachi S, Kasugai T, Nomura S, Kanayama Y. Low c-kit expression of cultured mast cells of mi/mi genotype may be involved in their defective responses to fibroblasts that express the ligand for c-kit. Blood. 1992;80:1454–1462. [PubMed] [Google Scholar]
- 43.Choong ML, Tan AC, Luo B, Lodish HF. A novel role for proliferin-2 in the ex vivo expansion of hematopoietic stem cells. FEBS Lett. 2003;550:155–162. doi: 10.1016/s0014-5793(03)00844-5. [DOI] [PubMed] [Google Scholar]
- 44.Tsujimura T, Morii E, Nozaki M, Hashimoto K, Moriyama Y, Takebayashi K, Kondo T, Kanakura Y, Kitamura Y. Involvement of transcription factor encoded by the mi locus in the expression of c-kit receptor tyrosine kinase in cultured mast cells of mice. Blood. 1996;88:1225–1233. [PubMed] [Google Scholar]
- 45.Caughey GH. New developments in the genetics and activation of mast cell proteases. Mol Immunol. 2002;38:1353–1357. doi: 10.1016/s0161-5890(02)00087-1. [DOI] [PubMed] [Google Scholar]
- 46.Lutzelschwab C, Huang MR, Kullberg MC, Aveskogh M, Hellman L. Characterization of mouse mast cell protease-8, the first member of a novel subfamily of mouse mast cell serine proteases, distinct from both the classical chymases and tryptases. Eur J Immunol. 1998;28:1022–1033. doi: 10.1002/(SICI)1521-4141(199803)28:03<1022::AID-IMMU1022>3.0.CO;2-1. [DOI] [PubMed] [Google Scholar]
- 47.Hemesath TJ, Price ER, Takemoto C, Badalian T, Fisher DE. MAP kinase links the transcription factor Microphthalmia to c-Kit signalling in melanocytes. Nature. 1998;391:298–301. doi: 10.1038/34681. [DOI] [PubMed] [Google Scholar]