

Abstract
Objective
Clinical MR studies show delayed and ongoing neurodegeneration following neonatal hypoxia-ischemia (HI), but the mechanisms and timing of this neurodegeneration remain unclear. We use ex vivo Diffusion Tensor Imaging (DTI) and brain neuropathology to determine if selective injury to white matter tracts occurs following neonatal HI in mice resulting in neural system associated attrition in remote regions and at delayed time points.
Methods
The Rice Vannucci model (unilateral carotid ligation + 45 minutes of hypoxia FIO2=0.08) was used to cause brain injury in postnatal (p)7 C57BL6 mice and ex vivo DTI and correlative neuropathology were performed at p8,p11,p15,p21,p28, and p42.
Results
DTI provides excellent contrast visualization of unmyelinated white matter in the immature mouse brain. Acute severe ipsilateral injury to the hippocampus is seen with both histopathology and diffusion-weighted MRI 24 hours post injury. Injury to axons is evident 24 hours after HI in the hippocampal alveus. By p11 and continuing until p28, the ipsilateral fimbria fornix degenerates. Beginning at p15, there is injury and loss of axons entering the ipsilateral septal nucleus followed by ipsilateral septal atrophy. Volume loss in the hippocampus is rapid and severe but is subacute and significantly slower in the ipsilateral septum. Neonatal HIE, also interrupts the normal developmental increase in fractional anisotropy in the ipsilateral fimbria but not in the contralateral fimbria from p8 to p42.
Interpretation
In the neonatal brain there is a progressive systems-preferential injury following HI. DTI allows unparalleled visualization of this neural-network associated attrition so that it can be followed longitudinally in the developing brain.
Introduction
Prenatal and perinatal brain injury as a result of hypoxia-ischemia (HI), stroke, or chorioamnionitis contributes substantially to the morbidity and mortality of newborn infants and children1. These injuries may lead to mental retardation, seizures, and cerebral palsy2-6. The complex disabilities seen in children surviving HI suggests injury to multiple integrated brain regions that evolves progressively following the initial insult in contrast to a static degenerative process.7-9.
During the perinatal period, developing neurons are highly dependent upon trophic support for survival and maintenance of proper connections10, 11. Interrupting developing neuronal connections and the resultant target deprivation that ensues, causes cell death in the immature brain more rapidly and frequently than in the mature brain12. This target deprivation-induced neurodegeneration is one proposed mechanism for the occurrence of delayed neurodegeneration that has been observed after HI in animal models13. Currently, there is minimal information on the delayed or slower evolving injury after neonatal HI, including the progression of damage in developing white matter and its constituent axons and myelinating cells, and even less information about injury to regions remote from the primary site of injury.
HI-related damage to white matter pathways and remote target regions following HI, can now be interrogated in-vivo using advanced magnetic resonance (MR) imaging techniques. Diffusion tensor imaging (DTI) has emerged as a novel MR technique that reveals tissue microstructure with endogenous contrasts14, 15. The diffusion anisotropy of water has been observed before onset of myelination, allowing resolution of white matter tracts in neonatal mouse brains that are unmyelinated but packed into parallel bundles and reconstruction of their macroscopic connectivity (tractography)16, 17. Recently, DTI has been used to evaluate brain injury following HI in a neonatal mouse model18, a neonatal rat model19, and a rabbit model20. To date, DTI and tractography have only been used to quantitate white matter injury in humans21 but have not been used to quantitate gray matter volumes nor have they been used to detect delayed injury in brain regions remote from the primary sites, following neonatal HI in experimental models.
In the present study our objective was to combine DTI with histopathology to determine if selective injury to white matter tracts and specific remote brain regions occurs, following neonatal HI, as would be expected if connectivity-directed degeneration is important in the overall neuropathology resulting from neonatal HI brain injury. We focused on the limbic circuit because the septal nuclei and the hippocampus are extensively inter-connected22 and are ideal for study of connectivity-directed degeneration. Briefly, the CA1, CA2, CA3, and entorhinal regions project fibers to the lateral septal nucleus via the fimbria fornix. Although most hippocampal projections terminate bilaterally in the lateral septal nuclei, projections from the CA1 region predominately have only ipsilateral connections. Reciprocal connections via the dorsal fimbria fornix connect the medial septal nucleus with the dentate gyrus, CA1, CA2, subiculum, and entorhinal cortex. 23-25
We hypothesize that following neonatal hypoxic-ischemic brain injury, axonal injury emerges in interconnecting white matter tracts related to the hippocampus over a delayed time period resulting in injury in a systems preferential manner to interconnected remote target regions whose susceptibility to injury is directed by their connection to the primary/initial site of injury.
Methods
Animal Models
Animal studies were performed with approval by the Institutional Animal Care and Use Committee at Johns Hopkins University School of Medicine and carried out with standards of care and housing in accordance with the National Institutes of Health “Guide for the Care and Use of Laboratory Animals, U.S. Department of Health and Human Services 85-23, 1985.
Hypoxic-Ischemic Injury
P7 mice were exposed to HI as previously described using the Vannucci model as adapted for neonatal mice (permanent ligation of right common carotid and FiO2=0.08 × 45 minutes) 26-28
Tissue Processing for ex-vivo MRI, and Histopathology
Animals were anesthetized with pentobarbital, 65 mg/kg IP, exsanguinated with cold 0.1M PBS (pH 7.4) via intra-cardiac perfusion and perfused with 4% paraformaldehyde in 0.1M PBS for 30 min at 4mL/min. Tissue was post-fixed in the skull in the perfusion solution for 12-16 hours and then stored in 1.4% Cacodylic acid, (pH=7.3, 4 °C) until imaging. Post imaging, brains were removed from the skull, reimmersed in NaCacodylate, and shipped to Neuroscience Associates (NSA, Knoxville, TN) for multibrain array preparation, sectioning, and staining with the amino-cupric silver method of de Olmos29.
For Neurofilament-M (NF-M (medium), Chemicon, Temecula, Ca) and NeuN (Chemicon, Temecula, Ca) immunohistochemistry, unstained multibrain array samples prepared by NSA were processed as previously described30, 31. After final incubation, sections were developed using a standard diaminobenzidine reaction. Neurofilament M was chosen as an axonal marker because it is a key component of the heteropolymer intermediate filaments that provide structure to the axon and unlike neurofilament H (high), neurofilament M is abundant in the developing brain32. Anti-neuronal nuclei (NeuN) is a monoclonal IgG1 antibody that recognizes a neuron-specific protein found throughout the central nervous system of most vertebrates.
Post imaging, selected brain tissue was retained in-house, imbedded in OTC matrix, and cryostat-sectioned at 20 μm. Post sectioning, mounted slides were stained with Fluoro Jade-C (Chemicon, Temecula, CA) using previously described methods33.
Ex-vivo MR Imaging
Imaging was performed using an 11.7T NMR spectrometer (Bruker Biospin, Billerica, MA, USA) as previously described34-36. The native imaging resolution ranged from 0.1 mm × 0.1 mm × 0.1 mm for neonatal brains to 0.125 mm × 0.125 mm × 0.125 mm for p42 samples. The total imaging time was approximately 18 hours. 3D T2-weighted images were acquired with the same field of view and resolution using a fast spin echo sequence with TE/TR of 50/900ms, flip angle of 40 degree, 4 signal averages, and echo train length of 4, and imaging time of less than 2 hours. Post injury a total of 41 brains were imaged at either postnatal day 8, 11, 15, 21, 28, or 42.
Diffusion tensor was calculated using a Log-linear fitting method15. For the quantification of anisotropy, fractional anisotropy (FA) was used. Isotropic diffusion-weighted images (iDWI) were obtained from six diffusion-weighted images with isotropic diffusion gradient directions. Using the primary eigen-vector and FA, direction encoded color (DEC) maps were calculated. In the color encoded images, the R(ed), G(reen), and B(lue) value for each pixel is defined by the orientation of its primary eigen-vector, and the intensity was proportional to the FA. Green was assigned to the fiber orientation along the rostral-caudal axis, red to the medial-lateral axis, and blue to the dorsal-ventral axis. Tracts with oblique angles are represented with the appropriate mixture of these basic colors. For tractotraphy, we used multiple region of interest (ROI) approach which utilizes prior knowledge of the trajectories of white matter tracts and has been implemented in DTIStudio37. Briefly, at least two ROIs were placed in DEC image at different locations along the possible path of a white matter tract. We then used the FACT algorithm (76-78) to find possible white matter tracts that passed through all ROIs. The FA of the fimbria fornix was obtained by manually placing ROIs in selected coronal DEC images. The ROIs followed the boundaries of the ipsilateral and contralateral fimbria fornix (figure 2).
Figure 2.
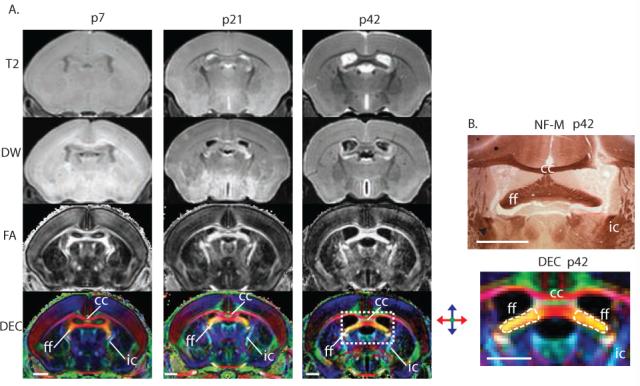
Diffusion tensor imaging (DTI) provides superior contrast when imaging the immature mouse brain. (A) MRI sequences including T2-weighted (T2), diffusion-weighted (DW), fractional anisotropy (FA), and direction-encoded maps (DEC) are shown in the same coronal plane at p7, p21, and p42 respectively. Immature white matter tracts are labeled ff (fimbria fornix), cc (corpus callosum), and ic (internal capsule). (B) Matched neurofilament-M (NFM) and DEC imaging demonstrating the ff, cc, and ic at higher magnification. The fimbria fornix is outlined in a broken line representing the region of interest boundaries used to determine the fractional anisotropy of the ipsilateral and contralateral sides. Scale bars = 1mm.
Volume Analysis
To measure the volume of the brain, lateral ventricles, hippocampus, septum and other regions of interest, manual segmentation of the ex vivo MR images was performed using Amira (Mercury Computer System Inc., San Diego, CA). Paxino’s Atlas of mouse brain anatomy was used for definition of structural boundaries. Diffusion-weighted images were used to define the boundaries of the whole brain and lateral ventricles. Diffusion-weighted and direction-encoded colormap images were used to define the boundaries of the septum and hippocampus. In this study, the septum was defined by the corpus callosum as the anterior and dorsal boundaries, lateral ventricles as the lateral boundaries, anterior commissure as the ventral boundary, and ventral hippocampal commissure as the posterior boundary. The left and right septal regions were separated by the mid-sagittal plane and fornix. The septal region defined in this fashion includes the lateral and medial septal nuclei, which have efferent and afferent connections with the hippocampus, but exclude most ventral septal nuclei. The hippocampal volumes measured in this study include CA regions, subiculum, and dentate gyrus. Examples of the septal and hippocampal segmentation are shown in figure 1. A subgroup of the least injured brains as defined by ipsilateral/contralateral hippocampal volume ratio were analyzed separately and fimbria FA and septal volumes were compared between this subgroup and the remaining brains.
Figure 1.

Segmentation of the septal region (A) and the hippocampus (B) in mouse brain. The boundaries of manually delineated septal region and hippocampus are overlaid on coronal diffusion-weighted MR images of a P42 mouse brain arranged in rostral-caudal order. Abbreviations are: ac: anterior commissure; aca: anterior part of the anterior commissure; cc: corpus callosum; ec: external capsule; f: fornix; fmj: forceps major of the corpus callosum; vhc: ventral hippocampal commissure. Scale bars = 1 mm.
Statistical Analysis
Volume analysis was performed on 4-6 animals at each age group. A simple scatter plot was graphed using the mean ipsilateral/contralateral (IC) volume ratio for each region at each time point. Error bars represent standard deviation of the mean. An exponential linear combination decay model (f=y0+a*exp(-b*x)+c*x) was used to determine the best fit line for total hippocampal decay and dentate gyrus decay, and a single three parameter exponential decay model (f=y0+a*exp(-b*x)) was used to determine septal nuclei decay best fit. Standard student t-tests were performed on hippocampal, septal , and dentate gyrus volumes as well as FA values to determine significance. Statistics were performed using Microsoft Excel and Sigma Plot (SigmaPlot 10.0, Systat Software, San Jose, CA, USA. Best fit graphs were generated using Sigma Plot. Quantitative optical density (OD) was calculated using IPLAB 3.5.5 (Scanalytics, Inc, Fairfax, VA). For each animal, optical density was measured in equal size regions of the ipsilateral and contralateral fimbria fornix. The IC ratio was determined for each animal, and the ratios were averaged for each time point.
RESULTS
Fractional anisotropy and diffusion-encoded color (DEC) map images provide superior contrast when imaging the immature mouse brain
At p7, p21, and p42, T2 diffusion-weighted images compared to fractional anisotropy maps (FA) and direction-encoded maps (DEC) show limited contrast for white matter structures in the immature murine brain (Figure 2). DEC maps provide necessary contrast for distinguishing closely adjacent but separate white matter tracts (Figure 2, panel A-DEC). White matter structures including the fimbria fornix (ff), corpus callosum (cc), and the internal capsule (ic) are reliably identified in the DEC images from p7 to p42 (figure 2, panel A-DEC) but not in the T2 images (figure 2, panel A- T2).
Neurofilament-M (NF-M) immunohistology clearly identifies axons within the immature brain, specifically within the ff (Figure 2B). The direction encoded image and neurofilament specimen are from similar coronal sections and show the ease with which specific structures can be identified using corresponding images and histopathology sections.
Neonatal HI results in severe, rapidly evolving injury to the hippocampus
Within twenty-four hours following neonatal hypoxia-ischemia, there is massive ipsilateral hippocampal and cortical damage as previously reported38. Ex-vivo MRI imaging of mouse brains at p8 reveals T2-weighted and diffusion-weighted hyperintensity and decreased fractional anisotropy in the ipsilateral cortex and hippocampus (Figure 3A). Fluoro jade-C histology identifies dense areas of neurodegeneration in the aforementioned regions at p8. All regions of the hippocampal formation including CA1-3, dentate, and subiculum degenerated. There is limited fluoro jade-C reactivity in both the contralateral brain regions and bilateral septal nuclei (not shown). Longitudinal imaging at p15, p21, and p28 reveals progression of porencepahlic cyst formation in these areas. Representative cresyl-violet samples at p15, p21 and p28 corroborate MRI findings. Parenchymal volume loss and ventricular enlargement is evident in the three-dimensional reconstruction (Figure 3B).
Figure 3.

Rapid and severe evolving injury to the ipsilateral hippocampus after neonatal HI in the mouse. (A) Flurojade C and Cresyl violet histopathology, and Ex-vivo MRI sequences including T2-weighted (T2), diffusion weighted (DW), fractional anisotropy (FA), and direction encoded maps (DEC), of C57BL6 forebrain at p8, p15, p21, and p28 after neonatal HI. Progression of porencephalic cyst formation post HI, follows initial neurodegeneration in the p8 hippocampus and cortex at p15, p21 and p28. T2 hyperintensity, abnormalities in diffusion and FA in the ipsilateral cortex and hippocampus at p8 match the neurodegeneration identified with flurojade C and portends subsequent development of porencephalic cyst in these regions. Compass colors represent white matter directionality in the DEC images. All scale bars = 1mm. Of note, p28 images and histology is slightly posterior relative to p8, p15, and p21. (B) Parenchymal volume loss and ventricular enlargement are seen with three-dimensional reconstruction (green=hippocampus, red=fimbria fornix, yellow=septal nuclei, blue=lateral ventricles and porencephalic cyst).
Neonatal HI causes loss of major hippocampal white matter pathways
Loss of white matter tracts emanating from the hippocampus are initially demonstrated 24 hours after HI in the hippocampal alveus (Figure 4A). The alveus is a white matter bundle that arises from neuronal cell bodies in the subiculum and hippocampus and eventually merges with the fimbria to form the fornix. In the DTI-DEC image, axons exiting the contralateral hippocampal alveus appear blue (dorsal direction). This signal is undetectable in the ipsilateral hippocampus (dashed white arrow). White boxes in the DEC image highlight the region of interest in the corresponding NF-M specimens. Even at low magnification there is an appreciable loss of NF-M in the ipsilateral hipocampus. Higher magnification of the ipsilateral alveus reveals thickened, tortuous axons with beading indicative of axonal injury (Figure 4A, broken yelllow arrow). There is also patchy NF-M staining of axonal clusters ipsilaterally. In the contralateral alveus there is smooth, linear staining of axons without distortion or interruption (yellow arrow).
Figure 4.

Injury to major hippocampal white matter pathways. (A) Paired direction-encoded image (DEC) and NF-M histology of the hippocampus illustrating patchy loss of DEC signal and NF-M in the ipsilateral alveus at p8 (dashed white arrow). Contralateral hippocampal alveus has DEC signal and NF-M present throughout the alveus (solid white arrow). Histology sections corresponding to the DEC image are shown. Drop out of NF-M is evident within the yellow boxed region in the ipsilateral alveus. Yellow boxes highlight regions shown at high power for examination of axonal pathology. Injured axons exiting the ipsilateral hippocampus are thickened, and tortuous with significant beading (dashed yellow arrow) compared to the smooth regular staining with NF-M in the contralateral alveus (solid yellow arrow). Compare ipsilateral and contralateral NF-M histology. Scale bars = 100 μm. (B) Degenerating axons in the ipsilateral fimbria labeled with linear silver deposits (white dashed arrows). Other degenerating cell bodies in the ipsilateral fimbria are dark and densely argyrophillic. Progressive loss of NF-M in the ipsilateral fimbria fornix (ff) and corresponding loss of signal identifying the ff in paired DEC images. Tractography with 3D reconstruction illustrates ipsilateral fimbria fornix fiber loss after HI. Compass colors represent white matter directionality in the DEC images in panels A and B. (C). Continued progression of injury to fimbria fornix with porencephalic cyst formation in the ipsilateral forebrain at p42. (loss of NF-M immunoreactivity, loss of signal in DEC image, and increased signal in the cyst area in T2-weighted (T2W) image). Scale bar for NF-M = 0.5mm, for DEC images =1mm.
Severe ipsilateral hippocampal injury is followed by delayed axonal degeneration in the ipsilateral fimbria fornix. By p11 there is loss of NF-M in the ipsilateral fimbria fornix that was not evident earlier (Figure 4B). Within the region of interest in the damaged fimbria fornix, degenerating axons are discernible by stippled silver stain (dashed arrows). Degenerating cell bodies are also present. Corresponding DEC images show loss of signal in the ipsilateral fimbria (ff) (figure 4B)-DEC. Tractography with 3D reconstruction highlights the ipsilateral fimbria fornix fiber loss after HI.
Continued progression of injury to the fimbria fornix with porencephalic cyst formation in the ipsilateral forebrain is evident at p42 (Figure 4C). There is near complete loss of NF-M in the ipsilateral fimbria fornix at p42 . Corresponding DEC images mirror this near complete disruption of the ipsilateral fimbria (ff) in the injured animal (figure 4C). Both DEC and T2 weighted images show ipsilateral ventricular dilation following neonatal HI.
Neonatal HI results in delayed degeneration of the dorsolateral septal nucleus
Axonal connections to the septal nuclei are lost at remote time points following neonatal HI (Figure 5). At p8, axons entering the septal nuclei are symmetrical (NF-M immunohistochemistry (white arrows)). The fornix (f) appears blue in DTI-DEC images while terminal axons have a blue-green hue (white arrow). At subsequent time points, there is progressive pruning of the axons entering the ipsilateral septal nucleus, ipsilateral dorsolateral septal atrophy, and ventricular dilation (Figure 5, DEC images-loss of blue fibers entering the ipsilateral septum and immunohistochemical specimens-loss of NF-M). The lateral ventricle (LV), corpus callosum (CC), fornix (f), and anterior commisure (ac) are labeled and the LV and septal nuclei are outlined. Higher magnification of the ipsilateral fornix border at p42 reveals tortuous, dystrophic injured axons as they exit the fimbria into the lateral septal nucleus. The majority of the ipsilateral septal nucleus at p42 lacks NF-M reactivity compared to the contralateral septal nucleus.
Figure 5.

Delayed degeneration of the septal nucleus following neonatal HI. T2-weighted (T2W) and DEC images along with corresponding neurofilament-M (NF-M) stained specimens at p8, p11, p15, p21, and p42 post neonatal HI. Boxed area in T2W image includes regions seen in corresponding DEC images and NF-M specimens. At p8, axons entering septal nuclei are symmetrical in both NF-M and DEC images (blue fornix fibers, blue-green septal fibers, and brown immunoreactivity (white arrows)). At later time points there is progressive loss of fimbria innervating the ipsilateral septal nucleus, loss of NF-M staining in the ipsilateral septal nucleus, and eventual collapse of lateral septal wall evident at 21 and p42. Septal nuclei and lateral ventricles are traced in DEC images (yellow and white outlines respectively).
Neonatal HI results in early hippocampal degeneration followed by delayed degeneration of the dorsolateral septal nucleus
Following neonatal HI there is rapid loss of volume in the total ipsilateral hippocampus compared to the contralateral side (Figure 6A). The total ipsilateral to contralateral hippocampal volume ratio reaches its nadir by p15, eight days after HI and undergoes limited recovery by p42. Hippocampal volume loss is described using an exponential linear combination decay model. The correlation coefficient R of the generated curve is 0.99. The I/C dentate gyrus volume ratios are remarkably similar to those of the total hippocampus, also showing limited recovery by p42. (Figure 6B).
Figure 6.

Total hippocampus (A,B,D), dentate gyrus (B), and septal nucleus (C,D) degeneration after HI. Best-fit curve of total hippocampus (R=0.99) and dentate gyrus (R=0.99) obtained using exponential linear combination decay modeling (f=y0+a*exp(-b*x)+c*x), and best fit of septal nucleus (R=0.77) via single three parameter exponential decay modeling (f=y0+a*exp(-b*x)). 95% confidence intervals plotted in blue. Plots illustrate that hippocampal degeneration occurs early after HI, is severe, and there is some degree of recovery at later time points, where as septal nucleus degeneration occurs at later time points and has a more indolent course.
There is delayed degeneration of the ipsilateral dorsolateral septal nucleus (Figure 6C). The best fit curve is obtained with single three parameter exponential decay modeling. The R value of the generated curve is 0.77. When the regional volumes of the total hippocampus and septal nuclei are plotted together it is evident that hippocampal volume loss is rapid and extremely severe, while ipsilateral septal volume loss evolves more slowly (Figure 6D). Raw data for total hippocampal, dentate gyrus, and septal volumes are presented in table 1.
Table 1.
Changes in total hippocampal volume, dentate gyrus volume, and septal volume after HI
| Age | Total Hippocampal Volume (mm3) | Dentate Gyrus Volume (mm3) | Septal Volume (mm3) | |||||||||
|---|---|---|---|---|---|---|---|---|---|---|---|---|
| Ipsilateral | Contralateral | p value | Ratio | Ipsilateral | Contralateral | p value | Ratio | Ipsilateral | Contralateral | p value | ratio | |
| p8 n=5 |
5.43 ± 1.24 | 5.52 ± 1.02 | 0.9 | 0.99 ± 0.13 |
0.8 ± 0.18 | 0.8 ± 0.08 | 0.96 | 1.01 ± 0.27 |
0.95 ± 0.09 | 0.96 ± 0.10 | 0.42 | 0.99 ± 0.013 |
| p11 n=4 |
4.02 ± 3.26 | 7.56 ± 1.13 | 0.08 | 0.54 ± 0.41* |
0.51 ± 0.04 | 1.05 ± 0.14 | 0.04 | 0.49 ± 0.37* |
0.97 ± 0.04 | 1.05 ± 0.06 | 0.06 | 0.92 ± 0.04 |
| p15 n=4 |
2.23 ± 1.52 | 8.21 ± 0.58 | <0.001 | 0.27 ± 0.18* |
0.48 ± 0.51 | 1.25 ± 0.17 | 0.06 | 0.37 ± 0.38* |
0.86 ± 0.05 | 1.02 ± 0.04 | 0.002 | 0.85 ± 0.03 |
| p21 n=5 |
2.86 ± 2.66 | 9.42 ± 0.48 | 0.03 | 0.31 ± 0.28* |
0.4 ± 0.39 | 1.41± 0.12 | 0.03 | 0.28 ± 0.27* |
0.80 ± 0.12 | 1.01± 0.10 | 0.03 | 0.82 ± 0.14 |
| p28 n=4 |
2.64 ± 1.73 | 9.2 ± 0.8 | <0.001 | 0.29 ± 0.20* |
0.38 ± 0.27 | 1.36 ± 0.06 | 0.03 | 0.29 ± 0.2* |
0.81 ± 0.13 | 1.02 ± 0.12 | 0.05 | 0.79 ± 0.06* |
| p42 n=4 |
5.52 ± 3.74 | 9.8 ± 0.74 | 0.06 | 0.55 ± 0.36* |
0.82 ± 0.58 | 1.7 ± 0.11 | 0.02 | 0.49 ± 0.35* |
0.84 ± 0.07 | 1.10 ± 0.11 | 0.33 | 0.75 ± 0.01* |
Raw volume (mm3) measurements of the ipsilateral and contralateral total hippocampus, dentate gyrus, and septal nucleus. Ratio values represent ipsilateral/contralateral (I/C) ratios for each segment measured. P values determined using student t-test.
Significant ratio (p<0.05) when comparing I/C ratio to p8 I/C ratio. Statistics determined by one-way ANOVA or Kruskal-Wallis when applicable.
Following neonatal HI at p7, FA decreases in the ipsilateral fimbria to its nadir at p21 (Table 2). This is significantly slower than the progression of volume loss within the hippocampus. Importantly, degeneration in the ipsilateral dorsolateral septal nucleus continues to progress at p28 and p42 (figure 6C). It is important to note that during this time the contralateral fimbria fornix develops normally with a normal maturational increase in FA (Table 2). This developmental increase in FA is blunted in the ipsilateral fimbria. Quantitative optical density of NF-M expression in the fimbria fornix demonstrates a decrease in ipsilateralcontralateral ratio following HI reflecting both a loss of NF-M expression and volume loss in the affected fimbria (table 2).
Table 2.
Changes in fractional anisotropy (FA) and optical density (OD) in the fimbria fornix after HI
| Age | Fimbria FA | Fimbria Optical Density |
||
|---|---|---|---|---|
| Ipsilateral | Contralateral | p value | Ratio | |
| p8 n=5 |
0.39 ± 0.12 | 0.44 ± 0.14 | 0.3 | 1.06 ± 0.16 |
| p11 n=4 |
0.39 ± 0.04 | 0.48 ± 0.06 | 0.3 | 0.78 ± 0.07* |
| p15 n=4 |
0.42 ± 0.08 | 0.50 ± 0.06 | 0.03 | 0.64 ± 0.33* |
| p21 n=5 |
0.38 ± 0.05 | 0.55 ± 0.04 | <0.001 | 0.59 ± 0.06* |
| p28 n=4 |
0.48 ± 0.09 | 0.60 ± 0.06 | 0.001 | n/a |
| p42 n=4 |
0.55 ± 0.00 | 0.66 ± 0.01 | 0.13 | 0.39 ± 0.29* |
The FA of the fimbria fornix was obtained by manually placing ROIs in selected coronal DEC images. The FA of the ipsilateral fimbria fornix reaches its nadir by p21 and then undergoes recovery in contrast to the contralateral fimbria fornix FA which progressively increases over time as development is occurring.
Quantitative OD date demonstrates a decrease in IC optical density ratio following HI reflecting both a loss of NF-M expression and volume loss in the affected fimbria fornix.
Further evidence that hippocampal injury directs subsequent injury in the ipsilateral fimbria and septum is seen when brains with minimal injury to the hippocampus were compared to the larger group with moderate to severe hippocampal degeneration. The least injured group (n=6) had a higher ipsilateral/contralateral fimbria FA ratio, 0.89±0.1 versus the more injured group, 0.79±0.1, and a larger septal volume, 1.06±0.1mm3, versus the more injured group, 0.89±.09mm3.
Discussion
This is the first study to investigate connectivity-directed neural systems injury in detail using DTI and correlative histopathology in this well-established mouse model of neonatal HI. The most important finding is that degeneration in the ipsilateral hippocampus, fimbria, and dorsolateral septal nuclei occurs in stepwise systems-preferential manner, which can be visualized longitudinally using high resolution DTI.
Our findings show that within 24 hours after neonatal HI there is severe neuronal injury in the ipsilateral hippocampus and overlying cortical regions as expected. While T2-weighted and DW images demonstrate hyperintensity throughout the forebrain, high-resolution DEC images demonstrate specific signal loss in the affected hippocampal alveus indicative of white matter tract injury. Corresponding histology specimens also reveal widespread neuronal injury in the forebrain (fluoro jade-C) as well as axonal damage within the alveus (NF-M).
By p11, the initial hyperintensity seen in T2-weighted and DW images has resolved. DT images show loss of signal (diminished FA) in the fimbria fornix, ipsilateral to the affected hippocampal alveus. At this time point, there is symmetric signal intensity in the fimbria as it enters the septum. Corresponding histology reveals loss of NF-M and agyrophilia in the ipsilateral proximal fimbria fornix in agreement with DT imaging. Damaged axons and cell bodies are identified within this region of NF-M loss. Conversely, NF-M protein is preserved within the ipsilateral terminal fimbria fornix as it enters the septal nuclei.
Beginning at p15, 192 hours post HI, there is initial evidence of porencephaly in the ipsilateral forebrain in both images and histological sections. DT imaging demonstrates progression of signal loss in the ipsilateral proximal fimbria fornix with eventual signal ablation by p42. There is corresponding continued loss of NF-M in the proximal fimbria fornix. At p15, DT imaging of the septal region illustrates slight asymmetry due to initial ipsilateral lateral septal wall collapse with ventricular expansion. Corresponding histology now reveals significant loss of NF-M in the ipsilateral dorsolateral septal nucleus, in the region where some fornical axons terminate. At subsequent time points, there is continued loss of NF-M within the ipsilateral dorsolateral septal nuclei with continued lateral wall collapse and compensatory ventricular expansion. This is clearly illustrated in matching DT images at these same time points.
Post HI, hippocampal neurodegeneration reaches its nadir at p15 but there appears to be some hippocampal recovery as demonstrated by an increase in the ipsilateral-contralateral (IC) ratio at p42. The increase in IC ratio seen in the total hippocampus mirrors the curve seen when analyzing the dentate gyrus alone. This finding is consistent with earlier studies suggesting that plasticity may occur in the immature rodent brain following neonatal HI39. This apparent recovery in ipsilateral hippocampal and dentate volume may also be relevant to the apparent recovery in FA in the ipsilateral fimbria. While these findings are interesting, the present study was not designed to examine hippocampal regeneration following neonatal HI.
Serial volume measurements of the injured septal nuclei demonstrate a significantly slower rate of volume loss when compared to the hippocampus. Specifically, not until p28 has 95% of dorsolateral septal volume loss occurred. Whether the degeneration within the septum represents death or atrophy of these denervated neurons is unclear and thus we have refrained from referring to this septal volume loss as neurodegeneration. We were unable to identify dying neurons in the ipsilateral septum with cresyl violet, fluoro jade-C, or silver stains. Additional studies with anti-NeuN antibody, a specific neuronal marker confirmed that there was no neuronal loss within the ipsilateral dorsolateral septum (data not shown), thus the observed volume loss represents atrophy of the fimbria as it enters the ipsilateral septum as well as possible loss non-neuronal cells within the ipsilateral dorsolateral septum. Furthermore, these findings indicate that the loss of septal volume is not simply a consequence of acute septal neurodegeneration as the result of direct HI injury to the septum. The bilateral nature of most of the afferent connections between hippocampus and the septum24 likely provides adequate trophic support to neurons within the ipsilateral dorsolateral septum thus preventing cell death even in the face of loss of ipsilateral axonal input. These findings are consistent with those found in a model of unilateral fimbria fornix transection40. Overall, the delayed degeneration of the septal nucleus that occurs only after its fimbria innervation is lost supports the connectivity-directed degeneration hypothesis of this and previous work.38, 41
DTI allows unparalleled visualization of this neural system attrition as it is occurring over an extended period of time in the unmyelinated neonatal brain. We confirmed this with imaging of the p7 neonatal brain where structures as small as the fimbria are shown in excellent detail on FA and DEC images but are only barely discernible with conventional T2 imaging. Several groups have demonstrated that FA is sensitive to degradation of white matter integrity after HI, in both human and animals16,17. In this study, in addition to monitoring changes in FA in the ipsilateral fimbria, we utilized DTI to track volumetric changes of gray matter structures in neonatal mouse brains, which is not possible with conventional MRI due to its limited contrast in the neonatal brain and is difficult to obtain with histology. These measurements provide important morphological information about gray matter degeneration and in the present study confirm the delayed nature of injury to the remote target region. Despite the benefits of combining DT images with corresponding immunohistology sections, there are limitations to our methods. Perfusion and fixation techniques may alter results from that which would be obtained with in-vivo imaging. Previous studies in the adult do not suggest significant in-vivo/ex-vivo differences42 but no similar studies exist for the newborn. Also, these methods preclude repeated study of the same animal and the correlation of initial findings with late outcome measures18. However, in-vivo experimental design does not allow for high resolution imaging which is necessary for accurate volume measurements.
This is the first study to investigate the degeneration of a specific neuronal system in detail using the imaging capabilities of diffusion tensor combined with matched histopathology. Most importantly, this study shows that there is prolonged degeneration in the brain following neonatal HI. Thus the degeneration in the immature brain after HI is not a static episode but evolves in a systems-preferential manner. This is demonstrated by progressive and sequential hippocampal, fimbria, and dorsolateral septal degeneration following neonatal HI. Pairing these powerful techniques, allows unparalleled opportunity for determining the neuropathologic substrate of abnormalities seen with advanced imaging and for determining mechanisms of progressive neural systems associated degeneration following neonatal HI.
Acknowledgements
The authors acknowledge the expert technical assistance of Debra L. Flock. These studies are funded by the March of Dimes Foundation (6-08-275) (FJN), National Institutes of Health NS 45059 (FJN), AG16282 (LJM), AG 20012, EB 003543, ES 012665 (SM), and NS 059529 (JZ), as well as a grant from Lehmann Brothers Foundation (FJN).
References
- 1.Nelson KB, Grether JK. Causes of cerebral palsy. Curr Opin Pediatr. 1999;11:487–491. doi: 10.1097/00008480-199912000-00002. [DOI] [PubMed] [Google Scholar]
- 2.Ferriero DM. Neonatal brain injury. N Engl J Med. 2004;351:1985–1995. doi: 10.1056/NEJMra041996. [DOI] [PubMed] [Google Scholar]
- 3.Hagberg H, Ichord R, Palmer C, et al. Animal models of developmental brain injury: relevance to human disease. A summary of the panel discussion from the Third Hershey Conference on Developmental Cerebral Blood Flow and Metabolism. Developmental neuroscience. 2002;24:364–366. doi: 10.1159/000069040. [DOI] [PubMed] [Google Scholar]
- 4.Folkerth RD. Neuropathologic substrate of cerebral palsy. J Child Neurol. 2005;20:940–949. doi: 10.1177/08830738050200120301. [DOI] [PubMed] [Google Scholar]
- 5.Rees S, Inder T. Fetal and neonatal origins of altered brain development. Early Hum Dev. 2005;81:753–761. doi: 10.1016/j.earlhumdev.2005.07.004. [DOI] [PubMed] [Google Scholar]
- 6.Kirton A, Deveber G. Cerebral palsy secondary to perinatal ischemic stroke. Clin Perinatol. 2006;33:367–386. doi: 10.1016/j.clp.2006.03.008. [DOI] [PubMed] [Google Scholar]
- 7.Kirton A, Shroff M, Visvanathan T, deVeber G. Quantified corticospinal tract diffusion restriction predicts neonatal stroke outcome. Stroke. a journal of cerebral circulation. 2007;38:974–980. doi: 10.1161/01.STR.0000258101.67119.72. [DOI] [PubMed] [Google Scholar]
- 8.McKinstry RC, Miller JH, Snyder AZ, et al. A prospective, longitudinal diffusion tensor imaging study of brain injury in newborns. Neurology. 2002;59:824–833. doi: 10.1212/wnl.59.6.824. [DOI] [PubMed] [Google Scholar]
- 9.De Vries LS, Van der Grond J, Van Haastert IC, Groenendaal F. Prediction of outcome in new-born infants with arterial ischaemic stroke using diffusion-weighted magnetic resonance imaging. Neuropediatrics. 2005;36:12–20. doi: 10.1055/s-2005-837544. [DOI] [PubMed] [Google Scholar]
- 10.Eves EM, Boise LH, Thompson CB, et al. Apoptosis induced by differentiation or serum deprivation in an immortalized central nervous system neuronal cell line. J Neurochem. 1996;67:1908–1920. doi: 10.1046/j.1471-4159.1996.67051908.x. [DOI] [PubMed] [Google Scholar]
- 11.Li L, Prevette D, Oppenheim RW, Milligan CE. Involvement of specific caspases in motoneuron cell death in vivo and in vitro following trophic factor deprivation. Mol Cell Neurosci. 1998;12:157–167. doi: 10.1006/mcne.1998.0709. [DOI] [PubMed] [Google Scholar]
- 12.Miller MW, Kuhn PE. Neonatal transection of the infraorbital nerve increases the expression of proteins related to neuronal death in the principal sensory nucleus of the trigeminal nerve. Brain research. 1997;769:233–244. doi: 10.1016/s0006-8993(97)00713-0. [DOI] [PubMed] [Google Scholar]
- 13.Geddes R, Vannucci RC, Vannucci SJ. Delayed cerebral atrophy following moderate hypoxia-ischemia in the immature rat. Developmental neuroscience. 2001;23:180–185. doi: 10.1159/000046140. [DOI] [PubMed] [Google Scholar]
- 14.Le Bihan D, Breton E, Lallemand D, et al. MR imaging of intravoxel incoherent motions: application to diffusion and perfusion in neurologic disorders. Radiology. 1986;161:401–407. doi: 10.1148/radiology.161.2.3763909. [DOI] [PubMed] [Google Scholar]
- 15.Basser PJ, Pierpaoli C. Microstructural and physiological features of tissues elucidated by quantitative-diffusion-tensor MRI. Journal of magnetic resonance. 1996;111:209–219. doi: 10.1006/jmrb.1996.0086. [DOI] [PubMed] [Google Scholar]
- 16.Huppi PS, Maier SE, Peled S, et al. Microstructural development of human newborn cerebral white matter assessed in vivo by diffusion tensor magnetic resonance imaging. Pediatric research. 1998;44:584–590. doi: 10.1203/00006450-199810000-00019. [DOI] [PubMed] [Google Scholar]
- 17.Neil JJ, Shiran SI, McKinstry RC, et al. Normal brain in human newborns: apparent diffusion coefficient and diffusion anisotropy measured by using diffusion tensor MR imaging. Radiology. 1998;209:57–66. doi: 10.1148/radiology.209.1.9769812. [DOI] [PubMed] [Google Scholar]
- 18.Aden U, Dahlberg V, Fredholm BB, et al. MRI evaluation and functional assessment of brain injury after hypoxic ischemia in neonatal mice. Stroke. a journal of cerebral circulation. 2002;33:1405–1410. doi: 10.1161/01.str.0000014608.78503.db. [DOI] [PubMed] [Google Scholar]
- 19.Sizonenko SV, Camm EJ, Garbow JR, et al. Developmental changes and injury induced disruption of the radial organization of the cortex in the immature rat brain revealed by in vivo diffusion tensor MRI. Cereb Cortex. 2007;17:2609–2617. doi: 10.1093/cercor/bhl168. [DOI] [PMC free article] [PubMed] [Google Scholar]
- 20.Drobyshevsky A, Derrick M, Wyrwicz AM, et al. White matter injury correlates with hypertonia in an animal model of cerebral palsy. J Cereb Blood Flow Metab. 2007;27:270–281. doi: 10.1038/sj.jcbfm.9600333. [DOI] [PubMed] [Google Scholar]
- 21.Glenn OA, Ludeman NA, Berman JI, et al. Diffusion tensor MR imaging tractography of the pyramidal tracts correlates with clinical motor function in children with congenital hemiparesis. Ajnr. 2007;28:1796–1802. doi: 10.3174/ajnr.A0676. [DOI] [PMC free article] [PubMed] [Google Scholar]
- 22.Raisman G. The connexions of the septum. Brain. 1966;89:317–348. doi: 10.1093/brain/89.2.317. [DOI] [PubMed] [Google Scholar]
- 23.Raisman G. A comparison of the mode of termination of the hippocampal and hypothalamic afferents to the septal nuclei as revealed by electron microscopy of degeneration. Experimental brain research. Experimentelle Hirnforschung. 1969;7:317–343. doi: 10.1007/BF00237319. [DOI] [PubMed] [Google Scholar]
- 24.Swanson LW, Cowan WM. The connections of the septal region in the rat. The Journal of comparative neurology. 1979;186:621–655. doi: 10.1002/cne.901860408. [DOI] [PubMed] [Google Scholar]
- 25.DeFrance JF, Kitai ST, Shimono T. Electrophysiological analysis of the hippocampal-septal projections. I. Response and topographical characteristics. Experimental brain research. Experimentelle Hirnforschung. 1973;17:447–462. doi: 10.1007/BF00234861. [DOI] [PubMed] [Google Scholar]
- 26.Rice JE, Vannucci RC, Brierley JB. The influence of immaturity on hypoxicischemic brain damage in the rat. Ann Neurol. 1981;9:131–141. doi: 10.1002/ana.410090206. [DOI] [PubMed] [Google Scholar]
- 27.Ditelberg JS, Sheldon RA, Epstein CJ, Ferriero DM. Brain injury after perinatal hypoxia-ischemia is exacerbated in copper/zinc superoxide dismutase transgenic mice. Pediatric research. 1996;39:204–208. doi: 10.1203/00006450-199602000-00003. [DOI] [PubMed] [Google Scholar]
- 28.Graham EM, Sheldon RA, Flock DL, et al. Neonatal mice lacking functional Fas death receptors are resistant to hypoxic-ischemic brain injury. Neurobiol Dis. 2004;17:89–98. doi: 10.1016/j.nbd.2004.05.007. [DOI] [PubMed] [Google Scholar]
- 29.de Olmos JS, Beltramino CA, de Lorenzo S de Olmos. Use of an amino-cupric-silver technique for the detection of early and semiacute neuronal degeneration caused by neurotoxicants, hypoxia, and physical trauma. Neurotoxicology and teratology. 1994;16:545–561. doi: 10.1016/0892-0362(94)90033-7. [DOI] [PubMed] [Google Scholar]
- 30.Northington FJ, Koehler RC, Traystman RJ, Martin LJ. Nitric oxide synthase 1 and nitric oxide synthase 3 protein expression is regionally and temporally regulated in fetal brain. Dev Brain Res. 1996;95:1–14. doi: 10.1016/0165-3806(96)00051-x. [DOI] [PubMed] [Google Scholar]
- 31.Northington FJ, Traystman RJ, Koehler RC, et al. Regional and cellular expression of glial (GLT1) and neuronal (EAAC1) glutamate transporter proteins in ovine fetal brain. Neuroscience. 1998;85:1183–1194. doi: 10.1016/s0306-4522(97)00673-8. [DOI] [PubMed] [Google Scholar]
- 32.Lariviere RC, Julien JP. Functions of intermediate filaments in neuronal development and disease. Journal of neurobiology. 2004;58:131–148. doi: 10.1002/neu.10270. [DOI] [PubMed] [Google Scholar]
- 33.Schmued LC, Stowers CC, Scallet AC, Xu L. Fluoro-Jade C results in ultra high resolution and contrast labeling of degenerating neurons. Brain research. 2005;1035:24–31. doi: 10.1016/j.brainres.2004.11.054. [DOI] [PubMed] [Google Scholar]
- 34.Mori S, Zhang J. Principles of diffusion tensor imaging and its applications to basic neuroscience research. Neuron. 2006;51:527–539. doi: 10.1016/j.neuron.2006.08.012. [DOI] [PubMed] [Google Scholar]
- 35.DeBoy CA, Zhang J, Dike S, et al. High resolution diffusion tensor imaging of axonal damage in focal inflammatory and demyelinating lesions in rat spinal cord. Brain. 2007;130:2199–2210. doi: 10.1093/brain/awm122. [DOI] [PubMed] [Google Scholar]
- 36.Zhang J, Richards LJ, Miller MI, et al. Characterization of Mouse Brain and Its Development using Diffusion Tensor Imaging and Computational Techniques. Conf Proc IEEE Eng Med Biol Soc. 2006;1:2252–2255. doi: 10.1109/IEMBS.2006.259388. [DOI] [PubMed] [Google Scholar]
- 37.Huang H, Zhang J, van Zijl PC, Mori S. Analysis of noise effects on DTI-based tractography using the brute-force and multi-ROI approach. Magn Reson Med. 2004;52:559–565. doi: 10.1002/mrm.20147. [DOI] [PubMed] [Google Scholar]
- 38.Martin LJ, Brambrink AM, Koehler RC, Traystman RJ. Primary Sensory and forebrain motor systems in the newborn brain are preferentially damaged by hypoxia-ischemia. The Journal of Comparitive Neurology. 1997;377:262–285. doi: 10.1002/(sici)1096-9861(19970113)377:2<262::aid-cne8>3.0.co;2-1. [DOI] [PubMed] [Google Scholar]
- 39.Vert P, Daval JL. [Cell death and neurogenesis after hypoxia: a brain repair mechanism in the developing rat?] Bulletin de l’Academie nationale de medecine. 2006;190:469–481.; discussion 481-464
- 40.Ginsberg SD, Martin LJ. Ultrastructural analysis of the progression of neurodegeneration in the septum following fimbria-fornix transection. Neuroscience. 1998;86:1259–1272. doi: 10.1016/s0306-4522(98)00136-5. [DOI] [PubMed] [Google Scholar]
- 41.Northington FJ, Ferriero DM, Graham EM, et al. Early Neurodegeneration after Hypoxia-Ischemia in Neonatal Rat Is Necrosis while Delayed Neuronal Death Is Apoptosis. Neurobiol Dis. 2001;8:207–219. doi: 10.1006/nbdi.2000.0371. [DOI] [PubMed] [Google Scholar]
- 42.Sun SW, Liang HF, Le TQ, et al. Differential sensitivity of in vivo and ex vivo diffusion tensor imaging to evolving optic nerve injury in mice with retinal ischemia. NeuroImage. 2006;32:1195–1204. doi: 10.1016/j.neuroimage.2006.04.212. [DOI] [PubMed] [Google Scholar]