Abstract
Immunoaffinity monolith pretreatment columns have been coupled with capillary electrophoresis separation in poly(methyl methacrylate) (PMMA) microchips. Microdevices were designed with 8 reservoirs to enable the electrically controlled transport of selected analytes and solutions to carry out integrated immunoaffinity extraction and electrophoretic separation. The PMMA microdevices were fabricated reproducibly and with high fidelity by solvent imprinting and thermal bonding methods. Monoliths with epoxy groups for antibody immobilization were prepared by direct in-situ photopolymerization of glycidyl methacrylate and ethylene dimethacrylate in a porogenic solvent consisting of 70% dodecanol and 30% hexanol. Anti-fluorescein isothiocyanate (FITC) was utilized as a model affinity group in the monoliths, and the immobilization process was optimized. A mean elution efficiency of 92% was achieved for the monolith-based extraction of FITC-tagged human serum albumin. FITC-tagged proteins were purified from a contaminant protein and then separated electrophoretically using these devices. The developed immunoaffinity column/capillary electrophoresis microdevices show great promise for combining sample pretreatment and separation in biomolecular analysis.
Introduction
Microchip capillary electrophoresis (CE) is developing into an ever-broadly applied analysis method.1, 2 A major benefit of miniaturization is a reduction of both sample and reagent consumption, making some previously challenging analyses more attractive. To widen the applicability and enhance the performance of CE microchips, various sample pretreatment techniques, including concentration and dilution,3, 4 purification and filtering,5 dialysis,6, 7 cell culture and handling,8 etc., have been demonstrated.
Recently, functionalized photopolymerized monoliths have been used for sample preparation in chemical,9 DNA10 and protein anaysis.11 Monoliths can be potentially advantageous relative to packed columns due to their simplicity of preparation and the broad availability of options for surface modification.12, 13 The large surface area of monolithic beds enables relatively high sample loading capacity, while UV polymerization allows accurate and reproducible placement of a monolith within a microfluidic network, making monoliths well suited for integrated analysis microchips. Monolith surfaces can be designed with epoxy groups or other reactive moieties, which can be modified readily for various applications. Tanaka’s group14 reported an epoxy resin-based polymer monolith for the chromatographic separation of nucleic acids. Others have carried out enzyme immobilization via epoxy groups on monolithic supports.15, 16
The attachment of antibodies to affinity columns has been and continues to be a topic of interest.17 Such supports have seen use in immunopurification,18 the detection of selected analytes by chromatographic immunoassays,19 and the removal of potential interferences.20 Advantages of using antibodies for such work include their strong affinity for target analytes, high selectivity, and the availability of antibodies to a wide range of targets.21 Indeed, Hage et al.22 used a glycidyl methacrylate (GMA) monolith derivatized with antibodies for ultrafast immunoextraction. Although previous antibody-based monolith work has shown promise in electrochromatographic or affinity chromatographic separation inside conventional capillaries, extension to the microchip format has lagged. Importantly, in a micromachined system, an affinity monolith could be integrated directly with rapid, on-chip separation.
Here, we report the development of microchip devices where affinity pretreatment is coupled with electrophoretic analysis. Anti-fluorescein isothiocyanate (FITC) was immobilized on a photopolymerized monolith via the reaction between monolith epoxy and antibody amine groups. By flowing appropriate solutions through the monolith electrophoretically, FITC-tagged proteins could be extracted selectively. Sample loading, rinsing, elution and separation were performed in an automated manner on a single chip by controlling potentials applied to appropriate reservoirs. In these microdevices, we have purified FITC-tagged proteins from other contaminant species, and then separated the target analytes by rapid microchip CE. Advantages of these integrated microchips include their high analyte specificity, ease of automation, and general design, enabling broad potential applications.
Experimental Section
Reagents
Ethylene glycol dimethacrylate (EGDMA, 98%), GMA (97%), 2,2-dimethoxy-2-phenylacetophenone (DMPA, 98%), acetonitrile (99.5%), 1-dodecanol (98%) and hydroxypropyl cellulose (HPC) were from Aldrich (Milwaukee, WI). Cyclohexanol was from J. T. Baker (Phillipsburg, NJ). Goat anti-FITC was from Biomeda (Foster City, CA). FITC-immunoglobulin G (IgG) from human serum, FITC-human serum albumin (HSA), bovine serum albumin (BSA), acetic acid, glycine, Tris and Tween-20 were obtained from Sigma (St. Louis, MO). Recombinant green fluorescent protein (GFP) was purchased from Clontech (Mountain View, CA). The running buffer (10 mM sodium phosphate, 15 mM sodium chloride, pH 7.2) was from Pierce (Rockford, IL). Analysis of protein mixtures in microchips can be hindered by nonspecific adsorption to the walls, resulting in poor reproducibility; thus, we prepared buffer containing 0.5% HPC to decrease nonspecific protein adsorption.23-25
Microchip design and fabrication
The microchips have 8 reservoirs as shown in Fig. 1A. Reservoirs 1-4 were the inlets for rinse solution, a protein standard, sample and elution buffer, respectively. Reservoir 5 served as the waste reservoir during sample preparation. Reservoir 6 contained separation buffer, reservoir 7 was for injection waste, and reservoir 8 was the separation high-voltage reservoir. The PMMA microchips were fabricated using a combination of photolithography, solvent imprinting and thermal bonding methods described previously.24-26 Glass microscope slides (75 mm×50 mm×1 mm) were purchased from Fisher (Fair Lawn, NJ). Following standard photolithographic procedures, 100-μm-wide, 10-μm-high SU-8 (Microchem, Newton, MA) features were patterned on microscope slides as the mold for imprinting microfluidic channels. PMMA substrates (46 mm×26 mm×3 mm; Acrylite FF, Cyro Industries, Rockaway, NJ) were solvent imprinted with the SU-8 template as described previously.26 The patterned pieces were annealed at 80 °C for 24 hours to evaporate residual solvent before thermal bonding at 110 °C to PMMA cover plates with 0.3-mm-diameter drilled access reservoirs. A photograph of a completed microchip is shown in Fig. 1B. Microchips were examined under an optical microscope after enclosure to check for defects or blockage in the channels.
Fig. 1.

Microchip layout. (A) Design schematic, reservoirs are: 1-rinse, 2-protein standard, 3-sample, 4-elute, 5-waste, 6-buffer, 7-inject waste, and 8-high voltage. The monolith location is indicated by the red line. (B) Photograph of a fabricated microchip.
Photopatterning of monoliths in microchips
UV-initiated polymerization enabled the patterning of a monolithic bed within a microchip. The prepolymer solution of 0.3 g GMA (functional monomer), 0.2 g EGDMA (cross-linker), 0.35 g 1-dodecanol and 0.15 g cyclohexanol (porogen), and 0.025 g DMPA (initiator) was sonicated for 3 min followed by bubbling nitrogen gas for 10 min before loading into a device. An aluminum foil mask with a 5 mm×2 mm opening was used to define the 2-mm-long monolith inside the channel at the location indicated in Fig. 1A. The monolith was polymerized in situ for 15 min under a 400 W UV lamp (Dymax, Torrington, CT). After polymerization, the monolith was washed with 2-propanol for 1 hour to remove any remaining monomer and flush out the porogen.
Immobilization of anti-FITC
Our conditions for antibody immobilization were adapted from those optimized by Jiang et al.22 The dry monoliths were sequentially wetted with 2-propanol and running buffer for 5 min each. 1 mg/mL anti-FITC in 0.05 M borate buffer (pH 8.0) was filled into the monolith, and the microchip reservoirs were filled with buffer to avoid solution evaporation during reaction. Then the whole chip was sealed with 3M Scotch tape (St. Paul, MN) and put on a shaker at 37°C for 24 hours. Next, any remaining epoxy groups were blocked by flowing 100 mM Tris buffer (pH 8) through the monolith for 1 hour. Finally, the entire chip was flushed with phosphate running buffer. The immobilization process was optimized by measuring the fluorescence intensity of FITC-HSA retained by the fabricated affinity monoliths.
Affinity monolith characterization
We tested 6 different monolith integrated devices, five times each, to characterize binding and elution. FITC-HSA solution (10-100 μg/mL) was loaded on the anti-FITC monolith by applying 600 V between reservoirs 2 and 5 for 30 min. We estimated the flow rate under these conditions to be ~60 nL/min by monitoring the time it took for FITC-HSA to migrate from reservoir 2 to 5. To eliminate non-specific interaction between anti-FITC and proteins, 0.5% Tween-20 was added to the protein solution. We compared the elution ability of 200 mM acetic acid and 200 mM glycine (flushed for 5 min by applying 200 V between reservoirs 4 and 7) by measuring the monolith fluorescence intensities before and after elution. Weak acids in this concentration range were recommended by the antibody supplier (Biomeda) and have been used previously to elute antigens from antibodies. 27 Acetic acid was more effective than glycine at eluting FITC-HSA, and was used in all subsequent experiments; acetic acid concentrations less than 200 mM were evaluated, but elution was much slower. We also calculated the elution efficiency for our monoliths, which was defined as the ratio of the decrease in fluorescence intensity after elution to the original background-subtracted fluorescence signal on the monolith. Each fluorescence measurement was calculated from the average signal at three distinct locations on the monolith. Measurement of the fluorescence decrease on the monolith was done (instead of directly probing the fluorescence of the eluting analyte) because the low-pH elution solution lowers the fluorescence of eluting compounds. In contrast, residual fluorescent material on the monolith can be detected reproducibly after a neutral-pH rinse.
Microchip operation
Two high-voltage power supplies were used for sample loading and electrophoresis. A holder was built for the 8 platinum electrodes placed in the various reservoirs. A custom-designed high-voltage switching box was employed to control the potentials applied in reservoirs in the devices. The switching box had two independent high voltage inputs (600 V and 1400 V), one ground input and eight outputs. FITC-tagged protein samples in reservoir 3 (20 μg/mL FITC-HSA, 50 μg/mL FITC-IgG and 300 μg/mL GFP) were loaded on the monolith by applying 600 V to reservoir 5 while grounding reservoir 3 for 30 s. The mixture of proteins was left to bind to the immunoaffinity monolith statically for 30 min to ensure adequate time for antigen-antibody interaction. Next, the unbound analyte was rinsed from the monolith with buffer solution for 30 s by applying 600 V in reservoir 5 while grounding reservoir 1. Then, retained analytes were eluted with 200 mM acetic acid by applying 600 V to reservoir 7 while grounding reservoir 4. Finally, during separation 1400 V was applied to reservoir 8, while maintaining reservoirs 4 and 7 at 600 V and grounding reservoir 6. All reservoirs not maintained at a specified potential in the above processes were allowed to float. The laser-induced fluorescence detection system was used as described previously.24
Results and Discussion
Monolith characterization and antibody immobilization
Fig. 2 shows SEM images of a well-defined porous monolith inside a microfluidic channel. The polymer is cast uniformly over the cross section of the column. We note that the microtoming and drying processes for sample preparation may cause the monolith to detach in places from the channel surface. These images indicate that the fabricated monoliths have appropriate porosity for low back pressure and sufficient surface area for protein immobilization. Although the epoxy groups on the monoliths can be converted into the diol form which reacts with proteins more efficiently than the unopened epoxy,28 we employed direct reaction for protein immobilization. This approach is simpler and does not require solvents such as acetonitrile that are needed for the diol method.
Fig. 2.

End-on SEM images of monoliths inside a microfluidic channel. (A) Whole channel image; (B) magnified view.
Monolithic extraction
The utility of our protein purification and separation devices was first tested with FITC-HSA. We explored several reagents for blocking residual epoxy groups on the monolith after antibody attachment: 1 mg/mL BSA, 100 mM Tris pH 8.0 and 100 mM aspartic acid. We measured the fluorescence intensity of FITC-HSA retained by immunoaffinity columns after flowing both rinse and elution buffer to determine the most effective blocking solution. FITC-HSA did not elute well from BSA-blocked monoliths, probably due to strong nonspecific adsorption to either BSA or the monolith. Aspartic acid (100 mM) appeared to affect the binding capacity, since lower fluorescence signals were observed on these columns compared with Tris-blocked monoliths. Thus, we used 100 mM Tris (pH 8) to passivate residual groups on the monolith after anti-FITC immobilization.
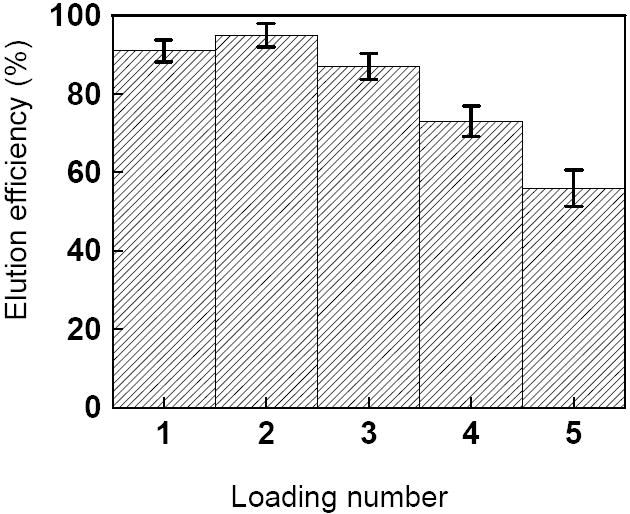
It is important to characterize the stability and performance of analytical microdevices. Here we tested the reproducibility and the monolith extraction efficiency using FITC-HSA as a model protein. Six affinity monolith integrated PMMA microchips were selected to evaluate the binding and elution procedures, as described in the Experimental Section. Fig. 3 gives a detailed look at the elution repeatability for successive loadings in the microdevices tested; the average elution efficiency and standard deviation for each loading number are shown. The decrease in efficiency with successive loadings probably originates either from nonspecific adsorption of FITC-tagged proteins on the monolith or the inactivation of the binding site on some monolith-coupled antibodies. By comparing the average values of the elution efficiency for the 6 devices tested, we conclude that our immunoaffinity monoliths can be used up to 3 times with elution efficiency above 80%.
Fig. 3.

The mean elution efficiency for successive loadings of 20 μg/mL FITC-HSA in six different monoliths. Error bars indicate one standard deviation.
Immunoaffinity extraction and detection of FITC-HSA
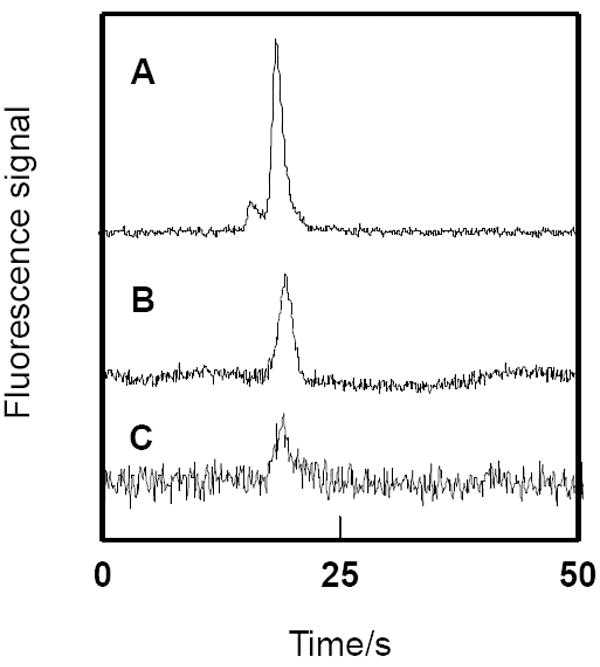
A key advantage of our microchips is the integration of two processes in a single automated and miniaturized platform. Sample pretreatment was performed in a monolithic bed, while separation was carried out in an electrophoresis channel. Using the conditions optimized above, we investigated the ability of our devices to do affinity purification and separation of selected proteins. FITC-HSA (50 μg/mL) was loaded on the monolith electrophoretically described in the Experimental Section. For each loading of FITC-HSA, replicate elutions and separations were performed until no peak was detected with S/N>3. Elution/injection times that were too short led to insufficient fluorescence signal, while longer times provided greater signal in the electropherograms, but also led to broader bands. As a compromise between signal and resolution, we used a 1 min elution/injection time. The electropherograms in Fig. 4 show that the first eluted fraction (Fig. 4A) yielded the highest peak, while subsequent fractions (Fig. 4B-C) gave a lower signal. After three successive elution/injections, the fluorescence intensity of residual FITC-HSA on the monolith was near background, indicating that nearly all had been eluted. From the ~100 pL injection volume and the signal obtained from eluted analyte compared to signal from standards runs without monolith purification, we estimate that a few pg of eluted FITC-HSA were injected in the CE column and detected. Based on the ~3 min it takes to elute all the antigen from the monolith and the ~1 mm/s analyte velocity during elution, we estimate that our monoliths retain a few ng of target compound. An on-chip preconcentration step29 after elution would significantly increase the fraction of retained material injected and detected in the CE channel.
Fig. 4.

Three successive microchip electropherograms of 50 μg/mL FITC-HSA loaded on and then eluted from an integrated affinity monolith.
Immunoaffinity purification and microchip CE of a protein mixture
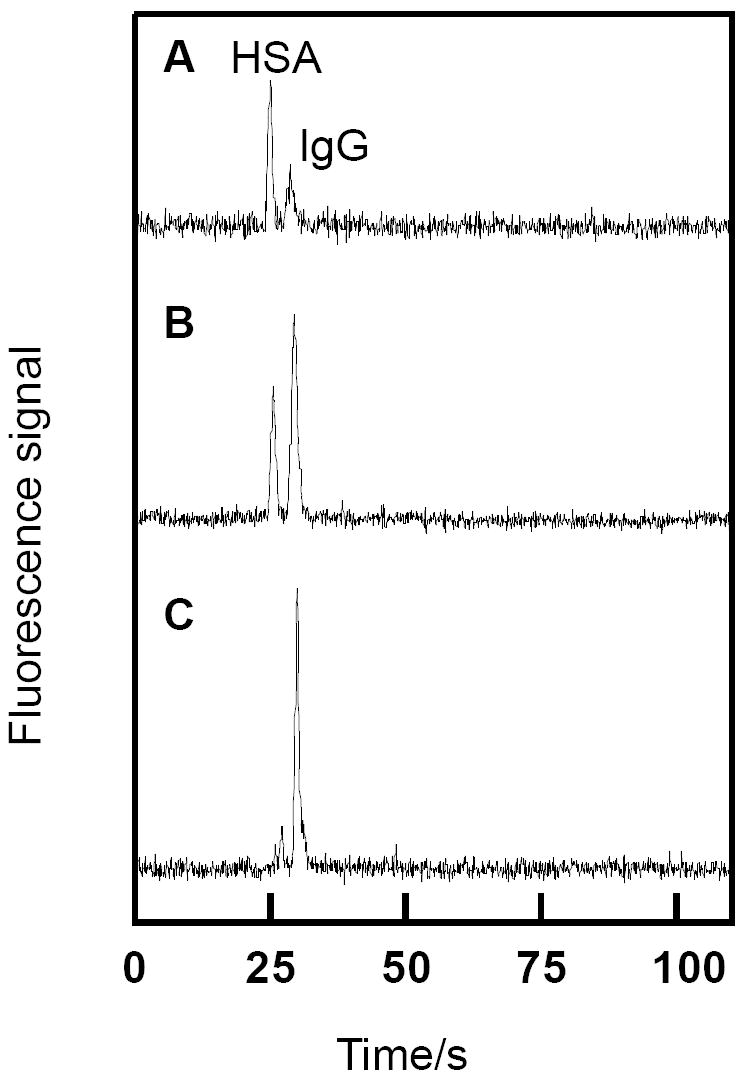
The developed immunoaffinity microchips were also applied to integrated purification and separation experiments. Since GFP lacks the FITC group recognized by the affinity monolith, GFP was used an interfering protein in a mixture of FITC-HSA and FITC-IgG. Fig. 5 shows microchip CE of three successive elution/injections of FITC-tagged proteins from the monolith. Importantly, the unretained GFP is not seen in the electropherograms. The elution dynamics of FITC-IgG and FITC-HSA differ, as is visible in the electropherograms. FITC-HSA eluted more easily, with most coming off the first two elution/injection steps. In contrast, FITC-IgG had a relatively low signal in the separation following the first elution/injection (Fig. 5A), while the signal was highest for the run after the third elution/injection (Fig. 5C). No peaks appeared for either FITC-HSA or FITC-IgG in a fourth elution/injection (data not shown).
Fig. 5.

Analyte-dependent monolith elution. (A-C) Three successive monolith elutions followed by microchip CE of FITC-HSA and FITC-IgG. The elution/injection time was 1 min for each run. 20 μg/mL FITC-HSA and 50 μg/mL FITC-IgG were loaded on the monolith.
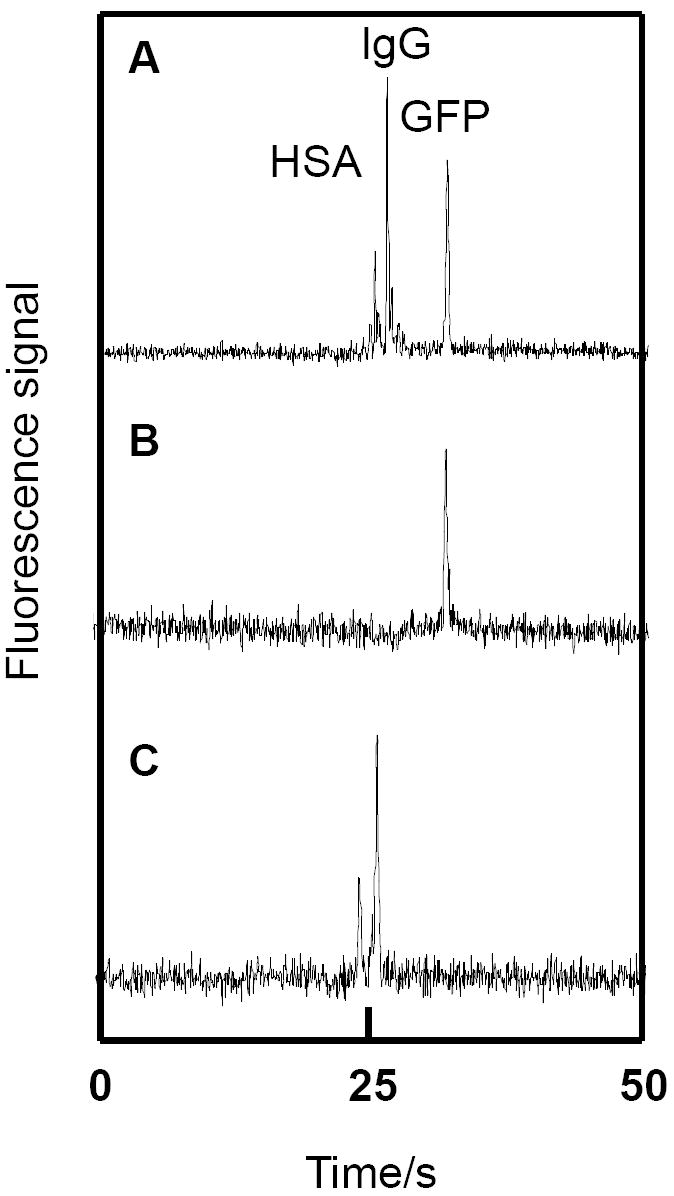
A microchip electropherogram of GFP, FITC-HSA, and FITC-IgG without affinity pretreatment is shown in Fig. 6A. In contrast, in Fig. 6B only one peak (GFP) appeared when the monolith rinse solution was injected and separated, indicating that GFP was unretained, while the FITC-tagged proteins were captured. Finally, Fig. 6C shows a separation after elution/injection of the retained FITC-tagged proteins. Importantly, the GFP peak is absent, and only bands corresponding to FITC-tagged analytes are observed. The signal-to-noise ratio (S/N) for the FITC-IgG peak for the same protein concentration loaded in the sample reservoir is of the same magnitude in a monolith-purified CE microsystem (Fig. 6C, S/N = 13) compared to a standard microchip CE setup (Fig. 6A, S/N = 20). The power of the integrated monoliths as implemented is in purification rather than enrichment of target compounds in complex mixtures.
Fig. 6.

Purification and separation of FITC-tagged IgG and HSA from GFP. (A) Microchip CE of 20 μg/mL FITC-HSA, 50 μg/mL FITC-IgG and 300 μg/mL GFP. (B) Microchip CE of the rinse solution after loading 20 μg/mL FITC-HSA, 50 μg/mL FITC-IgG and 300 μg/mL GFP on the monolith. (C) Microchip CE of the eluate from the anti-FITC monolith in (B).
The results of our microchip devices show that FITC-labeled proteins can be captured, purified, eluted and separated electrophoretically. This valuable capability of integrated microdevices provides an automated way to purify complex samples before microchip separation. Hence, our microdevices should help to meet the demands for targeted analysis in biological mixtures.
Conclusions
Microfluidic chips were fabricated and evaluated for automated immunoaffinity extraction integrated with electrophoretic separation of FITC-tagged proteins. Short (~2 mm) microchannel monoliths were formed as immunoaffinity columns for selectively capturing FITC-tagged analytes. Anti-FITC, an affinity ligand, was attached on the monolith after reacting with the epoxy groups for 24 hours. FITC-HSA and FITC-IgG were selectively retained by the immunoaffinity column and then eluted with 200 mM acetic acid. An elution efficiency of 92% was achieved for FITC-HSA, and the eluted protein mixture was separated rapidly. These microchips could be applied readily to the analysis of other biomolecules, provided appropriate affinity ligands are attached to the monolith. The low dead volume injection of microchip electrophoresis coupled with high surface area monoliths makes this method ideal for the efficient purification and analysis of selected analytes in complex samples. Further improvements to this approach should provide a setup for high-throughput bioanalysis of target proteins in clinical mixtures.
Acknowledgments
This work was supported by a Presidential Early Career Award for Scientists and Engineers (PECASE) through the National Institutes of Health (EB006124).
References
- 1.Dittrich PS, Tachikawa K, Manz A. Anal Chem. 2006;78:3887–3907. doi: 10.1021/ac0605602. [DOI] [PubMed] [Google Scholar]
- 2.Shadpour H, Musyimi H, Chen J, Soper SA. J Chromatogr A. 2006;1111:238–251. doi: 10.1016/j.chroma.2005.08.083. [DOI] [PubMed] [Google Scholar]
- 3.Gong M, Wehmeyer KR, Limbach PA, Arias F, Heineman WR. Anal Chem. 2006;78:3730–3737. doi: 10.1021/ac0521798. [DOI] [PMC free article] [PubMed] [Google Scholar]
- 4.Song S, Singh AK, Shepodd TJ, Kirby BJ. Anal Chem. 2004;76:2367–2373. doi: 10.1021/ac035290r. [DOI] [PubMed] [Google Scholar]
- 5.Wolfe KA, Breadmore MC, Ferrance JP, Power ME, Conroy JF, Norris PM, Landers JP. Electrophoresis. 2002;23:727–733. doi: 10.1002/1522-2683(200203)23:5<727::AID-ELPS727>3.0.CO;2-O. [DOI] [PubMed] [Google Scholar]
- 6.Huynh BH, Fogarty BA, Martin RS, Lunte SM. Anal Chem. 2004;76:6440–6447. doi: 10.1021/ac049365i. [DOI] [PubMed] [Google Scholar]
- 7.Roddy ES, Price M, Ewing AG. Anal Chem. 2003;75:3704–3711. doi: 10.1021/ac034223u. [DOI] [PubMed] [Google Scholar]
- 8.Goto M, Sato K, Murakami A, Tokeshi M, Kitamori T. Anal Chem. 2005;77:2125–2131. doi: 10.1021/ac040165g. [DOI] [PubMed] [Google Scholar]
- 9.Yu C, Davey MH, Svec F, Frechet JMJ. Anal Chem. 2001;73:5088–5096. doi: 10.1021/ac0106288. [DOI] [PubMed] [Google Scholar]
- 10.Breadmore MC, Wolfe KA, Arcibal IG, Leung WK, Dickson D, Giordano BC, Power ME, Ferrance JP, Feldman SH, Norris PM, Landers JP. Anal Chem. 2003;75:1880–1886. doi: 10.1021/ac0204855. [DOI] [PubMed] [Google Scholar]
- 11.Hahn R, Podgornik A, Merhar M, Schallaun E, Jungbauer A. Anal Chem. 2001;73:5126–5132. doi: 10.1021/ac0103165. [DOI] [PubMed] [Google Scholar]
- 12.Benes MJ, Horak D, Svec F. J Sep Sci. 2005;28:1855–1875. doi: 10.1002/jssc.200500186. [DOI] [PubMed] [Google Scholar]
- 13.Eeltink S, Svec F. Electrophoresis. 2007;28:137–147. doi: 10.1002/elps.200600573. [DOI] [PubMed] [Google Scholar]
- 14.Hosoya K, Hira N, Yamamoto K, Nishimura M, Tanaka N. Anal Chem. 2006;78:5729–5735. doi: 10.1021/ac0605391. [DOI] [PubMed] [Google Scholar]
- 15.Ueki Y, Umemura T, Li J, Odake T, Tsunoda K. Anal Chem. 2004;76:7007–7012. doi: 10.1021/ac040079g. [DOI] [PubMed] [Google Scholar]
- 16.Jiang Z, Smith NW, Ferguson PD, Taylor MR. Anal Chem. 2007;79:1243–1250. doi: 10.1021/ac061871f. [DOI] [PubMed] [Google Scholar]
- 17.Fassina G, Verdoliva A, Odierna MR, Ruvo M, Cassini G. J Mol Recognit. 1996;9:564–569. doi: 10.1002/(sici)1099-1352(199634/12)9:5/6<564::aid-jmr302>3.0.co;2-f. [DOI] [PubMed] [Google Scholar]
- 18.Anastase-Ravion S, Ding Z, Pelle A, Hoffman AS, Letourneur D. J Chromatogr B. 2001;761:247–254. doi: 10.1016/s0378-4347(01)00336-x. [DOI] [PubMed] [Google Scholar]
- 19.Lonnberg M, Carlsson J. J Chromatogr A. 2006;1127:175–182. doi: 10.1016/j.chroma.2006.06.016. [DOI] [PubMed] [Google Scholar]
- 20.Branovic K, Lattner G, Barut M, Strancar A, Josic D, Buchacher A. J Immunol Methods. 2002;271:47–58. doi: 10.1016/s0022-1759(02)00339-3. [DOI] [PubMed] [Google Scholar]
- 21.Guzman NA, Phillips TM. Anal Chem. 2005;77:60A–67A. doi: 10.1021/ac053325c. [DOI] [PubMed] [Google Scholar]
- 22.Jiang T, Mallik R, Hage DS. Anal Chem. 2005;77:2362–2372. doi: 10.1021/ac0483668. [DOI] [PubMed] [Google Scholar]
- 23.Sanders JC, Breadmore MC, Kwok YC, Horsman KM, Landers JP. Anal Chem. 2003;75:986–994. doi: 10.1021/ac020425z. [DOI] [PubMed] [Google Scholar]
- 24.Kelly RT, Woolley AT. Anal Chem. 2003;75:1941–1945. doi: 10.1021/ac0262964. [DOI] [PubMed] [Google Scholar]
- 25.Kelly RT, Pan T, Woolley AT. Anal Chem. 2005;77:3536–3541. doi: 10.1021/ac0501083. [DOI] [PubMed] [Google Scholar]
- 26.Sun X, Peeni BA, Yang W, Becerril HA, Woolley AT. J Chromatogr A. 2007;1162:162–166. doi: 10.1016/j.chroma.2007.04.002. [DOI] [PMC free article] [PubMed] [Google Scholar]
- 27.Jackman R, Schmerr MJ. Electrophoresis. 2003;24:892–896. doi: 10.1002/elps.200390112. [DOI] [PubMed] [Google Scholar]
- 28.Mallik R, Jiang T, Hage DS. Anal Chem. 2004;76:7013–7022. doi: 10.1021/ac049001q. [DOI] [PubMed] [Google Scholar]
- 29.Kelly RT, Li Y, Woolley AT. Anal Chem. 2006;78:2565–2570. doi: 10.1021/ac0521394. [DOI] [PubMed] [Google Scholar]


