Abstract
Proton magnetic resonance spectroscopy (1-H MRS) has revealed changes of metabolites in acute cerebral infarction. Although the drastic changes of lactate and N-acetyl-aspartate have been reported to be useful indicators of the ischemic damage in both humans and experimental animals, lipid signals are also detected by the short echo time sequence 1–5 days after ischemia. The objective of this study was to find a novel technique to isolate lactate signals from lipid signals in the ischemic brain. First, MRS was used to study the lipid and lactate components of a spherical phantom in vitro, and parameters were established to separate these components in vitro. Then, MR measurements were obtained from the brains of middle cerebral artery occlusion rats. All MR measurements were performed using a 7-T (300 MHz), 18.3-cm-bore superconducting magnet (Oxford Magnet Technologies) interfaced to a Unity INOVA Imaging System (Varian Technologies). T2-weighted images were obtained from a 1.0-mm-thick coronal section using a 3-cm field of view. It is well known that lipid has a shorter and lactate a longer T2 relaxation time. These distinct magnetic characteristics allowed us to separate the lactate signal from the lipid signal. Thus, adjustment of the echo time is essential to analyze the metabolites in acute cerebral infarction, which may be useful in both the clinic and laboratory.
Keywords: Ischemia, Lactate, Lipid, MRS, Stroke
1. Introduction
Proton MR spectroscopy is a noninvasive method that allows measurement of various metabolites in vivo, such as choline-containing compounds (Cho), creatine and creatine phosphate (Cr), N-acetyl aspartate (NAA), and pathologic levels of lactate (Bottomleym, 1987; Frahm et al., 1989; Sappey-Marinier et al., 1992). Detection of lactate by in vivo proton magnetic resonance spectroscopy may provide a means of identifying regions of metabolic stress in brain and other human tissue, potentially identifying regional ischemia in stroke (Federico et al., 1994; Saunders, 2000; Schwarcz et al., 2003). Lactate is a redox partner of pyruvate, which is a metabolic intermediate between glycolysis and the Krebs or tricarboxylic acid (TCA) cycle (Kelley et al., 1999). When oxygen availability is low, due to a perfusion deficiency or other metabolic stress, the TCA cycle rate drops, and pyruvate produced during glycolysis accumulates and is converted to lactate (Bruhn et al., 1989; Duijn et al., 1992). Thus, detection of lactate is useful for a marker of anaerobic metabolism in stroke (Abe et al., 2004; Federico et al., 1998).
Moreover, MRS signals from lipids in brain have also been observed to increase after ischemic brain injury (Gasparovic et al., 2001). There are numerous sources of lipid contamination in the stroke patients, which impair resolution of the lactate part of the spectrum, because a large part of lactate resonance overlaps with lipid in the usual MRS measurements (Serrai et al., 2003). Thus, in order to directly measure the lactate methyl resonances, the large overlapping lipid resonances must be eliminated, and lactate editing sequences are currently under investigation to discern lactate from lipids, which would allow us to dissect the pathophysiological mechanisms in stroke (Gujar et al., 2005).
The advantages of performing proton MRS at higher field strengths include better signal to noise ratio (SNR) and increased spectral, spatial and temporal resolution, allowing the acquisition of high quality, easily quantifiable spectra in acceptable scan times. Proton MRS at 7 T can provide precise biochemical information from distinct regions of the rat brain noninvasively that can be used for monitoring of disease progression (Gasparovic et al., 2001; Zhang et al., 2001). Moreover, this technique enables lactate quantification in cases where lipid peak is overlapped with the lactate peak at short echo times. In the present study, we carried out a basic study to clarify the characteristics of signal change of lactate and lipid that occurred in high field NMR. We report that lipid signals rapidly decrease in longer TE thus allowing separation of these two components. It is well known that lipid has a shorter and lactate a longer T2 relaxation time. These distinct magnetic characteristics allowed us to separate the lactate signal from the lipid signal. Thus, our findings demonstrate a simple method for lactate and lipid quantification in the ischemic brain.
2. Results
2.1. MRS in vitro
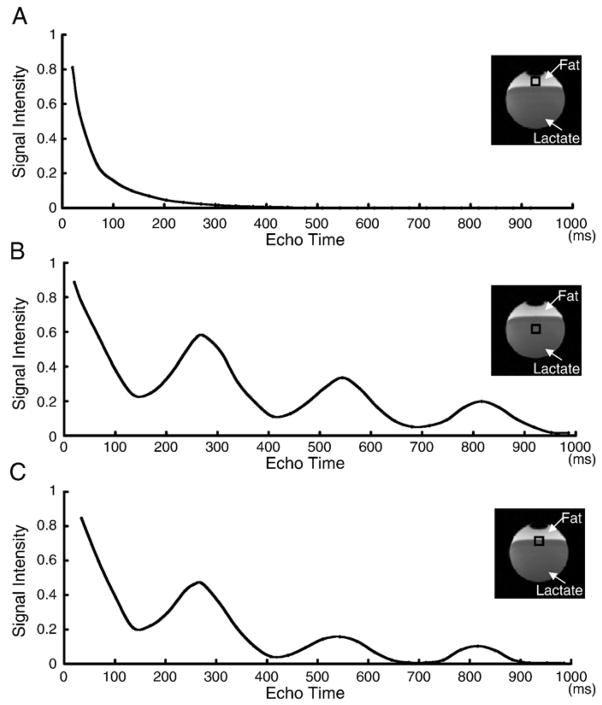
Signal intensities acquired from the fat component of the spherical phantom using a STEAM sequence with different TE (ranging from 20 ms to 1000 ms) were plotted in Fig. 1A. Signals gradually decreased in the longer TE interval and disappeared at and over 300 ms. Moreover, signals from the lactate component of the spherical phantom showed sinusoidal diminution with different TE (Fig. 1B). Fig. 1C showed the mixed signal intensities acquired from both the fat and lactate.
Fig. 1.
Change of signal intensities of lipid (A), lactate (B), and both (C) in the spherical phantom using a STEAM sequence with different TE. Although lipid signals gradually decreased in the longer TE (A), lactate signal showed sign-curve diminution with different TE (B).
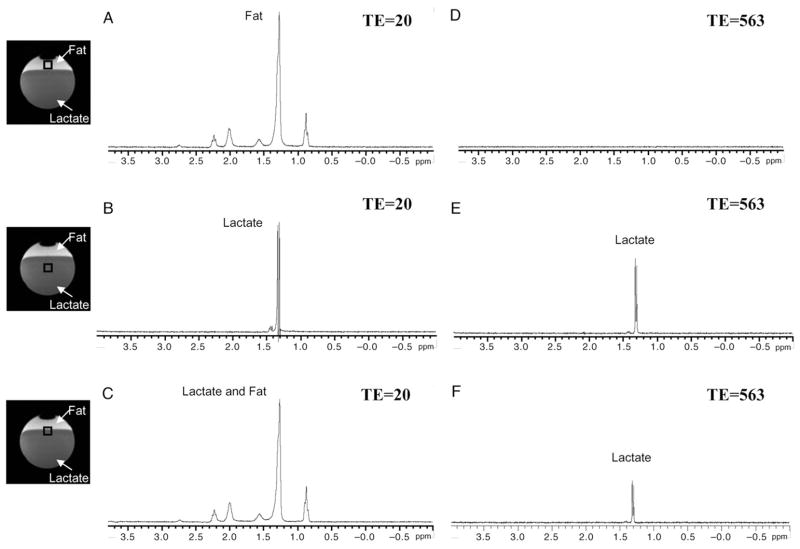
The proton MR spectra was obtained from the fat layer (Figs. 2A, D), the lactate layer (Figs. 2B, E), and the boundary zone between the fat and lactate layers (Figs. 2C, F). As predicted from the data in Fig. 1, fat and lactate signals overlapped at low (20 ms) TE (Fig. 2C). This indicates that differential expression between fat and lactate would be difficult for conventional MRS sequences, which normally utilizes low TE. However, when TE was lengthened beyond 300 ms (563 ms in Figs. 2D–F), the fat signal was not detected (Fig. 2D) and the lactate signal (Fig. 2E) was isolated (Fig. 2F).
Fig. 2.
Proton MR spectra from the fat (A, D), the lactate (B, E), and border zone (C, F) in the spherical phantom. Frequency of signal acquired from fat is overlapped with lactate when TE is set as short (20 ms) (C). However, signal of fat disappeared and only lactate signal became obvious when TE was set as longer (563 ms) (F).
2.2. MRI and MRS in vivo
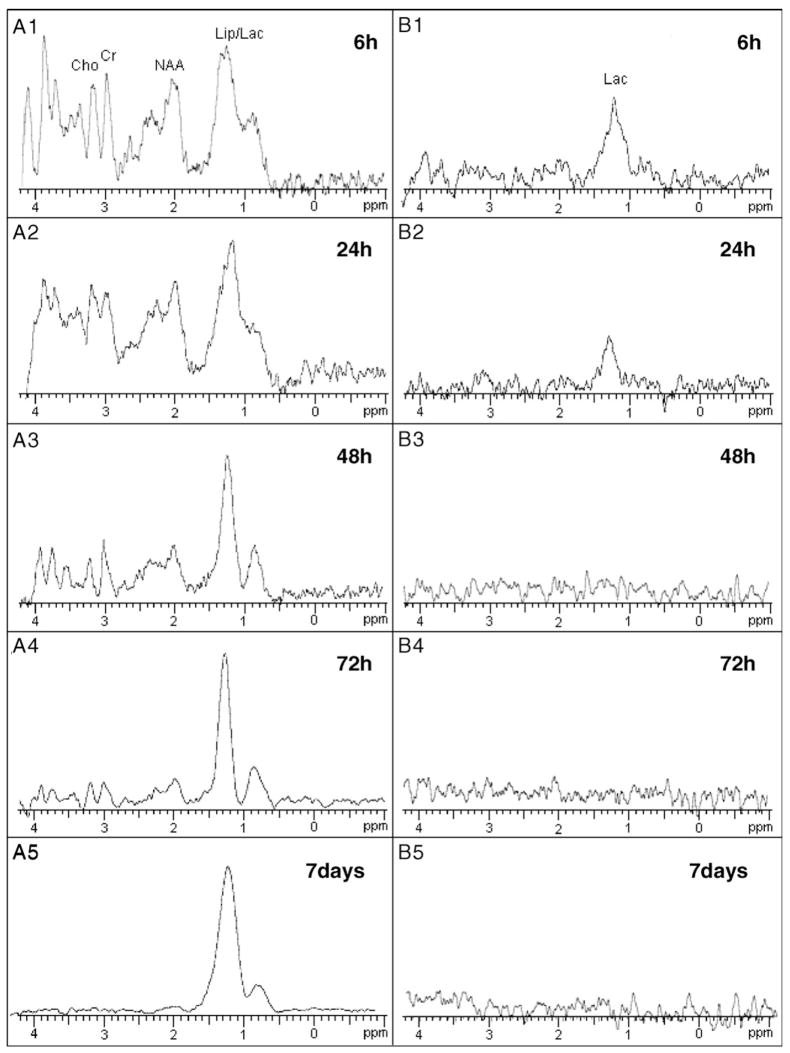
Fig. 3 shows T2-weighted images (top row) and diffusion-weighted images (bottom row) from the brain of a rat at 6, 24, 48, 72 h, and 7 days after MCAO, respectively. MR spectra were acquired from the high intensity area on the diffusion-weighted images (open boxes). Fig. 4A shows a proton MR spectra acquired with short TE (20 ms) of the ischemic brain lesions indicated in Fig. 3 (open box). Lipid signals overlapped with lactate signals at 6 h after MCAO, but gradually increased over the time course of 7 days (Figs. 4A1–5). However, only the lactate signal was obvious with longer TE (563 ms) (Fig. 4B). Lactate signals were obvious 6 and 24 h after MCAO (B1 and B2, respectively), but were not present at 48 h or longer after MCAO. These data are summarized in Fig. 5.
Fig. 3.
T2-weighted images (A1–5) and diffusion-weighted images (B1–5) from the brain of a rat from the ischemic lesion at 6, 24, 48, 72 h, and 7 days after MCAO, respectively. MRS spectra were acquired from the high intensity area on the diffusion-weighted images (open box). Scale bar=5 mm.
Fig. 4.
In vivo proton MR spectra with short TE (20 ms) of ischemic brain lesions at 6 (A1), 24 (A2), 48 (A3), 72 h (A4), and 7 days (A5) after MCAO. Lactate signal was overlapped with lipid, which was detected 6 h after MCAO, and gradually increased over the time course of 7 days. Lactate signals were isolated with longer TE (563 ms) (B1–5), and were obvious only 6 and 24 h after MCAO (B1 and B2, respectively).
Fig. 5.
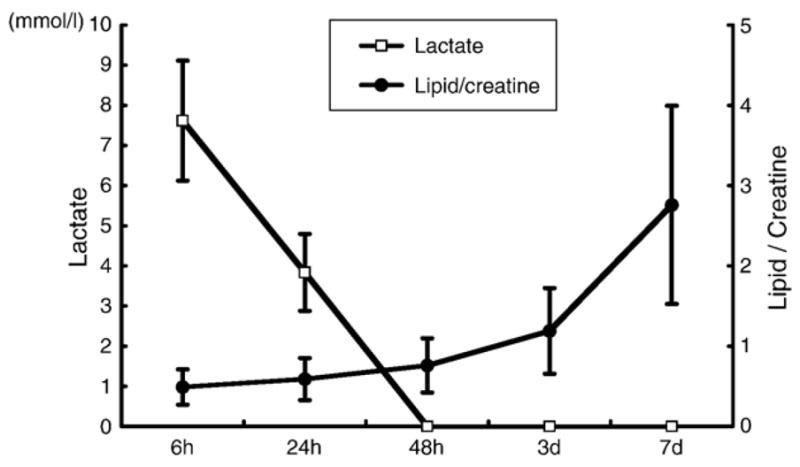
Summary of lactate signal (open squire) and lipid/creatine ratio (black round) over the time course (n=5).
2.3. Histological examination of lipid at 6 h and 7 days post-MCAO
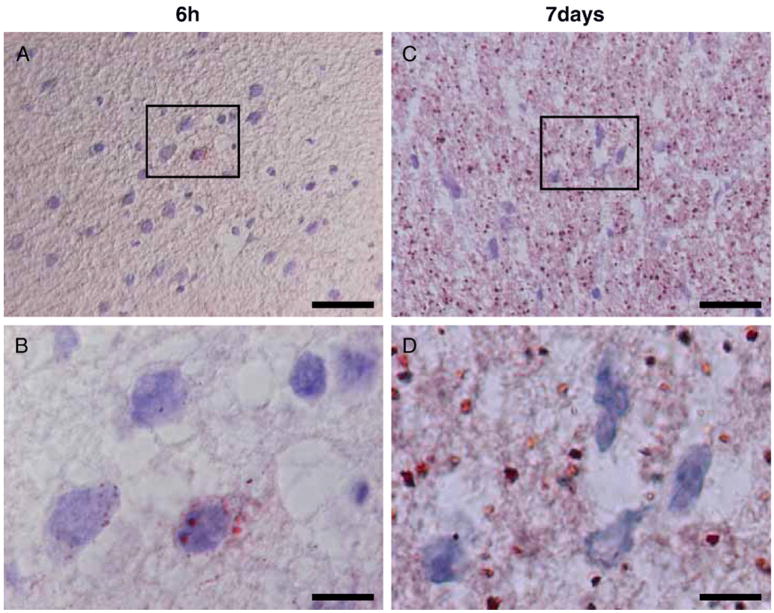
Histological examination revealed the presence of lipid droplets in the ischemic lesions. Fig. 6 shows microphotographs of ischemic brain lesion tissue with oil red staining, which revealed the presence of lipid. Lipid droplets were less in the ischemic lesion 6 h after MCAO (Fig. 6A), and were mainly present in the cytoplasm of cells (Fig. 6B). However, a large number of lipid droplets were present both in the cells and extracellular matrix in the lesions 7 days after MCAO (Figs. 6C, D).
Fig. 6.
Microphotographs of ischemic brain lesion tissue with oil red staining. Lipid droplets were less in the ischemic lesion 6 h after MCAO (A), and were mainly present in the cytoplasm of cells (B). However, a large number of lipid droplets were present both in the cells and extracellular matrix in the lesions 7 days after MCAO (C, D). Photos of higher magnification 6 h and 7 days after MCAO were shown in panels C and D, respectively. Scale bar=20 μm (A, C), 5 μm (B, D).
3. Discussion
In the present study, STEAM with longer TE using 7-T NMR allowed us to demonstrate that MRS-detectable lactate increases rapidly in the infarcted rat brain 6 h after MCAO and disappears within 48 h following MCAO. In addition, MRS-detectable lipid is also observed 6 h after MCAO and continues increasing over 1 week, which was confirmed by histological examination.
Several methods for obtaining volume-localized proton MRS are currently in use. These include stimulated echo acquisition mode (STEAM) (Frahm et al., 1989) and point resolved spectroscopy (PRESS) (Bottomley, 1987) sequences, which generate a stimulated echo and spin echo of magnetization inside the volume of interest, respectively. In the present study, we used STEAM because PRESS is not preferred to measure the lactate signal (Isobe et al., 2005), and STEAM is suitable to detect the lipid signal in shorter TE (Hwang et al., 1989).
Lactate signal using a STEAM sequence showed sinusoidal diminution with different TE by J-coupling effect (Isobe et al., 2005), and signals can be detected in the prolonged TE (more than 800 ms). Moreover, lipid signal exponentially decreased with longer TE and disappeared at about 300 ms of TE. Thus, lactate signals can be separated from the lipid signal with longer TE (544 ms).
Detection of lactate by in vivo proton MRS may provide useful information on metabolic stress in brain, potentially identifying the degree of ischemia (Bruhn et al., 1989; Duijn et al., 1992; Gideon et al., 1994; Mathews et al., 1995). Therefore, if lactate can be quantitatively evaluated, it could have an important clinical impact. However, as we have discussed before, a large part of the lactate signal overlapped with lipid signals in conventional MRS measurements (Kimura et al., 2001; Shimizu et al., 1996). Thus, lactate has been thought to rise early after the insult in the acute phase (<24 h) and may remain high over a long period into the chronic phase (>7 days) (Sappey-Marinier et al., 1992), which could lead us to an inappropriate understanding of the pathophysiological status in the ischemic lesion. In the present study, we could measure isolated lactate signals in the ischemic lesion, demonstrating that they rapidly rise after stroke but disappear within several days.
The present study also demonstrates that MRS-detectable lipids increase markedly in the ischemic rat brain 6 h after MCAO. Histological examination revealed the presence of neutral lipid droplets in ischemic legions. Although our results consist of the previous findings that MRS lipid signals from brain 1 day after stroke arise from macrophage phagocytosis of cellular membrane (Brierley and Brown, 1982; Gasparovic et al., 2001), the present results demonstrate that cell digestion starts several hours after the ischemic insult.
Thus, MRS may provide a technique of quantification of lactate and lipid in various pathological conditions of the brain that may be clinically useful by evaluating the severity of cerebral ischemia and the status of the patient in response to the therapy.
4. Experimental procedure
4.1. Cerebral ischemic model
The use of animals in this study was approved by the animal care and use committee of Sapporo Medical University and all procedures were carried out in accordance with institutional guidelines. The rat middle cerebral artery occlusion (MCAO) model was used as a stroke model. We induced transient middle cerebral artery occlusion for 45 min by using a previously described method of intraluminal vascular occlusion (Honma et al., 2006; Iihoshi et al., 2004; Longa et al., 1989). Adult female Sprague–Dawley rats (n=5) weighing 250–300 g were initially anesthetized with 5% isoflurane and maintained under anesthesia with 1.5% isoflurane in a mixture of 70% N2O and 30% O2 with mechanical ventilation. Rectal temperature was maintained at 37 °C with an infrared heat lamp. The left femoral artery was cannulated for measuring blood pH, pO2, and pCO2 every 30 min throughout the surgery, which remained normal throughout the procedure. A length of 20.0–22.0 mm 4–0 surgical Dermalon suture with the tip rounded by heating near a flame was advanced from the external carotid artery into the lumen of the internal carotid artery until it blocked the origin of the MCA.
4.2. MRI
Rats were anesthetized with ketamine (75 mg/kg) and xylazine (10 mg/kg) i.p. Each rat was placed in an animal holder/MRI probe apparatus and positioned inside the magnet (Liu et al., 2006; Nomura et al., 2005). The animal’s head was held in place inside the RF coil. All MRI measurements were performed using a 7-T, 18-cm-bore superconducting magnet (Oxford Magnet Technologies) interfaced to a Unity INOVA console (Oxford Instruments, UK and Varian, Inc., Palo Alto, CA). T2-weighted images were obtained from a 1.0-mm-thick coronal section using a 3-cm field of view, TR=3000 ms, TE=30 ms, and reconstructed using a 512×512 image matrix. Diffusion-weighted images were obtained from a 1.0-mm-thick coronal section using a 3-cm field of view, TR=3000 ms, TE=37 ms, and reconstructed using a 256×256 image matrix.
4.3. MR spectroscopy
Magnetic resonance spectroscopy was carried out using a stimulated echo acquisition mode sequence (STEAM) (Frahm et al., 1989). Volume selection was achieved with 3 sinc-shaped RF pulses (1.2-ms duration, 5-kHz bandwidth). Crusher gradients (2-ms duration, 58 mT/m strength) were applied before and after each 90 pulse to destroy undesirable coherences. No outer volume saturation (OVS) was performed. After adjustment of the magnetic field homogeneity, the full-width at half-maximum of the water peak was typically less than 20 Hz in the VOI. Spectral bandwidth was 8.33 kHz, described by 4096 data points. The echo was centered in the acquisition window. Data were filtered by a Gaussian function centered at the top of the echo, with an LB of 7 Hz. Data visualization was improved using a Fourier interpolation (zero-filling) to 8192 points before Fourier transformation. The conventional “Internal Reference Method” cannot be used to quantify the lactate because of its “J-coupling effect”.
4.4. MRS in vitro
Magnetic resonance spectroscopy was carried out using a STEAM sequence, (TR=3000 ms, TE=20–1000 ms, TM=30 ms, Average=64, and the voxel size of 5.0×5.0×5.0 mm3). Water suppression was performed using CHESS pulses (sinc RF pulses, 8-ms duration, 500-Hz bandwidth), followed by crusher gradients (3-ms duration, 58 mT/m strength). A 4-cm diameter spherical phantom containing 100 mM lactate (Sigma-Aldrich, St. Louis, MO) and fat (olive oil, Otsuka Pharmaceutical Co., Ltd., Tokyo, Japan) (Menon et al., 1993) was used. A transverse image using a T1-weighted spin-echo sequence (TR=500 ms, TE=10 ms) was used for placing the volume of interest (VOI) on lactate and/or fat in the phantom.
4.5. MRS in vivo
Accurate positioning of the brain was performed to center the image slice 5 mm posterior to the rhinal fissure with the head of the rat held in a flat skull position. MRS measurements were obtained 6 h, 24 h, 48 h, 72 h and 1 week after MCAO. VOI was selected from basal ganglia lesion which showed high intensity area in both DWI and T2WI (Honma et al., 2006). Water suppression was performed using CHESS pulses (sinc RF pulses, 8-ms duration, 500-Hz bandwidth), followed by crusher gradients (3-ms duration, 58 mT/m strength). Stimulated echo signals (TR = 3000 ms, TE = 20 and 563 ms, TM=30 ms, Average=256 and 1024, and the voxel size of 2.0×2.0×2.0 mm3) were acquired from each VOI, which required 12 min 48 s and 51 min 12 s, respectively. On 7-T MRS, the following metabolite peaks were found: lipids(Lip) at 0.9 ppm (CH3) and 1.3 ppm (CH2); lactate(Lac) at 1.3 ppm; N-acetyl Aspartate(NAA) at 2.02 ppm; choline-containing compounds(Cho) at 3.26 ppm and the total creatine(Cr) at 3.0 ppm.
4.5.1. Estimation of lactate
The semiquantitative approach with an external reference method was used for lactate spectral analysis (Shimizu et al., 1996). For the external reference, we prepared 10 mmol/l of lactic acid (Sigma, St. Louis, MO) solution in a small plastic sphere (diameter, 1 cm). These concentrations of chemicals were determined through preliminary experiments so that effective signal-to noise ratio (SNR>100) was achieved (Duc et al., 1998).
The external reference was set to the RF coil so that its position was not altered throughout the study. A spectrum was first obtained from the brain of the rat and then from the reference without moving the rat.
4.5.2. Estimation of lipid
On the basis of creatine (Cr), lipid peak areas were quantitated as a relative ratio (Parsons et al., 2000). The creatine peak integrated area from the voxel within the ischemic region was used as the internal reference for each rat. This allowed comparison of metabolite levels over time and between different rats.
4.6. Histological examination
The rats were deeply anesthetized with sodium pentobarbital (50 mg/kg, i.p.) and perfused through the heart, first with PBS, and then with a fixative solution containing 10% paraformal-dehyde in 0.14 M Sorensen’s phosphate buffer, pH 7.4. Brains were removed and cut into 10-μm sections with a cryostat. Oil Red (Sigma St. Louis, MO) and hematoxylin staining solution was placed on the sections for 10 min and rinsed in phosphate-buffered saline (PBS). Coronal images were obtained using a Olympus microscope.
Acknowledgments
This work was supported in part by grants from the Japanese Ministry of Education, Science, Sports and Culture (16390414, 16591450), Mitsui Sumitomo Insurance Welfare Foundation, JST (Japan, Science and Technology Corporation) Innovation Plaza Hokkaido Project, the National Multiple Sclerosis Society (U.S.A) (RG2135; CA1009A10), the National Institutes of Health (NS43432), and the Medical and Rehabilitation and Development Research Services of the Department of Veterans Affairs.
References
- Abe K, Yoshimura H, Tanaka H, Fujita N, Hikita T, Sakoda S. Comparison of conventional and diffusion-weighted MRI and proton MR spectroscopy in patients with mitochondrial encephalomyopathy, lactic acidosis, and stroke-like events. Neuroradiology. 2004;46(2):113–117. doi: 10.1007/s00234-003-1138-2. [DOI] [PubMed] [Google Scholar]
- Bottomley PA. Spatial localization in NMR spectroscopy in vivo. Ann N Y Acad Sci. 1987;508:333–348. doi: 10.1111/j.1749-6632.1987.tb32915.x. [DOI] [PubMed] [Google Scholar]
- Brierley JB, Brown AW. The origin of lipid phagocytes in the central nervous system: I. The intrinsic microglia. J Comp Neurol. 1982;211(4):397–406. doi: 10.1002/cne.902110406. [DOI] [PubMed] [Google Scholar]
- Bruhn H, Frahm J, Gyngell ML, Merboldt KD, Hanicke W, Sauter R. Cerebral metabolism in man after acute stroke: new observations using localized proton NMR spectroscopy. Magn Reson Med. 1989;9(1):126–131. doi: 10.1002/mrm.1910090115. [DOI] [PubMed] [Google Scholar]
- Duijn JH, Matson GB, Maudsley AA, Hugg JW, Weiner MW. Human brain infarction: proton MR spectroscopy. Radiology. 1992;183(3):711–718. doi: 10.1148/radiology.183.3.1584925. [DOI] [PubMed] [Google Scholar]
- Duc CO, Trabesinger AH, Weber OM, Meier D, Walder M, Wieser HG, Boesiger P. Quantitative 1-H MRS in the evaluation of mesial temporal lobe epilepsy in vivo. Magn Reson Imaging. 1998;16(8):969–979. doi: 10.1016/s0730-725x(98)00123-4. [DOI] [PubMed] [Google Scholar]
- Federico F, Conte C, Simone IL, Giannini P, Liguori M, Picciola E, Tortorella C, Ferrari E. Proton magnetic resonance spectroscopy in patients with ischemic stroke. Ital J Neurol Sci. 1994;15(8):413–420. doi: 10.1007/BF02339905. [DOI] [PubMed] [Google Scholar]
- Federico F, Simone IL, Lucivero V, Giannini P, Laddomada G, Mezzapesa DM, Tortorella C. Prognostic value of proton magnetic resonance spectroscopy in ischemic stroke. Arch Neurol. 1998;55(4):489–494. doi: 10.1001/archneur.55.4.489. [DOI] [PubMed] [Google Scholar]
- Frahm J, Bruhn H, Gyngell ML, Merboldt KD, Hanicke W, Sauter R. Localized high-resolution proton NMR sectroscopy using stimulated echoes: initial applications to human brain in vivo. Magn Reson Med. 1989;9(1):79–93. doi: 10.1002/mrm.1910090110. [DOI] [PubMed] [Google Scholar]
- Gasparovic C, Rosenberg GA, Wallace JA, Estrada EY, Roberts K, Pastuszyn A, Ahmed W, Graham GD. Magnetic resonance lipid signals in rat brain after experimental stroke correlate with neutral lipid accumulation. Neurosci Lett. 2001;301(2):87–90. doi: 10.1016/s0304-3940(01)01616-0. [DOI] [PubMed] [Google Scholar]
- Gideon P, Sperling B, Arlien-Soborg P, Olsen TS, Henriksen O. Long-term follow-up of cerebral infarction patients with proton magnetic resonance spectroscopy. Stroke. 1994;25(5):967–973. doi: 10.1161/01.str.25.5.967. [DOI] [PubMed] [Google Scholar]
- Gujar SK, Maheshwari S, Bjorkman-Burtscher I, Sundgren PC. Magnetic resonance spectroscopy. J Neuroophthalmol. 2005;25(3):217–226. doi: 10.1097/01.wno.0000177307.21081.81. [DOI] [PubMed] [Google Scholar]
- Honma T, Honmou O, Iihoshi S, Harada K, Houkin K, Hamada H, Kocsis JD. Intravenous infusion of immortalized human mesenchymal stem cells protects against injury in a cerebral ischemia model in adult rat. Exp Neurol. 2006;199:56–66. doi: 10.1016/j.expneurol.2005.05.004. [DOI] [PMC free article] [PubMed] [Google Scholar]
- Hwang JH, Egnaczyk GF, Ballard E, Dunn RS, Holland SK, Ball WS., Jr Proton MR spectroscopic characteristics of pediatric pilocytic astrocytomas. Am J Neuroradiol. 1989;19(3):535–540. [PMC free article] [PubMed] [Google Scholar]
- Iihoshi S, Honmou O, Houkin K, Hashi K, Kocsis JD. A therapeutic window for intravenous administration of autologous bone marrow after cerebral ischemia in adult rats. Brain Res. 2004;1007:1–9. doi: 10.1016/j.brainres.2003.09.084. [DOI] [PubMed] [Google Scholar]
- Isobe T, Matsumura A, Anno I, Kawamura H, Muraishi H, Umeda T, Nose T. Effect of J coupling and T2 relaxation in assessing of methyl lactate signal using PRESS sequence MR spectroscopy. Igaku Butsuri. 2005;25(2):68–74. [PubMed] [Google Scholar]
- Kelley DA, Wald LL, Star-Lack JM. Lactate detection at 3T: compensating J coupling effects with BASING. J Magn Reson Imaging. 1999;9(5):732–737. doi: 10.1002/(sici)1522-2586(199905)9:5<732::aid-jmri17>3.0.co;2-q. [DOI] [PubMed] [Google Scholar]
- Kimura T, Sako K, Gotoh T, Tanaka K, Tanaka T. In vivo single-voxel proton MR spectroscopy in brain lesions with ring-like enhancement. NMR Biomed. 2001;14(6):339–349. doi: 10.1002/nbm.711. [DOI] [PubMed] [Google Scholar]
- Liu H, Honmou O, Harada K, Nakamura K, Houkin K, Hamada K, Kocsis JD. Neuroprotection by PlGF gene-modified human mesenchymal stem cells after cerebral ischemia. Brain. 2006;129(10):2734–2745. doi: 10.1093/brain/awl207. [DOI] [PMC free article] [PubMed] [Google Scholar]
- Longa EZ, Weinstein PR, Carlson S, Cummins R. Reversible middle cerebral artery occlusion without craniectomy in rats. Stroke. 1989;20:84–91. doi: 10.1161/01.str.20.1.84. [DOI] [PubMed] [Google Scholar]
- Mathews VP, Barker PB, Blackband SJ, Chatham JC, Bryan RN. Cerebral metabolites in patients with acute and subacute strokes: concentrations determined by quantitative proton MR spectroscopy. Am J Roentgenol. 1995;165(3):633–638. doi: 10.2214/ajr.165.3.7645484. [DOI] [PubMed] [Google Scholar]
- Menon DK, Lockwood GG, Peden CJ, Cox IJ, Sargentoni J, Bell JD, Coutts GA, Whitwam JG. In vivo fluorine-19 magnetic resonance spectroscopy of cerebral halothane in postoperative patients: preliminary results. Magn Reson Med. 1993;30(6):680–684. doi: 10.1002/mrm.1910300605. [DOI] [PubMed] [Google Scholar]
- Nomura T, Honmou O, Harada K, Houkin K, Hamada H, Kocsis JD. Intravenous infusion of BDNF gene-modified human mesenchymal stem cells protects against injury in a cerebral ischemia model in adult rat. Neuroscience. 2005;136:161–169. doi: 10.1016/j.neuroscience.2005.06.062. [DOI] [PMC free article] [PubMed] [Google Scholar]
- Parsons MW, Li T, Barber PA, Yang Q, Darby DG, Desmond PM, Gerraty RP, Tress BM, Davis SM. Combined (1)H MR spectroscopy and diffusion-weighted MRI improves the prediction of stroke outcome. Neurology. 2000;55(4):498–505. doi: 10.1212/wnl.55.4.498. [DOI] [PubMed] [Google Scholar]
- Sappey-Marinier D, Calabrese G, Hetherington HP, Fisher SN, Deicken R, Van Dyke C, Fein G, Weiner MW. Proton magnetic resonance spectroscopy of human brain: applications to normal white matter, chronic infarction, and MRI white matter signal hyperintensities. Magn Reson Med. 1992;26(2):313–327. doi: 10.1002/mrm.1910260211. [DOI] [PubMed] [Google Scholar]
- Saunders DE. MR spectroscopy in stroke. Br Med Bull. 2000;56(2):334–345. doi: 10.1258/0007142001903256. [DOI] [PubMed] [Google Scholar]
- Schwarcz A, Natt O, Watanabe T, Boretius S, Frahm J, Michaelis T. Localized proton MRS of cerebral metabolite profiles in different mouse strains. Magn Reson Med. 2003;49(5):822–827. doi: 10.1002/mrm.10445. [DOI] [PubMed] [Google Scholar]
- Serrai H, Senhadji L, Wang G, Akoka S, Stroman P. Lactate doublet quantification and lipid signal suppression using a new biexponential decay filter: application to simulated and 1H MRS brain tumor time-domain data. Magn Reson Med. 2003;50(3):623–626. doi: 10.1002/mrm.10544. [DOI] [PubMed] [Google Scholar]
- Shimizu H, Kumabe T, Tominaga T, Kayama T, Hara K, Ono Y, Sato K, Arai N, Fujiwara S, Yoshimoto T. Noninvasive evaluation of malignancy of brain tumors with proton MR spectroscopy. Am J Neuroradiol. 1996;17(4):737–747. [PMC free article] [PubMed] [Google Scholar]
- Zhang X, Ugurbil K, Chen W. Microstrip RF surface coil design for extremely high-field MRI and spectroscopy. Magn Reson Med. 2001;46(3):443–450. doi: 10.1002/mrm.1212. [DOI] [PubMed] [Google Scholar]


