

Abstract
Myelin-forming glial cells transplanted into the demyelinated spinal cord can form compact myelin and improve conduction properties. However, little is known of the expression and organization of voltage-gated ion channels in the remyelinated central axons or whether the exogenous cells provide appropriate signaling for the maturation of nodes of Ranvier. Here, we transplanted olfactory ensheathing cells from green fluorescent protein (GFP)-expressing donor rats [GFP-olfactory ensheathing cells (OECs)] into a region of spinal cord demyelination and found extensive remyelination, which included the development of mature nodal, paranodal, and juxtaparanodal domains, as assessed by ultrastructural, immunocytochemical, and electrophysiological analyses. In remyelinated axons, Nav1.6 was clustered at nodes, whereas Kv1.2 was aggregated in juxtaparanodal regions, recapitulating the distribution of these channels within mature nodes of uninjured axons. Moreover, the recruitment of Nav and Kv channels to specific membrane domains at remyelinated nodes persisted for at least 8 weeks after GFP-OEC transplantation. In vivo electrophysiological recordings demonstrated enhanced conduction along the GFP-OEC-remyelinated axons. These findings indicate that, in addition to forming myelin, engrafted GFP-OECs provide an environment that supports the development and maturation of nodes of Ranvier and the restoration of impulse conduction in central demyelinated axons.
Keywords: axon, spinal cord injury, potassium channels, olfactory bulb, sodium channel, remyelination, transplantation, demyelination
Introduction
The restoration of rapid and secure impulse conduction after demyelination is dependent on the acquisition of myelin sheaths and the clustering of specific molecules within discrete domains of the myelinated axon membrane. Abundant evidence demonstrates that transplantation of myelin-forming cells into demyelinated spinal cord can lead to remyelination (Baron-Van Evercooren and Blakemore, 2004; Kocsis and Sasaki, 2005). A specialized glial cell, the olfactory ensheathing cell (OEC), is associated with olfactory receptor neurons from their peripheral origin to their central projection in the outer nerve layer of the olfactory bulb (Doucette, 1991). This apparent support role of OECs in axonal growth in the adult CNS has stimulated research to study the potential of OEC transplants to encourage axonal regeneration in spinal cord injury models (Li et al., 1997, 1998; Ramon-Cueto et al., 1998, 2000; Imaizumi et al., 2000a,b). Although there has been some controversy as to whether OECs can form myelin (Boyd et al. 2004), a clonal line of OECs (Franklin et al., 1996) and OECs prepared from olfactory bulb (Imaizumi et al., 1998; Sasaki et al., 2004) remyelinate spinal cord axons.
In myelinated axons, voltage-gated sodium (Nav) channels are aggregated in high density at nodes of Ranvier, whereas Shaker-type potassium (Kv1) channels are separated from nodal Nav channels by septate-like paranodal junctions (Peles and Salzer 2000; Rasband and Trimmer, 2001b; Girault and Peles, 2002). Of the seven Nav channel isoforms expressed in nervous tissue (Goldin et al., 2000), Nav1.6 is the predominant one at mature nodes in both the PNS and CNS (Caldwell et al., 2000; Boiko et al., 2001) following a transition from Nav1.2 (Boiko et al., 2001; Kaplan et al., 2001; Jenkins and Bennett, 2002; Rios et al., 2003). The channel clustering (Vabnick et al., 1997; Rasband et al., 1999a) and the transition from Nav1.2 to Nav1.6 (Boiko et al., 2001; Rios et al., 2003) is dependent on interaction of the axon with myelinating cells (Kaplan et al., 1997; Eshed et al., 2005).
Remyelinated axons display inappropriately short internodal lengths (Gledhill and McDonald, 1977; Weiner et al., 1980; Blakemore and Murray, 1981; Hildebrand et al., 1985), indicating that new nodes are formed. Despite their location at formerly internodal sites, remyelinated PNS axons have been shown to display high densities of Nav channels at nodes (Novakovic et al., 1996, 1998) and Kv1 aggregations within juxtaparanodal domains (Rasband et al., 1998). The expression and organization of specific isoforms of Nav and Kv1 channels in remyelinated CNS axons have not been examined.
We report here that transplanted GFP-OECs form myelin and establish ultrastructurally intact nodes of Ranvier, which use Nav1.6 as the predominant Nav channel with Kv1.2 aggregated outside of the node. The segregation of Nav and Kv1 channels into distinct axon membrane domains persists for at least 8 weeks after GFP-OEC transplantation. These observations, coupled with enhanced conduction velocity of the remyelinated axons, indicate that a relatively mature pattern of ion channel organization is recapitulated within spinal cord axons remyelinated by transplanted OECs.
Materials and Methods
Demyelinating lesion and OEC transplantation.
Experiments were performed in accordance with National Institutes of Health guidelines for the care and use of laboratory animals, and the Veterans Affairs Connecticut Healthcare System Institutional Animal Care and Use Committee approved all animal protocols. Experiments were performed on 40 adult female Sprague Dawley rats (150–175 g). A focal demyelinated lesion was created in the dorsal column of the rat spinal cord with X-irradiation and ethidium bromide injection (X-EB) as described previously (Akiyama et al., 2004). Briefly, rats were deeply anesthetized with ketamine (75 mg/kg) and xylazine (10 mg/kg), and a 40 Gy surface dose of X-irradiation was delivered through a 2 × 4 cm opening in a lead shield (4 mm thick) to the spinal cord caudal to T8 using a Siemens (Erlangen, Germany) Stabilipan radiotherapy machine (250 kV, 15 mA, 0.5 mm Cu; 1 mm Al filters; source skin distance, 28 cm; dose rate, 220.9 cGy/min). Three days after irradiation, rats were anesthetized, a laminectomy was performed at T9, and injections of 0.5 μl (0.3 mg/ml EB in saline) were made at depths of 0.7 and 0.5 mm at three sites 2 mm apart using a drawn-glass microelectrode. Three days after EB injection, boluses of 0.5 μl of OEC suspension (3.0 × 10⁴ cells/μl) were injected at depths of 0.7 and 0.5 mm into the center of the X-EB-induced lesion. Transplanted spinal cords were processed for ultrastructural, immunocytochemical, and/or electrophysiological examination 1, 2, 3, and 8 weeks later.
The number of animals analyzed for each condition is as follows: conventional EM, n = 3 (1 week), n = 3 (2 weeks), n = 4 (3 weeks); immuno-EM, n = 2 (3 weeks); immunohistochemistry for GFAP, protein zero (P0), neurofilament (NF): n = 4 (3 weeks); nodal immunohistochemistry, n = 4 (3 weeks), n = 2 (8 weeks), n = 3 (control, i.e., unoperated); electrophysiology, n = 5 (OEC transplanted), n = 5 (demyelinated), n = 5 (control).
Isolation and characterization of OECs.
Freshly isolated OECs were obtained as reported previously (Sasaki et al., 2004, 2005). Olfactory bulbs were removed from 4- to 8-week-old transgenic rats expressing GFP [“green rat” CZ-004, SD-Tg (Act-EGFP) CZ-004Osb; SLC, Shizuoka, Japan] and dissected free of meninges. The caudal one-third of the bulb was removed and discarded along with as much white matter as possible to isolate the outer nerve layer. Tissue was minced finely with a pair of scalpel blades (#10) on plastic culture dishes, and nonadherent tissue was washed from culture dishes and incubated for 25 min in collagenase A (0.75 mg/ml; Roche, Indianapolis, IN), collagenase D (0.75 mg/ml; Roche), and papain (12 U/ml; Worthington, Lakewood, NJ) in calcium-free complete saline solution with trace cysteine for 25 min at 37°C on a rotary shaker in a CO2 incubator. The tissue suspension was then centrifuged for 7 min at 300 × g, the supernatant was discarded, and the pellet was resuspended in 2 ml of DMEM (Invitrogen, Carlsbad, CA) with 10% FCS using gentle mechanical trituration, first with a 5 ml culture pipette and then with two fire-polished silicone-coated pasture pipettes with successively reduced diameters. The volume of media was immediately increased to 20 ml, and undissociated pieces of tissue were allowed to settle for 2 min before transferring the cell suspension to another culture tube and centrifuging as before. Cells were washed twice, resuspended, and preplated for 1 h in a culture flask at 37°C in a CO2 incubator. Nonadherent cells were gently washed off with DMEM, and the cells were centrifuged and resuspended three times in DMEM before counting and concentrating cells to 3.0 × 10⁴ cells/μl just before transplantation. P75- and S100-positive cells were counted in short-term cultures made from cell suspensions used for transplantation to assess purity of the cells. Over 95% of the cells were positive for both.
Ultrastructural analysis.
One (n = 3), two (n = 3), and three (n = 4) weeks after transplantation, rats were deeply anesthetized with sodium pentobarbital (60 mg/kg, i.p.) and perfused with 2% paraformaldehyde plus 2% glutaraldehyde in 0.14 m Sorensen’s phosphate buffer, pH 7.3. Spinal cords were excised, stored overnight in fixative, cut into 2 mm segments, notched to indicate orientation, postfixed with 1% osmium (Polysciences, Warrington, PA) for 4 h, dehydrated, and embedded in Epox-812 (Ernest F. Fullam, Latham, NY) using standard plastic embedding protocols. Semithin sections (1 μm) were collected every 0.25 mm along the length of the cord and counterstained with methylene blue and azure II (0.5% each in 0.5% borax).
Quantitative assessment of myelin periodicity.
Ultrathin sections (70 nm) were counterstained with uranyl acetate and lead citrate and examined with a Philips 300 electron microscope operated at 80 kV. One layer of myelin or lamella was operationally defined as two electron dense bands separated by an electron lucent band. To determine the periodicity of the myelin, the distance between the centers of the innermost and outermost of a series of at least six electron dense bands was measured from scanned EM negatives (magnification, ≥10,000×) using Novaprime Bioquant (Nashville, TN) software, and the periodicity was calculated by dividing this distance by the numbers of electron dense bands minus one. Two intact control spinal cords and one sciatic nerve were also processed in the same manner to assess the number of lamellae and periodicity of normal central and peripheral myelin processed in the same manner. Data were expressed as mean ± SEM. One-way ANOVA was conducted, followed by a Dunnett’s test to identify specific pairwise differences between the means. Comparison analyses were conducted using SPSS version 10.1.3 (SPSS, Chicago, IL).
Immunoelectron microscopy.
Animals were deeply anesthetized (50 mg/kg sodium pentobarbital, i.p.) and perfused transcardially with PBS followed by 4% paraformaldehyde/0.02% glutaraldehyde in PBS. Spinal cords were excised, postfixed overnight in 4% paraformaldehyde, and embedded in 3% agar for vibratome sectioning. Free-floating sections (150 μm thick) were incubated in 2% normal goat serum for 30 min and then in rabbit anti-GFP antibody (1:2000; Chemicon) overnight at 4°C. The sections were incubated overnight with an anti-rabbit biotinylated secondary antibody (Sigma, St. Louis, MO) and then incubated for 1 h using a Vectastain Elite ABC kit (Vector Laboratories, Burlingame, CA) similar to that described by Sasaki et al. (2004). The sections were postfixed with 1% osmium tetroxide for 4 h, dehydrated in graded ethanol, and embedded in Epox-812 (Ernest Fullam, Latham, NY). Ultrathin sections were cut as described above but were not counterstained.
Immunocytochemistry.
Spinal cords from control and 3 week and 8 week GFP-OEC-transplanted rats were processed for immunocytochemistry as described previously (Black et al., 1999, 2004). Briefly, rats were deeply anesthetized with ketamine/xylazine and perfused transcardially, first with PBS and then with ice-cold 4% paraformaldehyde in 0.14 m Sorensen’s phosphate buffer, pH 7.4. Spinal cords were excised and placed in fresh fixative to achieve a total fixation time of 25 min. Tissue was rinsed several times with PBS and cryoprotected in 30% sucrose in PBS overnight at 4°C. Ten micrometer longitudinal cryosections of the dorsal columns were cut and mounted on Fisher Superfrost Plus glass slides, and the sections were processed for double immunofluorescent detection of Nav1.2, Nav1.6, or Kv1.2 and Caspr or single immunolabeling for NF or P0. Primary antibodies used were as follows: polyclonal Nav1.2 (1:100; Alomone Labs, Jerusalem, Israel), polyclonal Nav1.6 (1:100; Alomone Labs), polyclonal Kv1.2 (1:100; Alomone Labs), monoclonal NF (1:1000; Sigma), monoclonal P0 (1:150; obtained from Dr. Juan Archelos, University of Graz, Graz, Austria), monoclonal GFAP (1:1000; Sigma), and monoclonal Caspr (1:300) (Rasband et al., 1999a) (a generous gift from Dr. M. Rasband, University of Connecticut, Storrs, CT). Secondary antibodies used were as follows: goat anti-rabbit IgG-Cy3 (1:2000; Amersham Biosciences, Piscataway, NJ) and goat anti-mouse IgG-Alexa Fluor 633 or Alexa Fluor 546 (1:1000; Invitrogen, Eugene, OR). The sections were examined by confocal microscopy (Nikon Eclipse E600 microscope; Simple PCI; Compix Imaging Systems, Cranberry Township, PA), and images were arranged in Adobe Photoshop (Adobe Systems, San Jose, CA).
Tissue analysis.
For analysis of control and GFP-OEC-transplanted spinal cords, multiple images of longitudinal sections of the dorsal columns were acquired with a Nikon (Tokyo, Japan) Eclipse E600 confocal microscope. Images were obtained from control (n = 3), 3 week (n = 4), and 8 week (n = 2) GFP-OECs transplanted rats, with the number of nodes analyzed for each condition as follows: control, Nav1.2, 62; Nav1.6, 63; Kv1.2, 79; 3 week, Nav1.2, 99; Nav1.6, 119; Kv1.2, 47; 8 week, Nav1.2, 86; Nav1.6, 92; Kv1.2, 43. Quantification of nodes with Nav1.2, Nav1.6, and Kv1.2 immunostaining is expressed as mean percentage ± SD.
Electrophysiological recording in vivo.
Three weeks after surgery, animals from normal (n = 5), demyelinated (n = 5), and OEC transplanted (n = 5) groups underwent compound action potential (CAP) recording in vivo (Akiyama et al., 2004). Rats were initially anesthetized with ketamine/xylazine (90/4 mg/kg, i.p.), heart rate (∼300 beats/min) was carefully monitored (NPB-40; Nellcor, Pleasanton, CA), and rectal temperature was monitored at 36 ± 1°C (43TD; Yellow Springs Instruments, Yellow Springs, OH), regulated by a thermal blanket set to 37°C. Rats were fixed in a stereotaxic apparatus (Kopf Instruments, Tujunga, CA). A midline incision was made through the skin, and the granulation tissue was carefully removed to expose the spinal cord regions. The recordings were obtained using a flexible, linear array electrode custom designed in our laboratory (patent pending) and fabricated by Allflex (Northfield, MN). The circuitry consisted of six gold spots (each ∼300 μm in diameter and placed at 2 mm intervals) plated on copper lines that were printed on thin plastic membranes (see Fig. 8A). The ribbon electrode, mounted on a multichannel connector socket, was gently lowered onto the exposed dorsal surface of the rat spinal cord using a micromanipulator. Each electrical impulse was generated by a stimulus isolation unit (Isolated Pulse Stimulator model 2100; A-M Systems, Olympic Peninsula, WA) and delivered via the first of the six gold plated spots on the ribbon electrode. The second and subsequent gold spots along the linear array constituted recording sites for CAPs. We used the first to fourth gold plated spots in this study. Each stimulus was a 20 μs duration DC constant current in the range of 2–3 mA. The intensity of the pulse was gradually increased until the maximum CAP amplitude could be obtained. CAPs were recorded with a preamplifier (Axoprobe-1; Molecular Dynamics, Foster City, CA) and collected (CED 1401+; Cambridge Electronic Design, Cambridge, UK), and a computer was used for data analysis (Spike2 software; Cambridge Electronic Design). All data were expressed as mean ± SD. One-way ANOVA was conducted followed by a Dunnett’s test to identify specific pairwise differences between the means. Comparison analyses were conducted using SPSS version 10.1.3.
Figure 8.
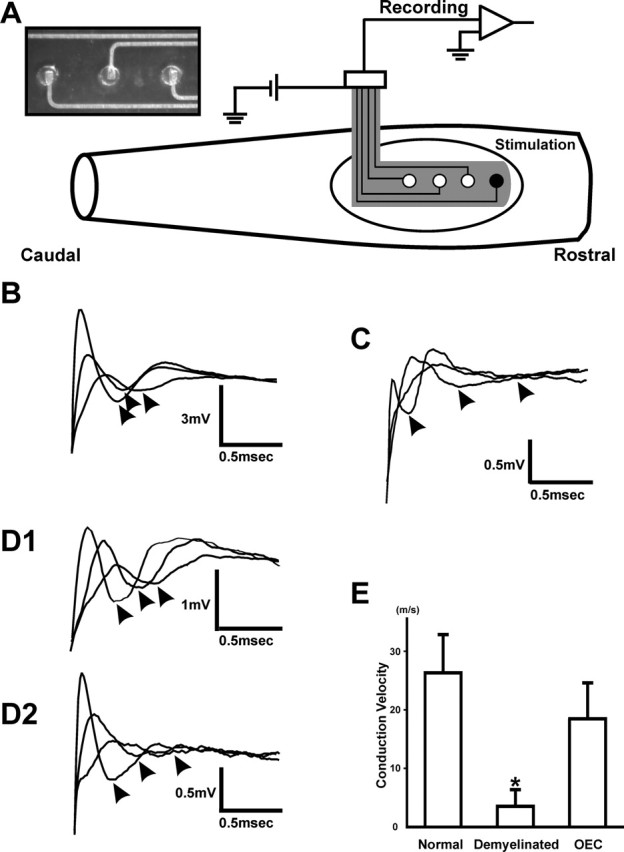
A, Schematic of spinal cord recording configuration using a flexible, linear array electrode with stimulating (black dot) and recording (white dots) electrodes in vivo 3 weeks after surgery. Oval region indicates the area of the X-EB lesion. The position of the recording gold spots in the electrode is indicated by white dots at 2.0 mm increments along the dorsal columns of the spinal cord. Compound action potentials are shown for control (B), demyelinated (C), and two OEC transplanted (D1, D2) dorsal funiculus. E, Histograms of conduction velocity (error bars indicate SD) for normal (n = 5), demyelinated (n = 5), and OEC transplanted (n = 5) dorsal column axons (*p < 0.005).
Results
Transplanted GFP-OECs integrate into demyelinated spinal cord and formmyelin
Olfactory ensheathing cells from donor GFP rats (GFP-OEC) exhibited a robust distribution within the X-EB lesioned spinal cord dorsal columns 3 weeks after transplantation. The GFP-OECs were easily distinguished at this time point by their green fluorescence and were distributed longitudinally along the dorsal columns for ∼8 mm (Fig. 1A). GFP-OECs were mostly confined to the lesion zone of the dorsal funiculus. GFAP immunostaining (n = 4) indicated a near absence of astrocytes within the lesion site, but intense GFAP staining was observed at the outer boundary of the lesion zone (Fig. 1C,D,H). Semithin azure II-methylene blue-stained plastic sections of the transplantation site indicated abundant remyelination of the demyelinated axons (Fig. 1E). In contrast to GFAP immunolabeling, immunostaining for P0, a specific marker of peripheral myelin (Greenfield et al., 1973), was primarily localized within the lesion and transplantation site (Fig. 1F,G,I). Ringlet-like P0 immunostaining was associated with GFP-OECs and was surrounded by GFP+-OEC cytoplasm, indicating that peripheral-type myelin was formed by the transplanted cells within the dorsal column lesion (Fig. 1I). Analysis of P0 immunopositive profiles within a transverse section through the GFP-OEC transplanted region revealed that 37/37 P0-positive ring-like profiles were associated with surrounding GFP-OECs.
Figure 1.
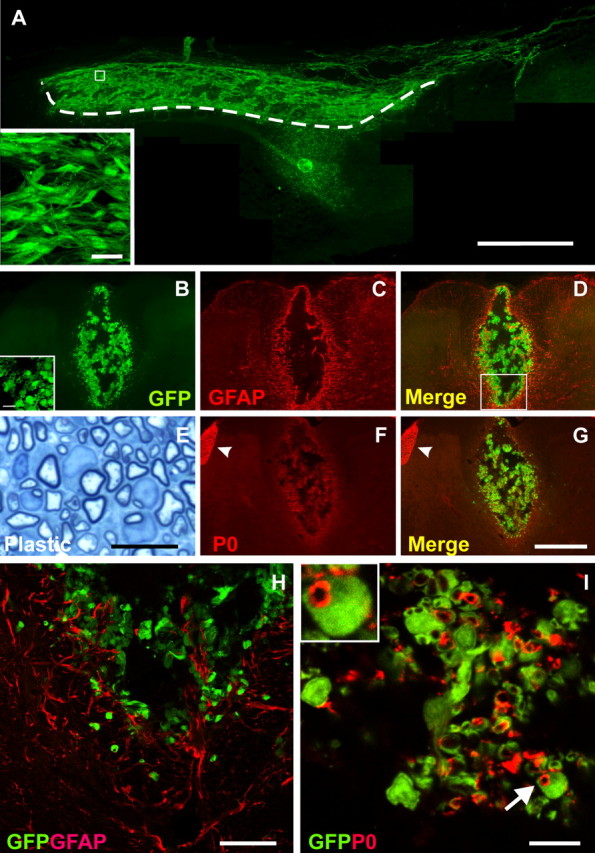
A, Sagittal frozen sections through the lesion site demonstrate the distribution of transplanted GFP-OEC. Transplanted cells are primarily confined to the lesion site. Some cells migrated into the deep white matter. The dashed line demarcates lesion edge. B, Coronal frozen sections in the lesion show the presence of GFP-OEC within a lesion site. Transplanted cells survived primarily in the dorsal funiculus. There was little GFAP staining within the lesion zone. C, D, H, GFAP-positive cells were present at the peripheral margin of the lesion. These results indicate that few astrocytes are present in the transplant region, and that there is a preponderance of GFP-OEC in the lesion zone. E, High-magnification micrographs of semithin plastic sections stained with methylene blue/Azure II through the OEC transplanted lesion demonstrated that the transplanted dorsal funiculus was extensively myelinated. F, P0-immunostaining of the frozen coronal section reveals that most axons remyelinated by transplanted OECs are surrounded by a peripheral type of myelin. F, G, Peripheral roots are strongly immunostained by P0 (arrowheads). I, Red-P0 rings are associated with green cellular elements, indicating that transplanted OECs remyelinate the demyelinated axons. I, Inset, Expansion of a cell indicated by an arrow. Scale bars: A, 1 mm; (in G) B–D, F, G, 400 μm; E, 10 μm; H, 30 μm; I, 10 μm; A, inset, 20 μm; B, inset, 10 μm.
Nodes of Ranvier are formed by 3 weeks aftertransplantation
Electron microscopic analysis of spinal cords was performed at 1, 2, and 3 weeks after GFP-OEC transplantation (Figs. 2, 3). At 1 week, demyelinated axons were apparent, of which some were associated with the transplanted OECs (Fig. 2A1–A2). By 2 weeks, the axon-OEC association became more intimate, and thin myelin was observed on some axons (Fig. 2B1–B3). Distinct nodes of Ranvier were observed at 3 weeks after transplantation (Fig. 3). Large cytoplasmic and nuclear compartments were present in cells associated with the myelin profiles (Fig. 3A,C). Longitudinal sections of the dorsal columns revealed well formed nodal and paranodal regions; paranodal loops from adjacent myelin-forming cells were readily recognized flanking nodes (Fig. 3B1,B2). To more fully establish that the OECs derived from GFP rats were indeed responsible for the remyelination, immunoelectron microscopy for GFP was performed. Intense reaction product was observed within the cytoplasm and nuclei of cell profiles surrounding myelinated axons (Fig. 3C).
Figure 2.
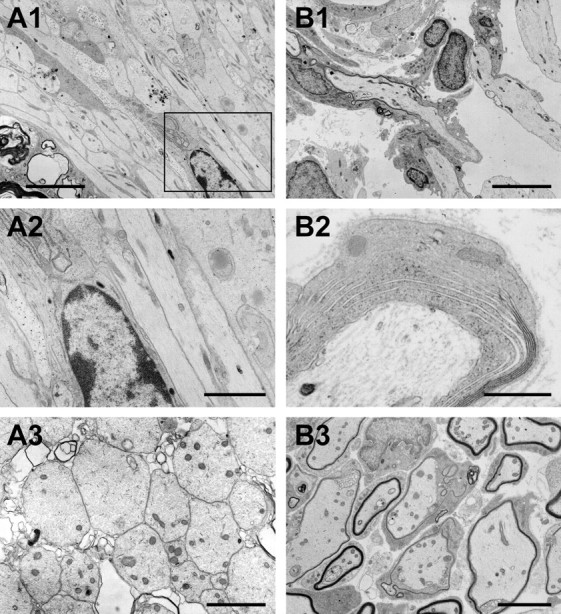
A, B, Ultrastructural characteristics of dorsal funiculus axons at 1 (A) and 2 (B) weeks after OEC transplantation. A1, At 1 week, transplanted OECs align with demyelinated axons but do not yet wrap the axons. A2, Enlargement of box in A1 showing nucleus and cytoplasm of transplanted cell interspersed with demyelinated axons. A3, Coronal section showing a field of demyelinated axons at 1 week after transplantation. B1, At 2 weeks after transplantation, OECs begin to form thin myelin on the host axons. B2, Axon wrapped by donor OEC in the process of compaction. B3, Lower power showing field of axons in various stages of myelination. Scale bars: A1, B1, 5 μm; A2, B2, 2 μm; A3, 0.5 μm; B3, 3 μm.
Figure 3.

Nodal structure of remyelinated axons (A, B) and immuno-EM for GFP (C, D) at 3 weeks after transplantation. A, Sagittal section showing a field of myelinated axons interspersed among donor OECs. Note the node structure in the center of the field. B1, High-power electron micrograph showing node and paranodal loops. B2 is an enlargement of the boxed area in B1. C, D, Immuno-EM for GFP shows numerous GFP+ cells remyelinating the demyelinated axons. Counterstaining for these sections was minimal, and dark staining shows electron dense immunoperoxidase reaction product. Note the electron dense reaction product in the cytoplasm and nuclei of most cells forming myelin. D1, One cell associated with myelin in this field displays distinct reaction product, whereas an adjacent cell does not have electron dense reaction product in its cytoplasm. D2 is an enlargement of the box in D1. Note the dense reaction product in the cytoplasm of the myelin-forming cell on the right and the basement membrane surrounding the cell. Scale bars: A, 5 μm; B1, 1 μm; B2, 0.5 μm; C, 5 μm; D1, 2 μm; D2, 0.4 μm.
To establish a first approximation of the relative contribution of donor cell to host cell remyelination, quantitative analysis was performed on GFP immunoelectron microscopic experiments of two transplanted animals. A total of 136 axons were counted in the lesions, and of these 120 were GFP+ cells. Of the GFP+ cells, four (3.3%) showed no direct contact with axons. The myelin-forming status of five GFP+ cells (4.2%) could not be determined because of poor membrane preservation. Of the remaining 111 GFP+ cells, 90 cells (81%; 90 of 111) showed a distinct myelin structure. The remaining 21 GFP+ cells (19%; 21 of 111) appeared to be in varying stages of loose wrapping or ensheathing the axons but did not show distinct compact myelin. Within this same region, 16 myelinated axon profiles were detected, which were associated with myelin-forming cells that did not contain DAB reaction product. An example of a non-GFP myelinated axon adjacent to a GFP+ myelinating cell is shown in Figure 3, D1 and D2. Note the presence of a basement membrane surrounding both myelinated axons.
To examine on an ultrastructural level the capacity of GFP-OECs to form nodes and compact myelin, nodal gap length, myelin periodicity, and the number of myelin lamellae of re-myelinated axons were measured at 1, 2, and 3 weeks after transplantation (Table 1). Compact myelin was not observed at 1 week after transplantation, but by 2 and 3 weeks, increasing numbers of thinly myelinated axons were observed. Between 2 and 3 weeks after transplantation, the mean number of lamellae of GFP-OEC myelinated axons increased from 8.3 ± 0.5 to 14.50 ± 0.55. In comparison, the mean number of lamellae in control dorsal funiculus axons was 31.95 ± 3.83, whereas that of control sciatic nerve axons was 36.94 ± 3.82. The nodal gap length of remyelinated axons (∼1 μm) was similar to that of control dorsal funiculus and sciatic nerve axons. At 3 weeks after transplantation, the periodicity of GFP-OEC myelin (13.05 nm) was greater than that of oligodendrocyte myelin (10.71 nm) but was similar to the periodicity of Schwann cell myelin (13.76 nm) in sciatic nerve (Table 1).
Table 1.
Nodal gap length, periodicity, and lamellae for OEC transplanted spinal cord (1, 2, and 3 weeks), Schwann cell transplant, intact sciatic nerve, and intact dorsal funiculus
| Nodal gap length (nm) | Periodicity (nm) | Lamellae (number) | |
|---|---|---|---|
| OEC at 1 week | N/A | N/A | N/A |
| OEC at 2 weeks | N/A | 13.8 ± 0.2 | 8.3 ± 0.5 |
| (n = 67) | (n = 67; p < 0.001) | ||
| OEC at 3 weeks | 1201.91 ± 63.41 | 13.05 ± 0.14 | 14.50 ± 0.55 |
| (n = 10; NS) | (n = 25) | (n = 61; p < 0.001) | |
| Sciatic nerve | 1125.83 ± 60.56 | 13.76 ± 0.26 | 36.94 ± 3.82 |
| (n = 7) | (n = 19) | (n = 17) | |
| Intact DF | 1050.85 ± 52.20 | 10.71 ± 0.16 | 31.95 ± 2.32 |
| (n = 5) | (n = 25; p < 0.001) | (n = 41) |
Errors are given as mean ± SEM. NS, Not significant; N/A, not applicable; DF, dorsal funiculus.
Nav1.6 is predominant at new nodes of remyelinated axons
Within the GFP-OEC transplanted regions, nodes were identified by flanking paranodal Caspr immunofluorescence (Menegoz et al., 1997; Rios et al., 2000), which was abundant in these areas (Fig. 4). At 3 weeks after transplantation, nodes delimited by Caspr reactivity associated with adjacent GFP-OECs could be identified by GFP fluorescence in the region of the terminal paranodal loops, as well as within the outer layer of the GFP-OEC sheath (Fig. 4C, insets). Examination at higher magnification of the merged confocal image in Figure 4C indicated that 80% (24 of 30) of the Caspr-flanked nodal regions were associated with GFP-OECs. Caspr pairs were also observed outside the lesion zone in areas myelinated by oligodendrocytes (Fig. 4D, below the dashed line). P0 was observed only in the lesion and transplant zone (Fig. 4E). The inset in Figure 4B shows a longitudinal section through an axon where P0 staining can be seen inside the GFP-OEC near a Caspr-delineated node. Immunostaining for P0 and NF in coronal section reveals a central NF+ axonal core surrounded by P0-identified myelin, which is wrapped by cytoplasm of a GFP-OEC (Fig. 4F, inset). Collectively, these data demonstrate the association of the transplanted OECs with remyelination of host axons.
Figure 4.

GFP-OEC nodes in remyelinated dorsal columns. A, At 3 weeks after transplantation, GFP-OECs are abundant within the demyelinated dorsal columns. B, Numerous Caspr-delimited nodes are present in the GFP-OEC transplanted region. The inset shows P0 immunostaining surrounded by green cytoplasm of an OEC near a Caspr-defined node. C, Merged image demonstrates the coincidence of GFP-OECs and Caspr immunostaining in the transplanted region. The insets are higher magnification of individual nodal regions. D, Dashed line demarcates edge of lesion and transplantation zone. Note Caspr pairs in normal white matter (below the dashed line). The inset shows Caspr pair in normal white matter at higher magnification. E, P0 and neurofilament (NF) staining at lesion boundary (dashed line) and transplant zone. F, Higher magnification showing neurofilament-defined axon cores surrounded by P0 myelin rings enwrapped by GFP-OECs. A-D are sagittal sections, and E and F are coronal. Scale bars: A, B, 50 μm; C, 25 μm; D, E, 30 μm; F, 10 μm; B, C, insets, 5 μm; F, inset, 2.5 μm.
Previous reports (Caldwell et al., 2000; Boiko et al., 2001) have identified Nav1.6 as the predominant isoform at mature nodes of Ranvier in the CNS, after a transition from Nav1.2 expression at immature nodes (Boiko et al., 2001; Kaplan et al., 2001; Jenkins and Bennett, 2002; Rios et al., 2003). In our examination of myelinated axons within the dorsal columns of control adult spinal cord, we observed Nav1.6 staining at most nodes, whereas detectable Nav1.2 immunostaining was not apparent at nodes (Figs. 5, 6). In dorsal columns 3 weeks after transplantation, virtually all nodes bounded by GFP-OEC myelin sheaths exhibited Nav1.6 staining (Fig. 5E–H); similar to control spinal cord axons, Nav1.2 immunolabeling was not observed at any nodes (Fig. 5A–D). The Nav1.6 labeling was localized to the nodal domain and was not observed in paranodal or juxtaparanodal regions or beneath the myelin sheath in remyelinated axons, suggesting that the transplanted GFP-OECs are competent to contribute to the specific clustering of Nav channels at nodes.
Figure 5.
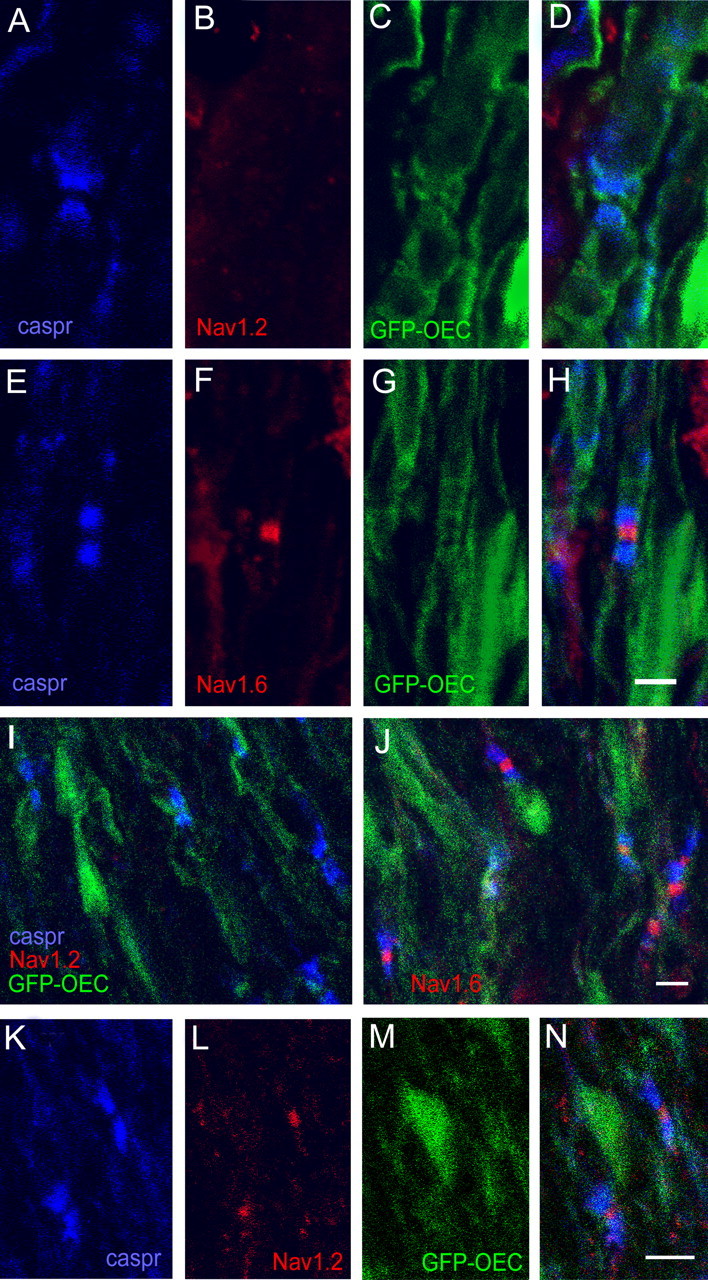
Nav1.2 and Nav1.6 at GFP-OEC nodes in remyelinated dorsal columns. A–H, At 3 weeks after transplantation, Caspr-delimited nodes (A) formed by GFP-OECs (C) do not exhibit Nav1.2 immunostaining (B). E–H, In contrast, Nav1.6 clustering (F) is displayed at most Caspr-delimited (E) nodes formed by GFP-OECs at 3 weeks (G). Merged images of A–C and E–G are shown in D and H, respectively. I–N, At 8 weeks after transplantation, most Caspr-defined nodes formed by GFP-OECs do not exhibit Nav1.2 immunolabeling (I), whereas Nav1.6 immunostaining is predominant at Caspr-delimited nodes (J). K–N, A small minority (∼5%) of Caspr-defined nodal regions (K) formed by GFP-OECs (M) display Nav1.2 clustering (L). The merged image from K–M is shown in N. Scale bars, 10 μm.
Figure 6.

Quantification of Nav1.2 and Nav1.6 clustering at control and GFP-OEC nodes. Nav1.6 is the predominant sodium channel clustered at control nodes and also at nodes formed by GFP-OECs at 3 and 8 weeks after transplantation. Nav1.2 was not detectable at control and GFP-OEC-formed nodes 3 weeks after transplantation, but Nav1.2 was observed in a small number of GFP-OEC nodes at 8 weeks after transplantation. Error bars represent mean ± SD.
To determine whether the focal accumulation of Nav1.6 at nodes made by transplanted GFP-OECs was stable after extended remyelination, we examined X-EB lesioned dorsal columns 8 weeks after transplantation of GFP-OECs. The GFP fluorescence of the transplanted cells was somewhat attenuated compared with that observed at 3 weeks but was clearly distinguishable from surrounding areas. In these regions, Caspr-delimited nodes formed by GFP-OECs continued to be numerous, and, as at 3 weeks, most nodes exhibited Nav1.6 immunofluorescence (Fig. 5J). Nav1.2 was generally not observed at remyelinated nodes (Fig. 5I); however, a small percentage (∼5%) of the GFP-OEC nodes exhibited distinct Nav1.2 clustering (Figs. 5K–N, 6). Because both Nav channel antibodies were rabbit polyclonal, it was not possible to determine whether Nav1.6 was also accumulated at these Nav1.2-positive nodes.
Quantification of the percentage of Caspr-demarcated GFP-OEC nodes with Nav1.2 and Nav1.6 staining at 3 weeks and 8 weeks after transplantation is shown in Figure 6. At both posttransplantation times, Nav1.6 is the predominant Nav channel isoform at remyelinated nodes, similar to nodes in control spinal cord.
Kv1.2 accumulates in the juxtaparanodal region of remyelinated axons
As an additional determinant of the ability of axons myelinated by GFP-OECs to support the asymmetric organization of ion channels within remyelinated nodal regions, we examined the distribution of Kv1.2 in the juxtaparanodal region. Kv1.2, as well as Kv1.1, form heteromultimers with Kv1.4 and Kvβ2 (Wang et al., 1993; Rasband et al., 1998) and have been shown previously to be aggregated in juxtaparanodal regions of most spinal cord axons (Rasband et al., 1999b; Rasband and Trimmer, 2001a,b) (Fig. 7A–D). At both 3 weeks (Fig. 7E–H) and 8 weeks (Fig. 7I–L) after GFP-OEC transplantation, Kv1.2 is aggregated within juxtaparanodal regions of the remyelinated axons, with some nodes exhibiting incursion of Kv1.2 channels into adjacent paranodal regions. Kv1.2 was not observed within nodal areas in these axons. Quantification of the percentage of Caspr demarcated nodes with and without juxtaparanodal Kv1.2 labeling was performed for control and 3 week and 8 week posttransplantation. Although virtually all control nodes displayed juxtaparanodal Kv1.2 staining, only ∼60–70% of GFP-OEC remyelinated nodes exhibited detectable Kv1.2 staining (Fig. 7M).
Figure 7.
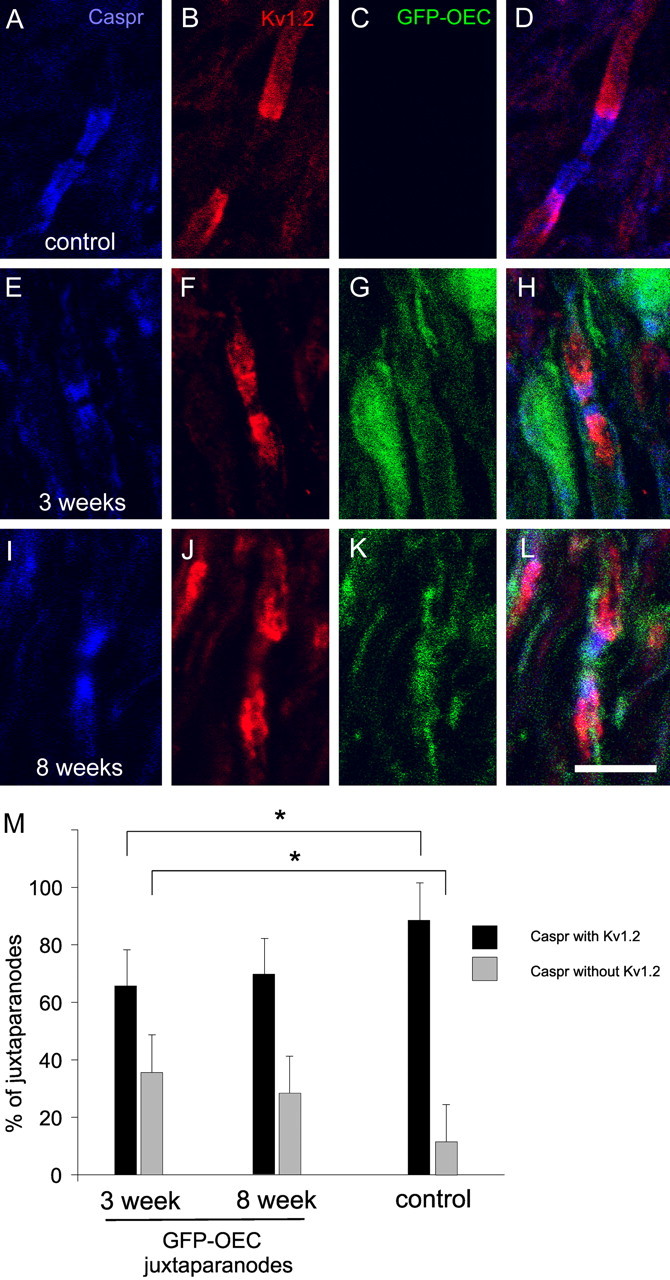
Juxtaparanodal Kv1.2 immunolabeling in control and 3 and 8 weeks after GFP-OEC transplantation dorsal columns. A–D, Nodes within control dorsal columns exhibit Caspr labeling (A) within paranodal regions that are flanked by Kv1.2 immunostaining (B). At 3 weeks (E–H) and 8 weeks (I–L) after transplantation, paranodes display Caspr staining (E, I) that is flanked by Kv1.2 aggregations within juxtaparanodal regions. Merged images of A–C, E–G, and I–K are shown in D, H, and L, respectively. Scale bar, 10 μm. M, Quantification of juxtaparanodal Kv1.2 expression in control and 3 weeks and 8 weeks after GFP-OEC transplantation. Compared with control nodes, at 3 weeks after transplantation, there are significantly (*p < 0.05) fewer Caspr-defined nodes with Kv1.2 immunolabeling and significantly (*p < 0.05) more Caspr-delimited nodes without Kv1.2 immunostaining. In contrast, the percentages of Caspr-defined nodes with or without juxtaparanodal Kv1.2 staining are not significantly different in control and 8 weeks after transplantation dorsal columns. Student’s t test. Error bars represent mean ± SD.
Conduction velocity is restored in GFP-OEC remyelinated dorsal columns
In vivo electrophysiological studies were performed to examine the conduction properties of remyelinated axons 3 weeks after transplantation with GFP-OECs. CAPs were recorded with a flexible, linear array electrode positioned on the surface of the dorsal columns (Fig. 8A) (see Materials and Methods). Recordings were obtained at sequential longitudinal distances along control (Fig. 8B), demyelinated (Fig. 8C), and GFP-OEC transplanted spinal cords (Fig. 8D1,D2). Axons within demyelinated dorsal columns displayed substantially reduced conduction velocities (2.79 ± 1.66 m/s; n ; 5) compared with control dorsal columns (23.67 ± 5.82 m/s; n ; 5). Transplantation of GFP-OECs significantly increased the conduction velocity of axons within the lesioned dorsal columns (18.46 ± 6.144 m/s; n ; 5) to near control values (Fig. 8E), consistent with the acquisition of myelin sheaths and of functional nodes.
Discussion
A number of cell types, including oligodendrocyte progenitors (Duncan et al., 1988; Keirstead et al., 1999, 2005; Cao et al., 2005), Schwann cells (Blakemore and Crang, 1985; Baron-Van Evercooren et al., 1992; Honmou et al., 1996), OECs (Franklin et al., 1996; Imaizumi et al., 1998; Barnett et al., 2000; Kato et al., 2000; Sasaki et al., 2004), and neural stem cells (Brustle et al., 1999; Akiyama et al., 2001), have been used to remyelinate central axons. However, an important prerequisite for recovery of action potential conduction in remyelinated axons is the appropriate organization of ion channels at nodes of Ranvier. It is well established that voltage-gated Nav channels cluster at high densities at nodes, in contrast to the paucity of channels beneath the myelin sheath (Waxman and Ritchie, 1985). More recently, it was demonstrated that Nav1.6 is the predominant Na channel isoform at mature nodes of Ranvier (Caldwell et al., 2000), after a transition from Nav1.2 expression at immature nodes (Boiko et al., 2001; Kaplan et al., 2001; Jenkins and Bennett, 2002; Rios et al., 2003). In contrast, potassium currents are recorded within paranodal/juxtaparanodal regions (Chiu and Ritchie, 1980) but not generally at nodes. Consistent with these electrophysiological observations, Shaker-type Kv1 channels are aggregated within juxtaparanodal regions (Wang et al., 1993; Rasband et al., 1998).
Our results demonstrate that, after remyelination by OECs derived from GFP-expressing rats, nodes of Ranvier achieve a Nav and Kv1 channel organization similar to that exhibited at mature control central nodes, with clustering of Nav1.6 at remyelinated nodes and Kv1.2 within juxtaparanodal regions. Moreover, GFP-OEC remyelinated spinal cord axons exhibit conduction velocities approaching normal levels at 3 weeks after transplantation. These observations demonstrate that exogenous myelin-forming cells are able to contribute to the establishment and maintenance of mature ion channel distributions at nodal regions and to support functional recovery of demyelinated axons. Gledhill and McDonald (1977)demonstrated that remyelinated dorsal column axons have shorter internodes and more nodes of Ranvier, thus indicating new nodal formation.
The X-EB lesion used in this study is depleted not only of oligodendrocytes but also of astrocytes, thereby producing an aglial zone of 6–8 mm in length (Akiyama et al., 2004). In our studies, the transplanted GFP-OECs survived and integrated over several millimeters along the demyelinated dorsal columns. The myelin formed by the GFP-OECs was P0 positive, an indication that peripheral-type and not central myelin had been formed (Greenfield et al., 1973; Eichberg, 2002), and ultrastructural analysis was consistent with the classic pattern of peripheral myelin formation, with the GFP-OECs having large cytoplasmic and nuclear domains and a basement membrane surrounding the myelin (Berthold, 1978). The association of myelin with OECs exhibiting GFP immunoreactivity at both the light and ultrastructural levels demonstrates that the OECs obtained from GFP rats were responsible for most of the remyelination. The small number of myelin-forming cells that did not contain DAB reaction product for immuno-EM may result from these cells being refractory to immunostaining in the thick sections, downregulation of GFP expression, or endogenous repair.
The OECs used for the present study were prepared acutely from the outer nerve fiber layer of the adult olfactory bulb (Sasaki et al., 2004). This area is rich in OECs in vivo (Devon and Doucette, 1992; Au et al., 2002). The purity of our cell suspension (>95%), as assessed by p75/S100 immunolabeling, was similar to that in other studies in which immunopanning techniques were used (Takami et al., 2002; Lakatos et al., 2003) or in which OECs were prepared from embryonic tissue (Devon and Doucette, 1992). Although it is possible that a limited number of Schwann cells could be present in our cell suspensions (Plant et al., 2002; Takami et al., 2002; Boyd et al., 2004), it is expected that only a very minor contamination of Schwann cells, possibly associated with blood vessel innervation (Takami et al., 2002) or meningeal cells (Lakatos et al., 2003), would be present, and this level of Schwann cell contamination could not account for the extensive remyelination achieved by 3 weeks after transplantation (Akiyama et al., 2004).
During maturation of nodes of Ranvier within optic nerve (Boiko et al., 2001; Kaplan et al., 2001; Jenkins and Bennett, 2002; Rios et al., 2003) and sciatic nerve (Boiko et al., 2001), immature nodes initially exhibit focal accumulations of Nav1.2. In the optic nerve, the transition from Nav 1.2 to Nav1.6 at nodes occurs over several weeks, whereas in the PNS the transition to Nav1.6 is much more rapid, lasting only 2–3 d (Boiko et al., 2001). In our studies, Nav1.2 aggregation at nodes was not observed at 3 weeks after transplantation. Instead, Nav 1.6 was the predominant (>90%) sodium channel at nodes, similar to that observed at mature control nodes. Although we were unable to distinguish Caspr-delimited nodes at 2 weeks after transplantation (data not shown), ultrastructural analyses did demonstrate the presence of a small number of nodes at this time. It is possible, therefore, that a rapid transition from Nav1.2 to Nav1.6 occurred at these earliest formed nodes, so that there was only a very transient period of Nav1.2 expression that we were unable to detect. Thus, we cannot eliminate the possibility that newly formed nodes in the remyelinating dorsal columns undergo a rapid transition from Nav1.2 to Nav1.6, similar to that occurring in the PNS. In this respect, it is interesting that at 8 weeks after transplantation, a small percentage (<5%) of GFP-OEC remyelinated nodes exhibited Nav1.2 clustering. Ongoing remodeling of myelinated axons has been reported even after myelination is complete and mature myelin and nodes are formed in the PNS (Hildebrand et al., 1985), with nodal formation at formerly internodal membrane. It is possible that a similar process occurs in the GFP-OEC remyelinated dorsal columns, and that Nav1.2 is clustered at the newly formed nodes and replaced rapidly with Nav1.6. It is important to note, however, that even at extended posttransplantation time (8 weeks), Nav1.6 is predominant at nodes, indicating that GFP-OECs are able to establish and maintain central nodes with mature characteristics.
Kv1 channels are heteromultisubunit complexes consisting of four α-subunits and up to four β-subunits (Isacoff et al., 1990; Rhodes et al., 1997) and in the juxtaparanodal region are thought to consist primarily of combinations of Kv1.1, Kv1.2, Kv1.4, and Kvβ2 (Wang et al., 1993; Rasband et al., 1998, 2001a). During development in the CNS, Kv1 channels are targeted to juxtaparanodal domains (Rasband et al., 1999b), in contrast to development within the PNS where Kv1 channels are initially clustered at nodes and then secondarily redistributed to paranodes and then juxtaparanodes (Rasband et al., 1998). In studies using mutant mice, it has been shown that intact axoglial junctions are requisite for specific targeting of Kv1 to juxtaparanodal domains (Dupree et al., 1999; Bhat et al., 2001; Rios et al., 2003). In this respect, it is interesting that in the present study, Kv1.2 was never detected at the remyelinated central nodes formed by transplanted GFP-OECs, which produced peripheral-like myelin sheaths but were only present in the juxtaparanodal region. These observations are consistent with the capacity of transplanted GFP-OECs to participate in the formation of intact axoglial junctions and the targeting of Kv1.2 to juxtaparanodal regions.
Finally, although the electrophysiological role of Kv1 channels in axons is uncertain, the precise localization of Kv1 within juxtaparanodal regions suggests that they may have an important role in axonal function (Rasband, 2004). Application of the Kv1 channel antagonist 4-aminopyridine (4-AP) to intact mature axons has little effect on excitability (Chiu and Ritchie, 1980; Kocsis and Waxman, 1980); in contrast, 4-AP application during development (Kocsis et al., 1983) or after acute disruption of paranodes in mature axons (Chiu and Ritchie, 1980) produces substantial alteration in the excitability of axons, including changes in refractory period, action potential broadening, and spontaneous impulse generation (Targ and Kocsis, 1985, 1986) and decreases outward potassium currents (Chiu and Ritchie, 1980; Bostock et al., 1981). In this respect, it is important to note that somewhat fewer remyelinated axons exhibited juxtaparanodal clustering of Kv1.2 compared with control axons. If the absence of Kv1 channels within juxtaparanodal regions in a subset of remyelinated axons contributes to the generation of spontaneous and/or repetitive impulse activity in these axons, as occurs after 4-AP application in disrupted fibers, this could potentially lead to pain or paresthesia. In this regard, it is interesting that Hofstetter et al. (2005)report that allodynia may limit the usefulness of intraspinal neural stem cell grafts, but grafts with directed differentiation improve outcome.
In summary, our results indicate that, in addition to forming myelin, engrafted GFP-OECs provide an environment that supports the development and maturation of nodes of Ranvier in the CNS. This includes a recapitulation of the clustering of Nav1.6 channels at nodes, which supports the restoration of impulse conduction along central axons.
Footnotes
This work was supported in part by the Medical Research and Rehabilitation Research Services of the Department of Veterans Affairs; National Multiple Sclerosis Society Grants RG1912, RG2135, and R05754; National Institutes of Health Grant NS43432; and the Nancy Davis Foundation. The Center for Neuroscience and Regeneration Research is a collaboration of the Paralyzed Veterans of America and the United Spinal Association with Yale University. We thank Heather Mallozzi and Margaret Borelli for excellent technical assistance. We also thank Dr. Matthew Rasband (University of Connecticut) for the generous gift of Caspr antibody.
References
- Akiyama Y, Honmou O, Kato T, Uede T, Hashi K, Kocsis JD (2001). Transplantation of clonal neural precursor cells derived from adult human brain establishes functional peripheral myelin in the rat spinal cord. Exp Neurol 167:27–39. [DOI] [PubMed] [Google Scholar]
- Akiyama Y, Lankford KL, Radtke C, Greer CA, Kocsis JD (2004). Remyelination of spinal cord axons by olfactory ensheathing cells and Schwann cells derived from a transgenic rat expressing alkaline phosphatase marker gene. Neuron Glia Biol 1:1–9. [DOI] [PMC free article] [PubMed] [Google Scholar]
- Au WW, Treloar HB, Greer CA (2002). Sublaminar organization of the mouse olfactory bulb nerve layer. J Comp Neurol 446:68–80. [DOI] [PubMed] [Google Scholar]
- Barnett SC, Alexander CL, Iwashita Y, Gilson JM, Crowther J, Clark L, Dunn LT, Papanastassiou V, Kennedy PG, Franklin RJ (2000). Identification of a human olfactory ensheathing cell that can effect transplant-mediated remyelination of demyelinated CNS axons. Brain 123:1581–1588. [DOI] [PubMed] [Google Scholar]
- Baron-Van Evercooren A, Blakemore WF (2004). Remyelination through engraftment. In: Myelin biology and disorders (Lazzarini RA, ed.) , pp. 143–172. San Diego: Elsevier.
- Baron-Van Evercooren A, Clerin-Duhamel E, Lapie P, Gansmuller A, Lachapelle F, Gumpel M (1992). The fate of Schwann cells transplanted in the brain during development. Dev Neurosci 14:73–84. [DOI] [PubMed] [Google Scholar]
- Berthold C-H (1978). Morphology of normal peripheral axons. In: Physiology and pathobiology of axons (Waxman SG, ed.) , pp. 3–64. New York: Raven.
- Bhat MA, Rios JC, Lu Y, Garcia-Fresco GP, Ching W, St Martin M, Li J, Einheber S, Chesler M, Rosenbluth J, Salzer JL, Bellen HJ (2001). Axon-glia interactions and the domain organization of myelinated axons requires neurexin IV/Caspr/Paranodin. Neuron 30:369–383. [DOI] [PubMed] [Google Scholar]
- Black JA, Cummins TR, Plumpton C, Chen YH, Hormuzdiar W, Clare JJ, Waxman SG (1999). Upregulation of a silent sodium channel after peripheral, but not central nerve injury in DRG neurons. J Neurophysiol 82:2776–2785. [DOI] [PubMed] [Google Scholar]
- Black JA, Liu S, Tanaka M, Cummins TR, Waxman SG (2004). Changes in the expression of tetrodotoxin-sensitive sodium channels within dorsal root ganglia neurons in inflammatory pain. Pain 108:237–247. [DOI] [PubMed] [Google Scholar]
- Blakemore WF, Crang AJ (1985). The use of cultured autologous Schwann cells to remyelinate areas of persistent demyelination in the central nervous system. J Neurol Sci 70:207–223. [DOI] [PubMed] [Google Scholar]
- Blakemore WF, Murray JA (1981). Quantitative examination of internodal length of remyelinated nerve fibres in the central nervous system. J Neurol Sci 49:273–284. [DOI] [PubMed] [Google Scholar]
- Boiko T, Rasband MN, Levinson SR, Caldwell JH, Mandel G, Timmer JS, Matthews G (2001). Compact myelin dictates the differential targeting of two sodium channel isoforms in the same axon. Neuron 30:91–104. [DOI] [PubMed] [Google Scholar]
- Bostock H, Sears TA, Sherratt RM (1981). The effects of 4-aminopyridine and tetraethylammonium ions on normal and demyelinated mammalian nerve fibres. J Physiol (Lond) 313:301–315. [DOI] [PMC free article] [PubMed] [Google Scholar]
- Boyd JG, Lee J, Skihar V, Doucette R, Kawaja MD (2004). LacZ-expressing olfactory ensheathing cells do not associate with myelinated axons after implantation into the compressed spinal cord. Proc Natl Acad Sci USA 17:2162–2166. [DOI] [PMC free article] [PubMed] [Google Scholar]
- Brustle O, Jones KN, Learish RD, Karram K, Choudhary K, Wiestler OD, Duncan ID, McKay RD (1999). Embryonic stem cell-derived glial precursors: a source of myelinating transplants. Science 285:754–756. [DOI] [PubMed] [Google Scholar]
- Caldwell JH, Schaller KL, Lasher RS, Peles E, Levinson SR (2000). Sodium channel Na(v) 1.6 is localized at nodes of Ranvier, dendrites, and synapses. Proc Natl Acad Sci USA 97:5616–5620. [DOI] [PMC free article] [PubMed] [Google Scholar]
- Cao Q, Xu XM, Devries WH, Enzmann GU, Ping P, Tsoulfas P, Wood PM, Bunge MB, Whittemore SR (2005). Functional recovery in traumatic spinal cord injury after transplantation of multineurotrophin-expressing glial-restricted precursor cells. J Neurosci 25:6947–6957. [DOI] [PMC free article] [PubMed] [Google Scholar]
- Chiu SY, Ritchie JM (1980). Potassium channels in nodal and internodal axonal membrane of mammalian myelinated fibres. Nature 284:170–171. [DOI] [PubMed] [Google Scholar]
- Devon R, Doucette R (1992). Olfactory ensheathing cells myelinate dorsal root ganglion neuritis. Brain Res 589:175–179. [DOI] [PubMed] [Google Scholar]
- Doucette R (1991). PNS-CNS transitional zone of the first cranial nerve. J Comp Neurol 312:451–466. [DOI] [PubMed] [Google Scholar]
- Duncan ID, Hammang JP, Gilmore SA (1988). Schwann cell myelination of the myelin deficient rat spinal cord following X-irradiation. Glia 1:233–239. [DOI] [PubMed] [Google Scholar]
- Dupree JL, Girault J-A, Popko B (1999). Axo-glial interactions regulate the localization of axonal paranodal proteins. J Cell Biol 147:1145–1151. [DOI] [PMC free article] [PubMed] [Google Scholar]
- Eichberg J (2002). Myelin P0: new knowledge and new roles. Neurochem Res 27:1331–1340. [DOI] [PubMed] [Google Scholar]
- Eshed Y, Feinberg K, Poliak S, Sabanay H, Sarig-Nadir O, Spiegel I, Bermingham JR, Peles E (2005). Gliomedin mediates Schwann cell-axon interaction and the molecular assembly of the nodes of Ranvier. Neuron 47:215–229. [DOI] [PubMed] [Google Scholar]
- Franklin RJ, Gilson JM, Franceschini IA, Barnett SC (1996). Schwann cell-like myelination following transplantation of an olfactory bulb-ensheathing cell line into areas of demyelination in the adult CNS. Glia 17:217–224. [DOI] [PubMed] [Google Scholar]
- Girault JA, Peles E (2002). Development of nodes of Ranvier. Curr Opin Neurobiol 12:476–485. [DOI] [PubMed] [Google Scholar]
- Gledhill RF, McDonald WI (1977). Morphological characteristics of central demyelination and remyelination: a single-fiber study. Ann Neurol 1:552–560. [DOI] [PubMed] [Google Scholar]
- Goldin AL, Barchi RL, Caldwell JH, Hofmann F, Howe JR, Hunter JC, Kallen RG, Mandel G, Meisler MH, Netter YB, Noda M, Tamkun MM, Waxman SG, Wood JN, Catterall WA (2000). Nomenclature of voltage-dated sodium channels. Neuron 28:365–368. [DOI] [PubMed] [Google Scholar]
- Greenfield S, Brostoff S, Eylar EH, Morell P (1973). Protein composition of myelin of the peripheral nervous system. J Neurochem 20:1207–1216. [DOI] [PubMed] [Google Scholar]
- Hildebrand C, Kocsis JD, Berglund S, Waxman SG (1985). Myelin sheath remodeling in regenerated rat sciatic nerve. Brain Res 358:163–170. [DOI] [PubMed] [Google Scholar]
- Hofstetter CP, Holmstrom NA, Lilja JA, Schweinhardt P, Hao J, Spenger C, Wiesenfeld-Hallin Z, Kurpad SN, Frisen J, Olson L (2005). Allodynia limits the usefulness of intraspinal neural stem cell grafts: directed differentiation improves outcome. Nat Neurosci 8:346–353. [DOI] [PubMed] [Google Scholar]
- Honmou O, Felts PA, Waxman SG, Kocsis JD (1996). Restoration of normal conduction properties in demyelinated spinal cord axons in the adult rat by transplantation of exogenous Schwann cells. J Neurosci 16:3199–3208. [DOI] [PMC free article] [PubMed] [Google Scholar]
- Imaizumi T, Lankford KL, Waxman SG, Greer CA, Kocsis JD (1998). Transplanted olfactory ensheathing cells remyelinate and enhance axonal conduction in demyelinated dorsal column of the rat spinal cord. J Neurosci 18:6176–6185. [DOI] [PMC free article] [PubMed] [Google Scholar]
- Imaizumi T, Lankford KL, Kocsis JD (2000a). Transplantation of olfactory ensheathing cells or Schwann cells restores rapid and secure conduction across the transected spinal cord. Brain Res 854:70–78. [DOI] [PubMed] [Google Scholar]
- Imaizumi T, Lankford KL, Burton WV, Fodor WL, Kocsis JD (2000b). Xenotransplantation of transgenic pig olfactory ensheathing cells promotes axonal regeneration in rat spinal cord. Nat Biotechnol 18:949–953. [DOI] [PMC free article] [PubMed] [Google Scholar]
- Isacoff EY, Jan YB, Jan LY (1990). Evidence for the formation of heteromultimeric potassium channels in Xenopus oocytes. Nature 345:530–535. [DOI] [PubMed] [Google Scholar]
- Jenkins SM, Bennett V (2002). Developing nodes of Ranvier are defined by ankyrin-G clustering and are independent of paranodal axoglial adhesion. Proc Natl Acad Sci USA 99:2303–2308. [DOI] [PMC free article] [PubMed] [Google Scholar]
- Kaplan MR, Meyer-Franke A, Lambert S, Bennett V, Duncan ID, Levinson SR, Barres BA (1997). Induction of sodium channel clustering by oligodendrocytes. Nature 386:724–728. [DOI] [PubMed] [Google Scholar]
- Kaplan MR, Cho MH, Ullian EM, Isom LL, Levinson SR, Barres BA (2001). Differential control of clustering of the sodium channels Na(v)1.2 and Na(v)1.6 at developing CNS nodes of Ranvier. Neuron 30:105–109. [DOI] [PubMed] [Google Scholar]
- Kato T, Honmou O, Uede T, Hashi K, Kocsis JD (2000). Transplantation of human olfactory ensheathing cells elicits remyelination of demyelinated rat spinal cord. Glia 30:209–218. [DOI] [PMC free article] [PubMed] [Google Scholar]
- Keirstead HS, Ben-Hur T, Rogister B, O’Leary MT, Dubois-Dalcq M, Blakemore WF (1999). Polysialylated neural cell adhesion molecule-positive CNS precursors generate both oligodendrocytes and Schwann cells to remyelinate the CNS after transplantation. J Neurosci 19:7529–7536. [DOI] [PMC free article] [PubMed] [Google Scholar]
- Keirstead HS, Nistor G, Bernal G, Totoiu M, Cloutier F, Sharp K, Steward O (2005). Human embryonic stem cell-derived oligodendrocyte progenitor cell transplants remyelinate and restore locomotion after spinal cord injury. J Neurosci 25:4694–4705. [DOI] [PMC free article] [PubMed] [Google Scholar]
- Kocsis JD, Sasaki M (2005). Transplantation of peripheral myelin-forming cells to repair demyelinated axons. In: Multiple sclerosis as a neuronal disease (Waxman SG, ed.) , pp. 421–433. San Diego: Elsevier.
- Kocsis JD, Waxman SG (1980). Absence of potassium conductance in central myelinated axons. Nature 287:348–349. [DOI] [PubMed] [Google Scholar]
- Kocsis JD, Ruiz JA, Waxman SG (1983). Maturation of mammalian myelinated fibers: changes in action-potential characteristics following 4-aminopyridine application. J Neurophysiol 50:449–463. [DOI] [PubMed] [Google Scholar]
- Lakatos A, Smith PM, Barnett SC, Franklin RJ (2003). Meningeal cells enhance limited CNS remyelination by transplanted olfactory ensheathing cells. Brain 126:598–609. [DOI] [PubMed] [Google Scholar]
- Li Y, Field PM, Raisman G (1997). Repair of adult rat corticospinal tract by transplants of olfactory ensheathing cells. Science 277:2000–2002. [DOI] [PubMed] [Google Scholar]
- Li Y, Field PM, Raisman G (1998). Regeneration of adult rat corticospinal axons induced by transplanted olfactory ensheathing cells. J Neurosci 18:10514–10524. [DOI] [PMC free article] [PubMed] [Google Scholar]
- Menegoz M, Gaspar P, LeBert M, Galvez T, Burgava F, Palfrey C, Ezan P, Arnos F, Girault JA (1997). Paranodin, a glycoprotein of neuronal paranodal members. Neuron 19:319–331. [DOI] [PubMed] [Google Scholar]
- Novakovic SD, Deerinck TJ, Levinson SR, Shrager P, Ellisman MN (1996). Cluster of axonal Na+ channels adjacent to remyelinating Schwann cells. J Neurocytol 25:403–412. [DOI] [PubMed] [Google Scholar]
- Novakovic SD, Levinson SR, Schachner M, Shrager P (1998). Disruption and reorganization of sodium channels in experimental allergic neuritis. Muscle Nerve 21:1019–1032. [DOI] [PubMed] [Google Scholar]
- Peles E, Salzer JL (2000). Molecular domains of myelinated axons. Curr Opin Neurobiol 10:558–565. [DOI] [PubMed] [Google Scholar]
- Plant GW, Currier PF, Cuervo EP, Bates ML, Pressman Y, Bunge MB, Wood PM (2002). Purified adult ensheathing glia fail to myelinate axons under culture conditions that enable Schwann cells to form myelin. J Neurosci 22:6083–6091. [DOI] [PMC free article] [PubMed] [Google Scholar]
- Ramon-Cueto A, Plant GW, Avila J, Bunge MB (1998). Long-distance axonal regeneration in the transected adult rat spinal cord is promoted by olfactory ensheathing glia transplants. J Neurosci 18:3803–3815. [DOI] [PMC free article] [PubMed] [Google Scholar]
- Ramon-Cueto A, Cordero MI, Santos-Benito FF, Avila J (2000). Functional recovery of paraplegic rats and motor axon regeneration in their spinal cords by olfactory ensheathing glia. Neuron 25:425–435. [DOI] [PubMed] [Google Scholar]
- Rasband MN (2004). It’s “juxta” potassium channel. J Neurosci Res 76:749–757. [DOI] [PubMed] [Google Scholar]
- Rasband MN, Trimmer JS (2001a). Subunit composition and novel localization of K+ channels in spinal cord. J Comp Neurol 429:166–176. [DOI] [PubMed] [Google Scholar]
- Rasband MN, Trimmer JS (2001b). Developmental clustering of ion channels at and near the node of Ranvier. Dev Biol 236:5–16. [DOI] [PubMed] [Google Scholar]
- Rasband MN, Trimmer JS, Schwarz TL, Levinson SR, Ellisman MN, Schachner M, Schrager P (1998). Potassium channel distribution, clustering, and function in remyelinating rat axons. J Neurosci 18:36–47. [DOI] [PMC free article] [PubMed] [Google Scholar]
- Rasband MN, Peles E, Trimmer JS, Levinson SR, Lux SE, Shrager P (1999a). Dependence of nodal sodium channel clustering on paranodal axoglial contact in the developing CNS. J Neurosci 19:7516–7528. [DOI] [PMC free article] [PubMed] [Google Scholar]
- Rasband MN, Trimmer JS, Peles E, Levinson SR, Shrager P (1999b). K+ channel distribution and clustering in developing and hypomyelinated axons of the optic nerve. J Neurocytol 28:319–331. [DOI] [PubMed] [Google Scholar]
- Rhodes KJ, Strassle BW, Monaghan MM, Bekele-Arcuri Z, Matos MF, Trimmer JS (1997). Association and colocalization of K+ channel α and β-subunit polypeptides in rat brain. J Neurosci 15:5360–5371. [DOI] [PMC free article] [PubMed] [Google Scholar]
- Rios JC, Melendez-Vasquez CV, Einheber S, Lustig M, Grumet M, Hemperly J, Peles E, Salzer JL (2000). Contactin-associated protein (Caspr) and contactin form a complex that is targeted to the paranodal junctions during myelination. J Neurosci 20:8354–8364. [DOI] [PMC free article] [PubMed] [Google Scholar]
- Rios JC, Rubin M, St Martin M, Downey RT, Einheber S, Rosenbluth J, Levinson SR, Bhat M, Salzer JL (2003). Paranodal interactions regulate expression of sodium channel subtypes and provide a diffusion barrier for the node of Ranvier. J Neurosci 23:7001–7011. [DOI] [PMC free article] [PubMed] [Google Scholar]
- Sasaki M, Lankford KL, Zemedkun M, Kocsis JD (2004). Identified olfactory ensheathing cells transplanted into the transected dorsal funiculus bridge the lesion and form myelin. J Neurosci 24:8485–8493. [DOI] [PMC free article] [PubMed] [Google Scholar]
- Sasaki M, Hains BC, Lankford KL, Waxman SG, Kocsis JD (2006). Protection of corticospinal tract neurons after dorsal spinal cord transection and engraftment of olfactory ensheathing cells. Glia 53:352–359. [DOI] [PMC free article] [PubMed] [Google Scholar]
- Takami T, Oudega M, Bater ML, Wood PM, Kleitman N, Bunge MB (2002). Schwann cell but not olfactory ensheathing glia transplants improve hindlimb locomotor performance in the moderately contused adult rat thoracic spinal cord. J Neurosci 22:6670–6681. [DOI] [PMC free article] [PubMed] [Google Scholar]
- Targ EF, Kocsis JD (1985). 4-Aminopyridine leads to restoration of conduction in demyelinated rat sciatic nerve. Brain Res 328:358–361. [DOI] [PubMed] [Google Scholar]
- Targ EF, Kocsis JD (1986). Action potential characteristics of demyelinated rat sciatic nerve following application of 4-aminopyridine. Brain Res 363:1–9. [DOI] [PubMed] [Google Scholar]
- Vabnick I, Messing A, Chiu SY, Levinson SR, Schachner M, Roder J, Li C, Novakovic S, Shrager P (1997). Sodium channel distribution in axons of hypomyelinated and MAG null mutant mice. J Neurosci Res 50:321–336. [DOI] [PubMed] [Google Scholar]
- Wang H, Kunkel DD, Martin TM, Schwartzkroin PA, Tempel BL (1993). Heteromultimeric K+ channels in terminal and juxtaparanodal regions of neurons. Nature 365:75–79. [DOI] [PubMed] [Google Scholar]
- Waxman SG, Ritchie JM (1985). Organization of ion channels in the myelinated nerve fiber. Science 228:1502–1507. [DOI] [PubMed] [Google Scholar]
- Weiner LP, Waxman SG, Stohlman SA, Kwan A (1980). Remyelination following viral-inducted demyelination: ferric ion-ferrocyanide staining of nodes of Ranvier within the CNS. Ann Neurol 8:580–583. [DOI] [PubMed] [Google Scholar]