Abstract
We present a model for the migration of glioma cells on substrates of collagen and astrocytes. The model is based on a cellular automaton where the various dynamical effects are introduced through adequate evolution rules. Using our model, we investigate the role of homotype and heterotype gap junction communication and show that it is possible to reproduce the corresponding experimental migration patterns. In particular, we confirm the experimental findings that inhibition of homotype gap junctions favours migration while heterotype inhibition hinders it. Moreover, the effect of heterotype gap junction inhibition dominates that of homotype inhibition.
Keywords: tumour cells, gap junction, migration properties
1. Introduction
Malignant gliomas are a particularly lethal form of cancer. Their lethality is largely due to diffuse invasiveness. Individual glioma cells migrate into the surrounding brain parenchyma, while other cancers, metastatic to this site, do not intermingle with host cells and grow as circumscribed destructive masses (Giese et al. 2003). This diffuse infiltration is also the origin of the failure of surgical treatment (Gaspar et al. 1992; Puchner et al. 2000). By the time the tumour is diagnosed, glioma cells have migrated over large distances well beyond the main bulk of the tumour. Thus, following resection, they usually reconstitute a tumour within a few months (Giese et al. 2003). Invasiveness will probably compromise newer therapeutic modalities such as antiangiogenic drugs, which reduce the tumour bulk but at the same time could stimulate glioma cell migration (Lamszus et al. 2005).
The importance of migration in the development of malignant gliomas explains the interest in studies of this process, in vitro and in vivo (Chicoine & Silbergeld 1995). Invasion of glioma cells into normal tissue is a complex process, which involves tumour cell–ECM (extracellular matrix) interactions (Giese et al. 1995, 1996; Mahesparan et al. 1999) as well as tumour cell–normal astrocyte interactions (Oliveira et al. 2005) and biochemical processes governing the active motion of the cell (for a review, see Demuth & Berens (2004)). Most in vitro studies focus on interactions between migrating glioma cells and ECM, involving adhesion, degradation and remodelling (Knott et al. 1998). Less is known about the role of glioma cell–glioma cell and glioma cell–normal astrocyte communication, and especially the role of gap junctions (GJs). The GJs are small channels resulting from the docking of two transmembrane connexons between two adjacent cells (Yeager & Nicholson 1996). Connexin proteins (Cx) are the major component of GJs, and, in the brain, Cx43 is the major Cx of astrocytes (Dermietzel & Spray 1993). Cells can exchange small molecules like ions (calcium), ATP, sugars and amino acids through GJs.
Recent studies increasingly identify a positive role for GJ communication in malignant glioma invasion (McDonough et al. 1999; Zhang et al. 1999, 2003; Aronica et al. 2001; Lin et al. 2002; Oliveira et al. 2005). These studies show that glioma cells can establish functional GJs with both other glioma cells (homotype GJs) and surrounding astrocytes (heterotype GJs). Therefore, even if strongly reduced (Zhang et al. 1999; Lin et al. 2002), the remaining efficient GJs seem to suffice to establish powerful communication between invasive tumour cells at the tumour margin (indeed, it has been suggested that the efficacy of GJs depends on the location of the cells inside the tumour: invasive cells at the tumour margin could express higher levels of connexins than cells close to the centre (Aronica et al.; Oliveira et al. 2005).
The role of the homotype and heterotype interactions in gliomas is only beginning to be understood, and currently there is practically no evidence evaluating their concomitant contribution to the invasiveness of gliomas. Homotype interactions can be studied in vitro on an acellular (passive) substrate. McDonough et al. (1999) showed in vitro that a decrease in GJ communication results in an increase in glioma cells' motility. They dubbed this effect the ‘let go…let's go’ paradigm. Oliveira et al. (2005) report an enhanced migration when GJs are inhibited in lumps of cells migrating on a substrate of collagen. Heterotype GJ communication between glioma cells and surrounding astrocytes can be established (Zhang et al. 1999; Aronica et al. 2001; Oliveira et al. 2005). It seems that heterotype GJ communications have an opposite role to that of homotype GJs: while homotype GJs limit migration, heterotype GJs promote migration (Lin et al. 2002; Zhang et al. 2003; Oliveira et al. 2005) and prevail on the homotype GJ effect when both coexist. This conclusion reinforces the idea of cooperation between host astrocytes and glioma cells.
Modelling can help to answer some open questions and leads to formulating hypotheses about the underlying mechanisms of migration of glioma cells. What is the nature of interactions between migrating cells? Is the nature of homotype and heterotype interaction the same? Are homotype and heterotype interactions inhibited in the same way, in the same proportions? Do heterotype interactions really prevail over homotype when both coexist? And what can explain this?
In this article, we present a model that investigates the opposite roles of homotype and heterotype GJ communications. In a previous article (Aubert et al. 2006), we have presented a model for the analysis of glioma cell migration over collagen. That model was based on a cellular automaton where the update rules simulate the dynamics of the cell–cell interaction. We showed that we were able to correctly reproduce experimental glioma cells' migration results by only introducing attractive contact interaction between migrating cells. The present study constitutes a twofold extension of the previous one. We start by adding the modelling of heterotype interaction between tumour cells and astrocytes and, then, we model the effect of GJ inhibition for homotype and heterotype interactions.
We performed new experiments of migration on collagen with or without GJ inhibition, in order to compare with the results of simulations. We show that it is possible to reproduce the migration patterns in homotype and heterotype situations when both types of interaction are modelled in the same way.
2. Material and methods
2.1 Cell culture and inhibition of GJs
Cell culture experiments were, with some modifications, essentially carried out as described earlier (De Bouard et al. 2002; Oliveira et al. 2005; Aubert et al. 2006). The experimental set-up was designed to separately examine homotype and heterotype GJ communication and its inhibition on glioblastoma cell migration. Homotype interactions were studied after seeding glioma cell spheroids on collagen IV (1 μg/cm2; described in detail in Aubert et al. (2006)). To concomittantly assess homotype and heterotype interactions, spheroids were seeded onto a confluent monolayer of astrocytes. Both types of experiment were carried out with and without pharmacological inhibition of GJs.
2.1.1 Glioma cell spheroids
Spheroids from human glioma cells (GL15, an established glioma cell line which has been extensively studied in our laboratory (De Bouard et al. 2002; Oliveira et al. 2005)) were obtained by the overlay-culture method. Briefly, GL15 cells suspended in GL15 medium (Oliveira et al. 2005) were seeded at a density of 2.104 cells cm−2 in 3.5 cm Petri dishes coated with an attachment prohibiting substance (agar) and incubated in a standard cell culture incubator. Spheroids (100–1200 μm in diameter) formed within 10–14 days.
2.1.2 Primary astrocyte cultures
Primary astrocyte cultures were obtained by mechanical mincing and passing through a nylon mesh (22 μm) of cerebral hemispheres of neonatal C57/bl6 mice (Charles River, France). After initial removal of fibroblasts and 7–10 day incubation in astrocyte medium (MEM GIBCO, France) complemented with 10% foetal calf serum (ATGC Biotechnological, France), glutamine 2 mM, d-glucose 33 mM, penicillin 100 UI mL−1, streptomycin 100 μg mL−1 and amino acids 0.5X (all from Eurobio, France), aconfluent monolayer containing more than 95% of glial fibrillary acidic protein-positive cells was obtained.
2.1.3 Co-culture experiments and inhibition of GJs
On confluence, GL15 spheroids selected under a stereo microscope were seeded on top of the astroglial monolayer, and cultures were continued for 4 days. In some experiments, GL15 cells were transfected with green fluorescent protein. To inhibit GJs, selected co-cultures were treated with 30 μM of carbenoxolone (CBX; Sigma, France); at this concentration, and applied at a daily basis, CBX brought on an eightfold reduction of heterotype communication without any toxic effects on either astrocytes or GL15 (Oliveira et al. 2005).
2.2 Treatment of experimental results
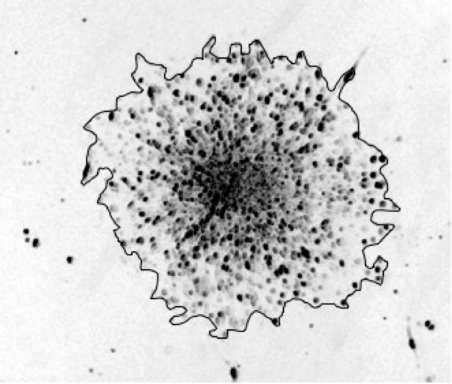
We hand drew the envelope of the surface occupied by at least 95% of the spheroid cells and measured the interior surface. In figure 1, we show a typical photograph of a spheroid after 48 h of migration together with the envelope of the occupied surface. At the exterior of this envelope, we can see some isolated cells (less than 5% of the total number of cells).
Figure 1.
Experimental cell migration pattern over 48 h with CBX on collagen IV with the envelope of the surface.
Two different data sources were used in this paper, new experimental data as well as that published (Oliveira et al. 2005). The new experimental data correspond to migration on collagen IV, with or without CBX, at times 12, 24, 36 and 48 h after the beginning of migration (time t0). The data published (Oliveira et al. 2005), presented under the name of ‘migrating index’, are renormalized and cumulative. They concerned migration on an astrocyte monolayer, 18, 30 and 42 h after t0, and migration on collagen IV, 4 days after t0, both with and without CBX.
We have computed the mean surface for cell migration on the two different substrates. In the case of migration over collagen, the surface (with or without CBX) is obtained as the mean of surfaces of five to six spheroids for various times after t0 (12, 24, 36, 48 h for the new data and 4 days for the data of Oliveira et al. (2005)). In the case of migration over a monolayer of astrocytes, the mean surface occupied by glioma cells is obtained from the surfaces of five spheroids at times 18, 30 and 42 h after t0 (from the published cumulative data; Oliveira et al. 2005). We have compared the ratio of the surface occupied by glioma cells when GJs are inhibited with the surface in the control situation. For simplicity, we shall refer to this ratio as the ratio of ‘treated to control’.
3. The model
We use a cellular automaton based upon a hexagonal lattice (the most isotropic among all lattices that pave the plane periodically). Cells are represented by hexagons of radius of 35 μm, the centres of which form a triangular lattice. A central part of the lattice is occupied by the equivalent of the glioma cell spheroid, which, we assume, may eject an unlimited number of cells. Once a free position in the hexagons surrounding the centre is created, it is immediately occupied by a cell ‘ejected from the centre’. The diameter of the centre corresponds to the experimental one of approximately 100 μm (Oliveira et al. 2005). The detailed geometry of the model is also described in Aubert et al. (2006).
3.1 Migration on a substrate of collagen
Each hexagon can be occupied by a single cell at each time. Thus, a cell may move only to a free hexagon. At each update of the automaton, we define a random order of all ejected cells and then each cell moves one after the other. When the position of a cell is to be updated, a new position is chosen among its six neighbours. If this position is occupied the cell does not move. Cell proliferation is not considered (as was argued in Aubert et al. (2006), based on experimental evidence, the processes of mitosis and apoptosis practically compensate each other).
The way to account for cell attraction is to privilege motion that preserves contact with a neighbouring cell. We introduce a threshold p (a number between 0 and 1) to measure the intensity of the interactions between cells. For each evolution, we pick a random number r between 0 and 1. If r<p, the cell moves next to an occupied site and the opposite if r>p. If the chosen motion is impossible the cell does not move. With these assumptions, a threshold p>0.5 corresponds to cell attraction (p=1, i.e. maximum cell attraction, means that a cell can only move to a position next to an occupied one), while p<0.5 corresponds in fact to cell repulsion. In Aubert et al. (2006) we found that in order to reproduce the experimental density curves, we had to set p to 1 corresponding to maximum attraction between cells. The origin of this attraction may be attributed to the presence of GJs between cells.
3.2 Migration on a monolayer of astrocytes
We considered two layers in the model: one layer is that of the astrocytes on top of which lies the tumour cell layer. Thus, a glioma cell and an astrocyte can occupy the same position but on different planes. The effective percentage of occupancy of the astrocyte layer is a parameter of the model: it represents the fraction of the occupied sites among all the available sites in the astrocyte layer.
We consider that the homotype interactions (glioma cell–glioma cell interactions) in the tumour cell layer remain the same as in the case of migration on a substrate of collagen, which means that the rules of motion inside this layer are exactly the same as described before: for migration on a passive substrate, the attraction between cells is maximum, i.e. p=1.
For the sake of coherency, we model the heterotype GJ communication as we did for homotype communication, i.e. with a parameter q which quantifies the intensity of attraction between glioma cell and astrocytes. The only difference between the homotype and the heterotype interaction in the model is that a tumour cell can move to a site already occupied by an astrocyte with a given probability, whereas a tumour cell can never move to a site already occupied by another tumour cell. Thus, a glioma cell can communicate with at most six other glioma cells (its six neighbours) and can communicate with at most seven astrocytes (the one just under it and the six astrocytes surrounding it).
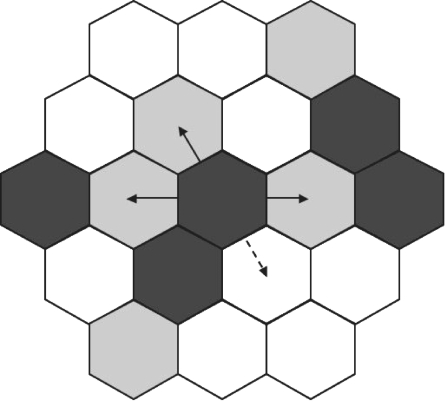
A glioma cell will move to a site occupied by an astrocyte with a probability q. If q is between 0.5 and 1 the glioma cell will preferentially go to a site with an astrocyte, whereas if q is between 0 and 0.5 the glioma cell will avoid astrocyte sites. When p and q are equal to 1, a cell has the choice to move either in contact to a tumour cell or on top of an astrocyte (figure 2). If the chosen site does not satisfy either of these conditions the cell does not move. (The same mechanism can be applied, mutatis mutandis, when p and/or q are smaller than 1.)
Figure 2.
Example of possible cell moves for migration over a monolayer of astrocytes. A dark grey hexagon denotes the presence of a cell and a light grey hexagon denotes the presence of an astrocyte. The cell does not move on to a site occupied by a tumour cell. In the case of maximal attraction between tumour cells and astrocytes the cell can only move next to a site occupied by a tumour cell (dashed line) or on a site with an astrocyte (full line).
3.3 Time calibration
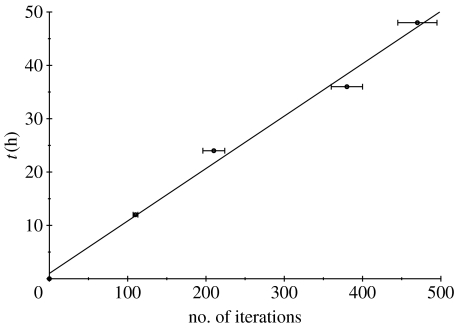
As shown in Aubert et al. (2006), the physical time is linearly related to both the number of ejected cells in the model and the number of iterations of the automaton. The upshot of this is that either the number of ejected cells or the number of iterations of the automaton could account for time in the model. In this paper, we found it more convenient to represent physical time through the number of iterations of the automaton. In figure 3, we represent the linear relation between physical time and number of iterations of the automaton together with the best straight-line fit.
Figure 3.
Physical time with error bars (due to the mixed s.d. between experiments and simulations) as a function of the automaton iterations. The straight line represents the best linear fit.
As a consequence of this choice, we performed the estimation of surfaces occupied by glioma cells after a given time of migration in the case of experimental results and after a given number of iterations in the case of the model. The same number of iterations was used to represent a given physical time in both control and treated simulations and also for both substrates.
3.4 Computational surfaces and ratios
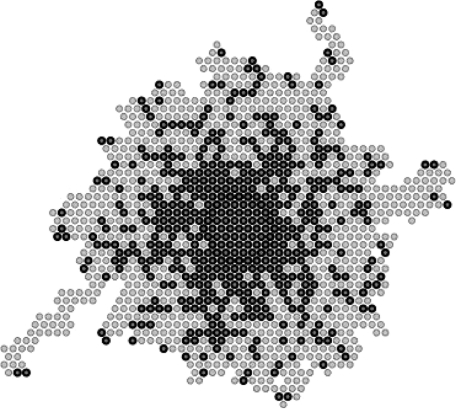
Since in every simulation the effect of fluctuations may be important, our results represent the mean of 300 simulations (for each set of parameters). The choice of this number, 300, is a compromise between minimizing the effect of fluctuations and keeping the calculations manageable. In order to automatically obtain the surface occupied by the cells after migration, we considered the total surface swept during their migration (figure 4). Since this tends to slightly overestimate the surface that we would have obtained, had we applied the same procedure as for the experimental results, an overall corrective factor could have been applied. However, such a factor would not play a role since we compare surface ratios rather than their intrinsic values.
Figure 4.
Simulated cell migration pattern (dark grey) and the corresponding surface (light grey) after 48 h for migration on collagen in the case of maximal attraction between tumour cells (with p=1).
4. Results
4.1 Role of GJ communication in the migration of glioma cells on a substrate of collagen
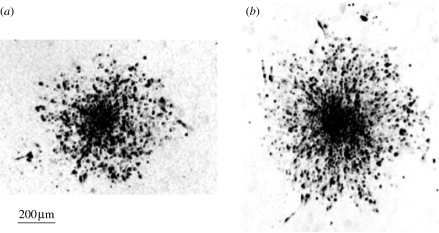
We computed the experimental migration surface at different times (12, 24, 36, 48 h for the new data and 4 days for data from Oliveira et al. (2005)), as explained above. We found that when GJs are inhibited with CBX, the migration is enhanced. Two photographs of cell migration patterns after 48 h are shown in figure 5, one for the control situation (figure 5a) and the other for the situation with inhibited GJs (figure 5b).
Figure 5.
Experimental cell migration patterns after 48 h of migration over a substrate of collagen (a) in the control situation and (b) in the situation with inhibited GJs.
In Aubert et al. (2006), we have shown that in order to reproduce the cell density curves obtained from migration over a collagen substrate we must set p=1, which corresponds to maximum attraction between cells. We assume that the same maximal attraction is present in the experiment (and model) at hand and thus we maintain the same value 1 for the probability threshold p+ (where the + index is associated with the ‘control’ probability).
When GJs are inhibited the attraction between glioma cells diminishes. We represent this by decreasing the value of the threshold p− (here the – index is associated with the ‘treated’ probability), while keeping p≥0.5. If we attribute the essential part of cell interaction to GJs then it would not make much sense to decrease this parameter below 0.5, since in that case the GJ inhibition would introduce a cell interaction in the form of repulsion. Of course if one wishes to take into account the interplay of adhesive/disadhesive mechanisms then a value of p−<0.5 would indicate a preponderance of the latter. As shown in Aubert et al. (2006), a lower p− leads to a more diffuse pattern and cells migrate further.
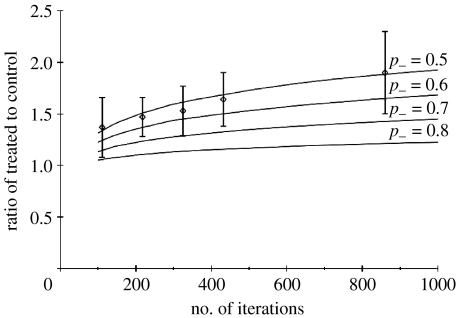
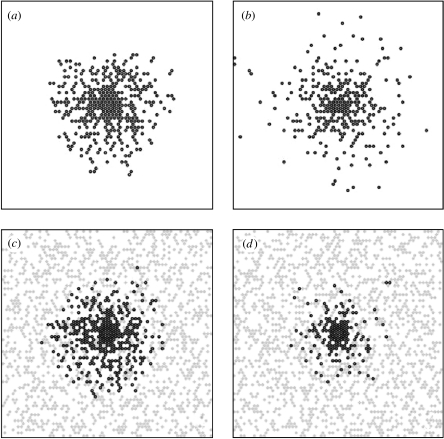
We have simulated cell migration and compared the surface occupied by the cells in the control situation (with p+=1) and in the treated case with various values of p−·(0.5<p−<1). In figure 6, we plot the treated-to-control ratio of surfaces as a function of the number of iterations of the automaton, corresponding to times up to 4 days. This ratio increases (albeit very slowly) with time and depends strongly on the threshold p− (increasing when the latter decreases). The fact that the ratio is larger than 1 as soon as p− is smaller than 1 is consistent with the fact that over a collagen substrate cells with inhibited GJs migrate more. A comparison with the experimental results points to values of p− in the 0.5–0.6 region. We have opted for a value of p−=0.5 for our final comparison to be presented in figure 8 since it is a ‘round’ value which provides a nice fit of experimental results. Note that the error bars on simulation results are around 0.18 for all times, smaller than experimental ones and have not been represented. In figure 9a,b we show cell migration patterns after 48 h obtained from the automaton, in the control situation with p+=1 (figure 9a) and in the case with inhibited GJs with p−=0.5(figure 9b).
Figure 6.
Comparison between experimental data (diamonds) with error bars (values at times 12, 24, 36, 48 h and 4 days after the beginning of migration) and simulated ratio of treated-to-control surfaces as a function of number of iterations, for various values of p−. The standard deviation for the model (not represented in the figure) is equal to 0.18 for all times.
Figure 8.
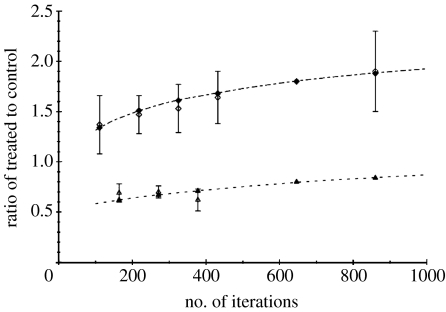
Comparison of the experimental data (filled symbols with error bars) with the results of the automaton (open symbols) as a function of the number of iterations of the automaton, in the case of migration on a substrate of collagen (diamonds) and migration over a monolayer of astrocytes (triangles). For all times, the standard deviations for the model (not represented in the figure) are equal to 0.18 for migration on a substrate of collagen and 0.06 for migration on astrocytes.
Figure 9.
Cell migration patterns after 48 h for simulated migration on a substrate of collagen (a) in the control situation, (b) with inhibited GJs and after 42 h for simulated migration over a monolayer of astrocytes, (c) in the control situation, (d) with inhibited GJs. A dark grey circle denotes the presence of a tumour cell and a grey rhombus denotes the presence of an astrocyte.
4.2 Role of GJ communication in the migration of glioma cells on a monolayer of astrocytes
The experiments reported in Oliveira et al. (2005) analysed the behaviour of the migration of glioma cells over a substrate of astrocytes after 18, 30 and 42 h.
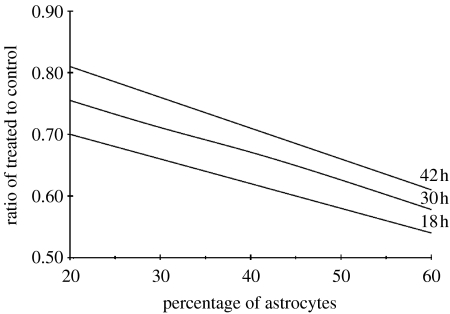
In order to simulate this behaviour, we start by taking p+=1 and q+=1, i.e. when the GJs are not inhibited the attraction is maximum between tumour cells (as on collagen) and between tumour cells and astrocytes. When GJs are inhibited, the interaction of glioma cells is reduced (p−<1), and the same holds true for glioma cell–astrocyte interactions (q−<1). We assumed that CBX has the same effect on glioma cell interactions whether they migrate on collagen or on astrocytes. As a consequence, we simulated the inhibition of homotype GJs by setting p to 0.5, as described in §4.1. In order to investigate the effect of astrocyte concentration, we have varied their percentage and calculated the treated-to-control ratio at fixed numbers of iterations corresponding to 18, 30 and 42 h. In figure 7, we plot the ratio of treated to control in the case of the migration on astrocytes, as a function of the percentage of astrocytes for times 18, 30 and 42 h. Given the experimental value of this ratio (and its dispersion), the best fit is obtained for an effective percentage of astrocytes of around 40%. Thus, for the final comparison (in figure 8) we have adopted the value q−=0.5 with an effective percentage of astrocytes of 40%. Figure 8 gives the ratio of treated to control as a function of number of iterations for the simulation (obtained with (p+=q+=1, p−=q−=0.5,) compared with experimental results at the corresponding times. We conclude that migration is reduced when GJ are inhibited. In the lower part of figure 9, we present simulated patterns of cell migration after 42 h in the control situation where p+ and q+ are equal to 1 (figure 9c) and when GJs are inhibited with p−=0.5 and q−=0.5 and 40% of astrocytes (figure 9d).
Figure 7.
Simulated ratio of treated-to-control surfaces as a function of the percentage of astrocytes after 18, 30 and 42 h of migration. The standard deviation for the model (not represented in the figure) is equal to 0.06 for all times.
5. Discussion
Several recent studies show that GJ communication strongly influences the pattern of migration of glioma cells (McDonough et al. 1999; Lin et al. 2002; Zhang et al. 2003; Oliveira et al. 2005). They also suggest that this GJ communication is used and perverted by glioma cells in order to change the phenotype of surrounding astrocytes (Aronica et al. 2001) and render them more permissive to migration (Oliveira et al. 2005). Oliveira et al. (2005) explored this hypothesis in detail and revealed a functional difference between homotype and heterotype GJ communication. They used different in vitro assays, as follows. One assay consisted of seeding spheroids on a passive substrate, collagen IV, where only homotype interactions of glioma cells exist. When they inhibited GJ with CBX, the migration of glioma cells was enhanced, as if homotype GJs acted as adhesion proteins. This property disappeared in the other assay, which consisted of seeding spheroids on an astrocytic monolayer culture. In this case, glioma cells form heterotype GJs with astrocytes as well as homotype GJs with the other glioma cells. When both types of GJ are inhibited with CBX, the migration of glioma cells was clearly reduced, leading to the conclusion that heterotype GJs are necessary for invasive behaviour of glioma cells and overcome the adhesive properties of homotype GJs.
In this article, we presented a model where homotype and heterotype interactions are modelled in similar ways (local attraction) and where the inhibition of these two types of interactions corresponds in both cases to the decrease of attraction. We compared the simulation results with experimental results from Oliveira et al. (2005) completed by our own experiments. We showed that our model reproduces the different migration patterns, i.e. an enhanced pattern of migration when homotype interactions are inhibited and a reduced one when homotype and heterotype interactions are inhibited.
5.1 Migration on a substrate of collagen
Homotype GJs are modelled with the probability p that a cell moves to a site next to its actual neighbours. It means that the cell ‘communicates’ with its neighbours and ‘knows’ on which sites they are. This corresponds to the fact that GJs are local interactions between adjacent cells in contact with each other (Yeager & Nicholson 1996). We previously made a study of the migration of glioma cells on a passive substrate of collagen, where only homotype GJs are involved (Aubert et al. 2006). We showed in that case that in order to reproduce experimental density curves of cells migrating out of the spheroids, attraction between glioma cells had to be maximal (p+=1). This means that a cell which can move whilst staying in contact with a neighbouring cell will preferably do so. This maximum attraction is in line with experimental results, where adhesion properties of connexins have recently been brought into light (Lin et al. 2002).
In this article, we present new experimental data of spreading of spheroids on a substrate of collagen, when GJ communication is inhibited by addition of CBX. We confirm previous results, as we find that the migration on collagen is enhanced when GJ communication is inhibited. In simulations, larger surfaces of migration correspond to a smaller value of p (compared with the control situation where p+=1). More precisely, the comparison with the simulation results leads to a value of p− between 0.5 and 0.6 (figure 6). Given the large error bars, we are not able to deduce a precise value of p. Had we neglected the error bars, the optimal value would have been around 0.52–0.53, but the error bars do muddle this estimate to the point that anything between 0.5 and 0.6 is not unreasonable. Thus, finally we opted for the closest round value, namely 0.5. This corresponds to the case of the complete absence of interaction between cells when GJs are inhibited, which may not be the case in experiments. First, adhesion proteins (other than GJs) should not be affected by the action of CBX. Second, CBX may only partially inhibit the GJs, as suggested by the scrape-loading experiments (Oliveira et al. 2005). We checked that our results would not be strongly affected by a value of p− slightly larger (between 0.5 and 0.6).
5.2 Migration on a monolayer of astrocytes
In cell migration assays, spheroids are seeded on an astrocyte monolayer culture, so the glioma cells do not penetrate the astrocyte culture and the migration is two-dimensional. This is the reason why we considered two layers in the model: one layer is the astrocyte on top of which lies the tumour cell layer. Thus, glioma cells and astrocytes can occupy the same position but on different planes. For all practical purposes, astrocytes in a confluent monolayer culture could be considered as non-motile cells. Time-lapse experiments registered only chaotic non-directional movements of negligible magnitude 1.24±0.36 μm in 5 h.
The rules of motion inside the layer of glioma cells are exactly the same as described before, for migration on a passive substrate: in the control situation we have p+=1, whereas in the treated situation we take p−=0.5. For the sake of coherency, we model the heterotype GJ communication as we did for homotype communication, i.e. with a parameter q which quantifies the intensity of attraction between glioma cell and astrocytes and we set p=q.
To sum up, the control situation corresponds to p+=q+=1 and the treated situation to p−=q−=0.5. In experiments of Oliveira et al. (2005), heterocellular coupling was assessed in glioma–astrocytes co-cultures, using the dual-label technique, in which glioma cells are pre-labelled donor cells and astrocytes potential recipient cells, labelled through GJ diffusion of the dye. It was found that one donor GL15 cell communicates through GJs with 4.05±0.6 recipient astrocytes in the control situation. In our model, the configuration that would at first sight appear closest to the experimental monolayer of astrocytes composed of confluent cells would be the situation where all the sites are occupied. However, this would be too hasty an assumption. In the case of our automaton, each tumour cell communicates with seven astrocytes: the one at the same position just below the tumour cell and the six astrocytes around the first one. To match the number of communicating astrocytes to a more realistic value, one possibility is to consider the percentage of occupancy of the astrocyte layer as an effective percentage of occupancy that we can vary freely. With an effective percentage of occupancy of the astrocyte layer of 55%, the number of communicating astrocytes per tumour cell falls to around 4, which is closer to experiments. We finally set the effective percentage of occupancy in the astrocyte layer at 40%, because it is the value for which the simulated ratio of treated-to-control surfaces best fits the experimental data (figure 8). The value of 40% of occupancy corresponds to a number of communicating astrocytes per tumour cell of 2.8, which is smaller but still comparable to the experimental data. Nevertheless, we would need more experimental data, especially on longer time scales for migration on a monolayer, in order to pinpoint our value of the effective percentage of occupancy.
For a large area of variation of the effective percentage of occupancy, the ratio of treated-to-control surfaces is much smaller than 1, as in the experiments. This leads us to the conclusion that the effect of the inhibition of homotype GJs is completely overshadowed by the effect of heterotype GJ inhibition. In the model, when q>0.5 for migration on astrocytes, cells preferentially go onto sites that are just above sites occupied by astrocytes (‘sites above astrocytes’ for simplicity). When q=1, cells only move onto such sites. On the other hand, when q<1, for example 0.5, cells only have a probability of 0.5 to move onto these sites above astrocytes. This means that half of the time cells avoid sites above astrocytes and astrocytes act as obstacles. This explains why migration when q=0.5 is reduced compared with the case when q=1 (figure 9c,d). This effect prevails over the enhancement of migration when p goes from 1 to 0.5. This was not obvious, and we did not constrain our model in order to account for this effect. On the contrary, it is an emergent property of the collective behaviour of the cells. This important point will have to be confirmed, first in three-dimensional experiments and second in in vivo experiments. If confirmed, it could have a clinical interest, since inhibiting GJ communication could help to reduce the invasion of glioma cells.
In conclusion, with a very simple model and tuning only two parameters (the probability threshold p=q and the effective percentage of occupancy of the astrocyte layer), we were able to reproduce quantitatively experimental data on the migration of glioma cells on two different substrates and the role of homotype and heterotype communication through GJ in each case. We took into account the experimental number of astrocytes a tumour cell can communicate with in a very simple way, namely by varying the effective percentage of occupancy of the astrocyte layer.
We expect to use this model to simulate more realistic experiments, for example, migration on brain slices. In this case the astrocytes are not confluent, contrary to what happens in monolayers of astrocytes. It is likely that the presence of the other components of the brain structure will still decrease the number of astrocytes that communicate with one glioma cell. As in the present study, an effective percentage of occupancy of the astrocyte layer could also be used so as to match the number of communicating astrocytes. Moreover, our two-dimensional model could be extended to a three-dimensional one, in order to describe migration into thick brain slices or even migration after transplantation of tumour cells in vivo.
References
- Aronica E, Gorter J.A, Jansen G.H, Leenstra S, Yankaya B, Troost D. Expression of connexin 43 and connexin 32 gap-junction proteins in epilepsy-associated brain tumors and in the perilesional epileptic cortex. Acta Neuropathol. 2001;101:449–459. doi: 10.1007/s004010000305. [DOI] [PubMed] [Google Scholar]
- Aubert M, Badoual M, Fereol S, Christov C, Grammaticos B. A cellular automaton model for the migration of glioma cells. Phys. Biol. 2006;3:93–100. doi: 10.1088/1478-3975/3/2/001. [DOI] [PubMed] [Google Scholar]
- Chicoine M.R, Silbergeld D.L. Assessment of brain tumor cell motility in vivo and in vitro. J. Neurosurg. 1995;82:615–622. doi: 10.3171/jns.1995.82.4.0615. [DOI] [PubMed] [Google Scholar]
- De Bouard S, et al. Invasion of human glioma biopsy specimens in cultures of rodent brain slices: a quantitative analysis. J. Neurosurg. 2002;97:169–176. doi: 10.3171/jns.2002.97.1.0169. [DOI] [PubMed] [Google Scholar]
- Demuth T, Berens M.E. Molecular mechanisms of glioma cell migration and invasion. J. Neurooncol. 2004;70:217–228. doi: 10.1007/s11060-004-2751-6. [DOI] [PubMed] [Google Scholar]
- Dermietzel R, Spray D.C. Gap junctions in the brain: where, what type, how many and why? Trends Neurosci. 1993;16:186–192. doi: 10.1016/0166-2236(93)90151-B. [DOI] [PubMed] [Google Scholar]
- Gaspar L.E, Fisher B.J, Macdonald D.R, LeBer D.V, Halperin E.C, Schold S.C, Jr, Cairncross J.G. Supratentorial malignant glioma: patterns of recurrence and implications for external beam local treatment. Int. J. Radiat. Oncol. Biol. Phys. 1992;24:55–57. doi: 10.1016/0360-3016(92)91021-e. [DOI] [PubMed] [Google Scholar]
- Giese A, Loo M.A, Rief M.D, Tran N, Berens M.E. Substrates for astrocytoma invasion. Neurosurgery. 1995;37:294–302. doi: 10.1097/00006123-199508000-00015. [DOI] [PubMed] [Google Scholar]
- Giese A, Loo M.A, Tran N, Haskett D, Coons S.W, Berens M.E. Dichotomy of astrocytoma migration and proliferation. Int. J. Cancer. 1996;67:275–282. doi: 10.1002/(SICI)1097-0215(19960717)67:2%3C275::AID-IJC20%3E3.0.CO;2-9. [DOI] [PubMed] [Google Scholar]
- Giese A, Bjerkvig R, Berens M.E, Westphal M. Cost of migration: invasion of malignant gliomas and implications for treatment. J. Clin. Oncol. 2003;21:1624–1636. doi: 10.1200/JCO.2003.05.063. [DOI] [PubMed] [Google Scholar]
- Knott J.C, Mahesparan R, Garcia-Cabrera I, Bolge Tysnes B, Edvardsen K, Ness G.O, Mork S, Lund-Johansen M, Bjerkvig R. Stimulation of extracellular matrix components in the normal brain by invading glioma cells. Int. J. Cancer. 1998;75:864–872. doi: 10.1002/(SICI)1097-0215(19980316)75:6%3C864::AID-IJC8%3E3.0.CO;2-T. [DOI] [PubMed] [Google Scholar]
- Lamszus K, Brockmann M.A, Eckerich C, Bohlen P, May C, Mangold U, Fillbrandt R, Westphal M. Inhibition of glioblastoma angiogenesis and invasion by combined treatments directed against vascular endothelial growth factor receptor-2, epidermal growth factor receptor, and vascular endothelial-cadherin. Clin. Cancer Res. 2005;11:4934–4940. doi: 10.1158/1078-0432.CCR-04-2270. [DOI] [PubMed] [Google Scholar]
- Lin J.H, et al. Connexin 43 enhances the adhesivity and mediates the invasion of malignant glioma cells. J. Neurosci. 2002;23:4302–4311. doi: 10.1523/JNEUROSCI.22-11-04302.2002. [DOI] [PMC free article] [PubMed] [Google Scholar]
- Mahesparan R, Tysnes B.B, Read T.A, Enger P.O, Bjerkvig R, Lund-Johansen M. Extracellular matrix-induced cell migration from glioblastoma biopsy specimens in vitro. Acta Neuropathol. (Berl) 1999;97:231–239. doi: 10.1007/s004010050979. [DOI] [PubMed] [Google Scholar]
- McDonough W.S, Johansson A, Joffee H, Giese A, Berens M.E. Gap junction intercellular communication in gliomas is inversely related to cell motility Int. J. Dev. Neurosci. 1999;17:601–611. doi: 10.1016/S0736-5748(99)00024-6. [DOI] [PubMed] [Google Scholar]
- Oliveira R, Christov C, Guillamo J.S, de Bouard S, Palfi S, Venance L, Tardy M, Peschanski M. Contribution of gap junctional communication between tumor cells and astroglia to the invasion of the brain parenchyma by human glioblastomas. BMC Cell Biol. 2005;6:7–24. doi: 10.1186/1471-2121-6-7. [DOI] [PMC free article] [PubMed] [Google Scholar]
- Puchner M.J, Herrmann H.D, Berger J, Cristante L. Surgery, tamoxifen, carboplatin, and radiotherapy in the treatment of newly diagnosed glioblastoma patients. J. Neurooncol. 2000;49:147–155. doi: 10.1023/A:1026533016912. [DOI] [PubMed] [Google Scholar]
- Yeager M, Nicholson B.J. Structure of gap junction intercellular channels. Curr. Opin. Struct. Biol. 1996;6:183–192. doi: 10.1016/S0959-440X(96)80073-X. [DOI] [PubMed] [Google Scholar]
- Zhang W, Couldwell W.T, Simard M.F, Song H, Lin J.H, Nedergaard M. Direct gap junction communication between malignant glioma cells and astrocytes. Cancer Res. 1999;59:1994–2003. [PubMed] [Google Scholar]
- Zhang W, Nwagwu C, Le D.M, Yong V.W, Song H, Couldwell W.T. Increased invasive capacity of connexin43-overexpressing malignant glioma cells. J. Neurosurg. 2003;99:1039–1046. doi: 10.3171/jns.2003.99.6.1039. [DOI] [PubMed] [Google Scholar]


