

Abstract
It is often anticipated that two-photon excitation (TPE) laser scanning microscopy should improve cell survival and tissue penetration relative to conventional one-photon excitation (OPE) confocal scanning laser microscopy (CLSM). However few studies have directly compared live cell imaging using one- vs two-photon laser scanning microscopy. We have used calcein-loaded in situ chondrocytes within cartilage as a model for quantitatively comparing these techniques. TPE reduced photo-bleaching and improved cell viability compared to OPE. Using improved detection sensitivity coupled with increased tissue penetration of the near infra-red TPE laser, it was possible to capture images deeper within the cartilage. However, the advantages of TPE vs OPE were strongly dependent on excitation wavelength. We conclude that optimising TPE conditions is essential if the full benefits of this approach are to be realised.
Keywords: 2 photon, two photon, non-linear, multiphoton, two-photon laser scanning microscopy, confocal laser microscopy, confocal laser scanning microscopy, articular cartilage, chondrocyte, cell viability, volume regulation, regulatory volume decrease, image depth, photo-toxicity, photo-bleaching
2. INTRODUCTION
The introduction of two-photon laser scanning microscopy to live cell imaging suggested advantages of improved cell viability and reduced fluorophore bleaching (1, 2). Subsequent studies indicated increased imaging depth for TPE laser scanning microscopy (3, 4) over more conventional OPE CLSM. While few studies have made direct comparisons between TPE and OPE CLSM (2, 3, 5, 6), the principles and rules governing TPE and the basis of the proposed improvements in cell imaging have been extensively reported (1, 7-13). Briefly, fluorochrome excitation with TPE is restricted to the objective lens focal volume, obviating the need for a confocal aperture required by CLSM to filter ‘out-of-focus’ background light. In the absence of background light being generated, the emission light is permitted to bypass the confocal de-scanned detection pathway. A properly implemented non-descanned detection (NDD) design can therefore improve system detection sensitivity. Increased sensitivity, together with reduced scattering and absorption of the longer wavelength excitation beam should also result in improved imaging deeper into tissue (3, 4). The localized excitation volume and increased sensitivity may reduce photo-bleaching and photo-damage, with improvements expected in cell viability. The main drawback is the cost, specifically that of a pulsed (mode-locked) near-infra red (NIR) laser (∼£100,000), needed to provide a light source intense enough for adequate TPE events for image times of ∼1s.
Data that compare TPE with OPE show advantages, but these studies have examined the effect of limited excitation wavelengths. In a classic study (2), 1047nm was employed for the long-term imaging of developing hamster embryos. TPE imaging for 24hrs did not inhibit cell division. Indeed the near infra-red (NIR) laser-exposed embryo subsequently implanted into a recipient female, resulted in a successful birth (2). This was in contrast to 8hrs of visible laser confocal imaging of unstained embryos which inhibited cell division and arrested subsequent embryo development. Similarly, an improvement in cell viability with 710nm TPE was also shown when compared to 352nm confocal imaging (5). For imaging depth comparisons, a 1047nm laser was used to demonstrate a doubling of imaging depth with TPE compared to 488nm confocal imaging (3). TPE advantages over OPE were not obvious without minimising the NIR exposure and optimizing NDD system sensitivity (6).
Conventional OPE CLSM has long helped researchers to study cells within connective tissues (see (11)). These tissues are ideally suited for cell visualization, as cell density is relatively low and the cells are clearly visible against the extra-cellular matrix (14-16) which shows little auto-fluorescence at low laser powers. The proposed advantages of TPE over OPE CLSM should allow deeper imaging into the tissue, whilst retaining cell viability. Chondrocytes comprise ∼5% of articular cartilage (17) but are wholly responsible for extra-cellular matrix turnover. Relatively little is known of in situ chondrocyte physiology in either healthy or degenerate cartilage, but the volume, morphology and volume regulation of a subset of these cells (18, 19) may play a role in the initiation / progression of osteoarthritis. Although it is tempting to study the physiology of chondrocytes isolated from their native extra-cellular matrix, this exposes them to changes in e.g. ion concentrations and osmolarity, consequently altering chondrocyte behaviour (15). The advent of CLSM allowed researchers to study these cells in situ with obvious advantages for understanding their physiology. However the rate of intracellular fluorophore bleaching and sensitivity of the cells after repeated exposure to OPE limited the period of visualization possible. TPE laser scanning microscopy should improve the time course during which the cells can be safely studied, and the ability to image chondrocytes deeper within the tissue, removed from possible artifacts at cut surfaces (20). Initial two-photon laser scanning microscopy work in our laboratory proved promising, but it soon became clear the advantages associated with this technique were subtle and dependent upon the TPE wavelength used.
A number of studies address the effect of TPE on cellular viability and the importance of excitation wavelength (21). However to our knowledge, no quantitative study has been performed comparing the properties of OPE vs TPE over the tunable range (720-980nm) of commonly-used near infra-red (NIR) pulsed lasers attached to commercially-available two-photon laser scanning microscopy systems using standard visible wavelength excited fluorophores. For instance, the hamster embryo survival study (2) used 1047nm TPE excitation, which is outside the range of standard Ti:sapphire lasers. Additionally, reports highlighting TPE microscopy improvements in sensitivity and depth of imaging have used systems equipped with non-standard detection systems (3, 22). In the present report, we investigated the wavelength dependence of two-photon laser scanning microscopy to determine the advantages relative to single (i.e. OPE) 488nm CLSM for our Zeiss 510NLO (non-linear optics) system. Using intracellular calcein as the fluorophore, we compared cell viability, fluorophore photo-bleaching, and image contrast with image depth. The results showed that both non-de-scanned detection (NDD) and non-NDD TPE offered some advantages compared to confocal imaging, as demonstrated by tracking volume changes of in situ chondrocytes in response to a hypo-osmotic challenge, and their subsequent regulatory volume decrease (RVD). We also highlighted problems associated with TPE, and the importance of choosing an optimum TPE wavelength for a particular application and instrument. The imaging benefits of TPE exhibit clear wavelength dependence, and in some cases TPE proved detrimental to live cell imaging. Hence, for a specific application that would theoretically appear to favour two-photon laser scanning microscopy, careful consideration and examination of the apparent advantages need to be assessed when using standard commercial CLSM systems.
3. MATERIALS AND METHODS
3.1 Biochemicals and solutions
Calcein-AM and propidium iodide (PI) were obtained from Cambridge Bioscience, Cambridge, U.K. and stock solutions of each made to 1mM with dimethylsulphoxide (DMSO) or water respectively. The standard tissue culture medium was serum- and phenol red-free Dulbecco’s modified Eagle’s medium buffered with (N-[2-hydroxyethylpiperazine-N’-[2-ethanesulphonic acid]; HEPES; 10mM); 280mOsm.kg-1 H2O; pH 7.4; see (14), all purchased from the Sigma-Aldrich Co. Ltd. (Gillingham, U.K.). Media of 180mOsm were obtained using HEPES-buffered water and checked using a freezing-point Micro Osmometer Model 3300 (Advanced Instruments, U.S.A.).
3.2. Cartilage preparation
Full depth, bovine articular cartilage explants were removed under aseptic conditions with underlying bone attached from the metacarpal-phalangeal joint of cattle (∼30mths) obtained from the local abattoir (14). Explants were maintained at 37°C and pH 7.4 in culture medium until required. Care was taken to standardize the tissue by sampling from the same distinct load-bearing anatomical region of all joints. Samples were incubated with calcein-AM (5μM, 30mins at 37°C) to load the cells with the fluorescent dye calcein. PI, if required, was added to media to a final concentration of 5μM. Tissue was then attached to the base of a 35mm plastic culture dish using cyano-acrylate glue applied to a point distant from that being observed. Explants were mounted transversely so that cells within the superficial through to the deep zones of cartilage could be imaged.
3.3. Excitation spectrum of intracellular calcein
The ability of calcein within in situ chondrocytes to interact with two-photons of a particular wavelength is determined by a spatial and temporal relationship (cross section area; cm4.s/photon), and was measured on a Bio-Rad Radiance 2100MP multi-photon/laser scanning unit (Carl Zeiss Ltd., Herts., UK) attached to a Nikon E600FN upright microscope (Nikon Ltd., Surrey, UK) using a Nikon 60x/1.0NA ceramic water-dipping objective. Two-photon excitation was provided by a Chameleon® titanium-sapphire NIR tuneable laser (Coherent Inc., CA, U.S.A.). This system was utilised because automated spectral acquisitions were controlled by custom Visual Basic scripts within LaserSharp software (John Dempster, University of Strathclyde). The laser beam was attenuated with an electro-optical modulator (model 350-50-02-BK, ConOptics) and the system calibrated and controlled by the script to maintain 5mW average power at the sample plane over the range of 720-950nm in 10nm intervals. Calcein fluorescence was detected using non-de-scanned detectors (emission from 500-550nm) and the TPE fluorescence cross-sections were obtained from the mean fluorescence at each wavelength, normalised by the wavelength and sample pulse duration (Carpe, APE, Berlin, Germany) (23).
3.4. Zeiss LSM510 NLO/Coherent Verdi Mira imaging system
An upright Zeiss Axioskop LSM510 NLO (Carl Zeiss Ltd., Welwyn Garden City, Herts, UK) laser scanning microscope with visible and NIR pulsed excitation sources was used to acquire fluorescent images of in situ calcein-loaded, mid-zone chondrocytes with a C-Apochromat 63x/0.95NA ceramic water-dipping objective. The system employed is shown diagrammatically in Figure 1.
Figure 1.

A schematic representation of the Coherent Verdi/Mira NIR pulsed laser and Zeiss LSM510 NLO system used in this study. The 10W pump power of the Verdi laser gave adequate multi-photon pulsed beam power so that it could be split equally between both an upright and inverted microscope (this mirror was removed to give full laser power for the imaging depth comparison of chondrocytes). Note that ∼4% of the beam was bled off to a laser diagnostic unit. The Mira Ti:Sapphire pulsed laser was manually tuned to the required wavelength and the laser power further refined using an acousto-optical modulator. The MP NIR pulsed-laser beam and 488nm visible laser were directed into the Zeiss scanning module directly, and through a fibre optic cable respectively. The modifications from a standard CLSM included specially coated IR mirrors within the scanning system, and the use of NDD to collect scattered light when using TPE. The signals from the photomultipliers in both the de-scanned (internal) and non-de-scanned detectors were then passed to and collated on a personal computer.
Visible wavelength imaging of calcein (EXmax = 494nm, EMmax = 517nm) was performed using a 488nm argon laser, and fluorescence detected using internal (de-scanned) detectors, with the light passing through a 500-550nm band pass filter. When required, simultaneous imaging of PI (EXmax = 536nm, EMmax = 617nm) was performed by adding a helium/neon 543nm laser, fluorescence being detected through a long pass 560nm filter. Confocal pinholes in front of each detector were set to 1 Airy unit.
Two-photon excitation was provided by a 10W Verdi/Mira manually tunable (range 700-1000nm) NIR pulsed titanium-sapphire laser (Coherent Inc., CA, U.S.A.). The maximal ability of our system to elicit calcein fluorescence was determined by measuring the ‘at sample’ power (LaserCheck, Coherent Inc., CA, U.S.A.) over the range 720-920nm. Detection of calcein and PI fluorescence was performed using either internal detectors (as for the visible excitation protocol described above, except that detector pinhole diameters were opened to their maximum of 1000μm), or using NDDs. The NDD system employed two detectors that share the epi-fluorescent excitation path of the microscope. All manual epi-fluorescence irises were left fully open and neutral density filters removed during NDD detection. The fluorescence emission light was diverted from the scanning unit and directed towards the ‘non-de-scanned’ photomultipliers. The NDD unit comprised a 560nm chromatic reflector with 500-550nm and 575-640nm band pass filters for calcein and PI, respectively. The emission light path for TPE routinely contained a BG39 filter to block any reflected NIR light.
3.5. In situ chondrocyte viability
Cell death was identified by morphological changes (non-osmotically induced swelling), a rapid loss of calcein fluorescence. In cells where calcein fluorescence was low due to photo-bleaching, the additional reduction in calcein signal associated with cell death was difficult to visualise. In such cases, two further methods of cell viability were employed. Firstly, the visualization of cell morphology, showed an increase in diameter just prior to loss of calcein. Secondly, PI, which is impermeable to viable cells, only fluoresces once bound to nucleic acids of cells with a compromised plasma membrane. Calcein in conjunction with analogues of ethidium iodides are common assays of cell viability (24). A range of TPE wavelengths was employed (720-960nm) to compare cell viability with 488nm OPE exposure.
To standardize imaging protocols under different excitation wavelength conditions, detector sensitivity voltage was kept constant and image brightness between samples adjusted by altering excitation laser power, thereby maintaining a consistent level of calcein fluorescence. Due to the longevity of cells under certain excitation wavelengths, and also to achieve differential levels of cell death over a 30min time course, a relatively low detector gain of 500V was used, which subsequently required greater laser power. The requisite image intensity was achieved when the brightest cells in the field of view exhibited a maximum grey scale intensity of 250-254 (8-bit grey scale 0-255), thus avoiding pixel saturation. Care was taken to minimize the exposure of cells to laser light during set-up. Image acquisition was performed using a digitisation of 512×512 pixels (area ≈146μm2). Line scans were averaged 4x with each frame taking ≈4secs to complete. Image acquisition was stopped after all the cells in the field of view had either died or been exposed to a minimum of 30 minutes of continuous exposure.
3.6. Imaging of chondrocytes deep within cartilage
In situ chondrocytes were loaded with calcein as described above. Protocols for calcein-loaded chondrocytes deep in cartilage were similar to those used for assessment of cell viability, however for these measurements, PI was not present in the culture medium. In addition, unlike the protocols for measuring cell viability, optimum imaging (i.e. the best possible contrast between cell and background) was achieved by adjusting both detector sensitivity and laser power which was increased to offset loss of signal with imaging depth. For the maximum possible laser power at our disposal, the splitting mirror (see Figure 1, normally used to divide the NIR laser between inverted and upright microscope systems) was removed. A maximum detector gain of 750V was used, as higher voltages resulted in an unacceptable level of image noise. Images were acquired at 30 m depth intervals from the cut surface using internal de-scanned (confocal path) detectors and the NDDs at wavelengths between 720 and 960nm with 40nm intervals. Similarly, 488nm confocal images were obtained using the same protocols with the confocal path pinhole set for 1 Airy disk.
3.7. Measurement of in situ chondrocyte volume and volume regulation
Images of calcein-loaded in situ chondrocytes were acquired using a scanning speed of ∼1.2Hz with double frame integration for a 512x512 pixel image (see above). At each time point, ∼30x serial images were acquired using 1μm z-sectioning. Following the acquisition of images for resting cell volumes, media were changed from 280 to 180mOsm by manual aspiration with the decrease in osmolarity complete in <15secs. Subsequent time-lapse images were then acquired 10secs after the media change and repeated every 60secs over a 30min period. This protocol was performed for 488nm OPE and compared with 800nm TPE and NDD detection.
3.8. Image analysis
3.8.1 In situ chondrocyte volume estimation
OPE and TPE data sets, correctly acquired, can provide 3D information that can be reconstructed using imaging software to provide quantitative volumetric data of in situ chondrocytes (15). A water-dipping objective lens was used to reduce spherical aberrations (25). The sample refractive index was assumed to be close to water, thus no adjustments were made for an actual focal plane relative to the mechanical (focus motor) focal plane.
To correctly determine the volume of an object, the edge of the cell must be determined accurately. This was achieved using a threshold segmentation method. Individual cells were ‘isolated’ as regions of interest and a 40 or 45% threshold (for OPE or TPE respectively) used to identify the boundary between the cell (foreground) and matrix (background) using Volocity software (Improvision Inc., MA, U.S.A.). The thresholds used for OPE and TPE were confirmed by calibration using 10.16±0.1μm diameter fluorescent latex beads (Polyscience Inc., U.S.A.).
3.8.2. Calculation of calcein bleaching rate
The continuous scanning of in situ chondrocytes used to determine cell viability also provided data for the measurement of the calcein bleaching rate. The reduction in dye fluorescence was obtained by measuring the average fluorescence within a region encompassing the image of individual cells using LSM 5 Image Examiner™ software (Carl Zeiss Ltd., Herts., UK). Average fluorescence was plotted vs time, and half times (min-1) for the reduction in calcein fluorescence were recorded from single exponential decay curves fitted to the data (GraphPad Prism, GraphPad Software Inc., CA, U.S.A.), discarding any points associated with dead/dying cells.
3.8.3. Estimation of contrast measurement with image depth
Assessment of chondrocyte image quality deep into cartilage was performed by measuring the contrast between cell ‘foreground’ and cartilage matrix ‘background’ (signal:background). Quantification was achieved using Zeiss LSM Image Examiner™ software by drawing a line through the longest diameter of the cell and producing an intensity plot profile. The portion of the plot corresponding to the edge of the cell was fitted by linear regression (Excel, Microsoft, U.S.A.) and the gradient (change in fluorescence intensity/m (Dfi/μm)) recorded.
3.9. Data analysis
Data were expressed as means±SD from n cells. Where applicable, means were compared using Student’s unpaired or paired t-tests as appropriate between or within independent experiments respectively.
4. RESULTS
4.1. Fluorescence profile for TPE excitation of intracellular calcein
The relative emission fluorescence of calcein, using constant ‘at sample’ laser power (5mW), over the range of 720-960nm TPE wavelengths is shown in Figure 2. The data for average calcein fluorescence from a single optical section through three chondrocytes in situ varied markedly with NIR excitation wavelength. Maximal emissions were obtained using TPE around 920-930nm, below double the OPE EXmax of 488nm. Additionally, TPE from 720nm to 780nm also elicited strong calcein fluorescence, with a marked reduction from 800nm to 900nm. However, the relative transmission of NIR wavelengths through the Zeiss LSM510 system decreased sharply above 840nm. Therefore, at the measured peak calcein excitation TPE wavelengths, ∼920nm, limited system TPE potential was available at the sample plane.
Figure 2.

Fluorescence spectra of intracellular calcein imaged with TPE (circles). Fluorescence was measured using a Bio-Rad Radiance 2100MP multi-photon/laser scanning unit (Carl Zeiss Ltd., Herts., U.K.) attached to a Nikon E600FN upright microscope using a Nikon 60x/1.0NA ceramic water-dipping objective. TPE was provided by a Chameleon® Ti-sapphire NIR tuneable laser (Coherent Inc., CA, U.S.A.) and adjusted to maintain an ‘at sample’ power of 5mW. In situ chondrocytes were incubated with 5μM calcein-AM (30mins, 37°C). Fluorescence from optical sections through 3 cells was acquired and the cross-sectional area (probability of an interaction between photons and the fluorophore; cm4 .s/photon) was plotted as individual data points with SEM, against TPE wavelength. There are peaks of calcein emission at 730, 770 and 920nm. The relative power ‘at sample’ (arbitrary units) available from our Zeiss LSM510 NLO and Verdi/Mira NIR pulsed laser system fitted with a 63x/0.95NA ceramic water-dipping objective was shown as a red line. Peak sample power occurred at 760nm.
4.2. The effect of OPE vs TPE on in situ chondrocyte viability
Cell death was determined by morphological changes (notably an increase in cell diameter not associated with a change in extra-cellular osmolarity) and also by a rapid loss of calcein fluorescence, over and above calcein bleaching, followed by the appearance of PI fluorescence. An example is shown (Figure 3) for two adjacent cells exposed to continuous 780nm TPE. Figure 3(a) shows images of the cells at 5, 15, 25, and 35mins with intracellular fluorescence plotted vs time (Figure 3(b)). The lower cell survived TPE over the entire time course, with calcein fluorescence bleaching clearly evident. The upper cell exhibited a similar rate of calcein bleaching, but at 20mins showed a further rapid loss of calcein fluorescence with a subsequent appearance of red PI fluorescence confirming cell death.
Figure 3.
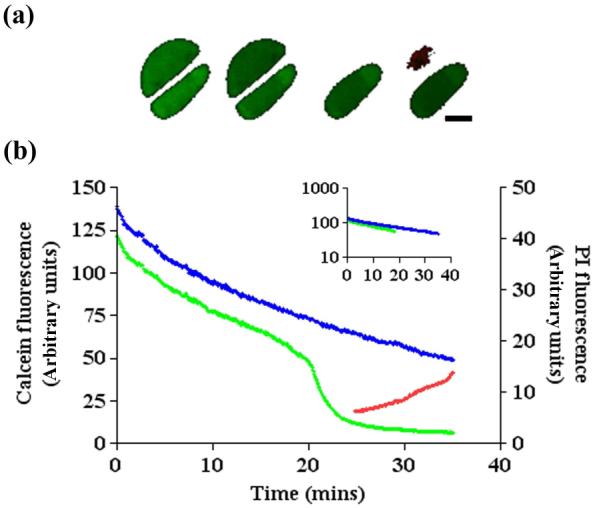
Chondrocyte images and their corresponding intracellular calcein fluorescence generated by repeated one- and two-photon exposure. (a) Single optical sections (760nm TPE) imaged (see Materials and Methods) at 5, 15, 25 and 35mins of adjacent, in situ mid zone bovine articular chondrocytes. Rapid loss of calcein fluorescence was clear in the upper of the two cells at 25mins, followed by increased PI (red) fluorescence of the dead cell nuclei at 35mins. (b) Intracellular fluorescence was plotted for both cells, the upper cell plotted in green, the lower cell in blue. The trace for the upper of the two cells showed a rapid decrease in fluorescence over and above the rate of bleaching, followed by the appearance of PI fluorescence (red line). The decrease in fluorescence associated with calcein bleaching plotted semi-logarithmically (see inset) shows a linear relationship. Scale bar = 5μm.
Table 1 shows the percentage viability and the average time for cell death to occur after 30mins continuous laser exposure. Two of the 14 cells (14%) imaged using 488nm OPE appeared to die, both cells surviving for nearly 30mins. A large reduction in cell viability using 720nm TPE was observed, with 86% of the cells dying over an average exposure time of ∼12mins. TPE at 760nm was adept at reducing cell survival still further, with all cells exposed dying within a few mins. With the TPE wavelength raised to 800nm, chondrocyte survival improved, with no cell death observed at TPE wavelengths of 840nm and above. In other experiments, no cell death was observed with TPE wavelengths above 880nm, even after 60min exposure. The use of NDDs improved sensitivity and hence reduced the laser power required for measurable calcein fluorescence under the TPE conditions employed. Where cell death was observed with de-scanned detection, NDD detection improved cell viability at all wavelengths, but most noticeably at 760nm where cell survival improved from zero to ∼50%. The time for the onset of cell death was also increased using NDDs, particularly at 760nm TPE where it increased from <2 to ∼15mins.
Table 1.
Cell survival (%) following continuous irradiation of 488nm OPE or a range of TPE wavelengths
See Materials and Methods for details. Cell death was identified by morphological changes, a rapid loss of intra-cellular calcein fluorescence (over and above the calcein bleaching rate), and confirmed by subsequent PI fluorescence. The average time taken for cells to die was also given
| % survival (number of cells) | Cell death (mins) | |||
|---|---|---|---|---|
| Exc. Wavelength (nm) | De-scanned | Non de-scanned | De-scanned | Non de-scanned |
| 488 | 86 (14) | - | 27.4 | - |
| 720 | 14 (28) | 48 (21) | 12.5 | 30.3 |
| 760 | 0 (20) | 40 (25) | 1.9 | 14.5 |
| 800 | 88 (26) | 95 (21) | 29.7 | - |
| 840 | 100 (13) | 100 (12) | - | - |
| 880 | 100 (11) | 100 (10) | - | - |
| 920 | 100 (3) | - | - | - |
| 960 | 100 (4) | - | - | - |
4.3. Intracellular calcein bleaching: OPE vs TPE
Calcein bleaching is illustrated for two cells (Figure 3(b)), with the rate being determined by measuring the fluorescence of a ROI encompassing the cell boundary, and plotted vs time. A dramatic loss in fluorescence associated with cell death was omitted from bleaching rate calculations. Half-life constants (t½) of bleaching were derived from the exponential decay line fit (inset of Figure 3) and values plotted (Figure 4). Unexpectedly, because of the numerous factors affecting the rate of bleaching, a single exponential decay curve fitted the data well, as seen for non-mobile fluorescein (26). This was surprising given the majority of intracellular calcein is mobile, hence its use as a cell viability ‘reporter’ with rapid loss occurring when the plasma membrane becomes compromised (27). Double exponential analysis showed no improvement in fit (r2=0.986 and 0.979, single and double decay respectively).
Figure 4.

The bleaching rate (t½) of calcein fluorescence depends on the excitation wavelength (nm). Half times were calculated by fitting data to single exponential decay curves (see Materials and Methods) of intracellular calcein fluorescence bleaching due to continuous laser exposure using OPE 488nm (□) or a range of two-photon NIR wavelengths. TPE fluorescent images were acquired with internal (□) or non-de-scanned external detectors (△) with error bars indicating standard deviations (minimum of 7 cells). TPE wavelengths of 720 and 760nm showed small improvements in t½ compared with 488nm OPE; however, large increases in t½ were observed at TPE wavelengths of 800nm and above. The use of NDDs improved t½ at every TPE wavelength tested.
OPE caused a greater rate of bleaching, however TPE-induced bleaching with wavelengths below 800nm was only marginally better than OPE. TPE bleaching rates were dramatically reduced at 800 and 840nm, while wavelengths >840nm showed no measurable bleaching. Figure 4 also shows the rate of bleaching was not consistent across TPE wavelengths. Bleaching was relatively high for 720 and 760nm TPE, compared to 800 and 840nm. The application of NDD detection further reduced calcein bleaching at all TPE wavelengths. This appeared most pronounced at longer TPE wavelengths, since at 840nm t½ increased by 10mins. However when the improvement afforded by NDD on t½ was analysed in relative terms, 760nm TPE calcein bleaching showed the biggest benefit with t½ lengthening from 0.37 to 6.69mins, a 20x increase.
4.4. Depth of imaging: OPE vs TPE
The ability of different excitation wavelengths to generate intracellular calcein images deep into articular cartilage is shown in Figure 5. Images were acquired at 30μm intervals into the tissue from the cut surface (see Materials and Methods), with the same field of view being imaged with or without NDDs at each TPE wavelength employed. The 488nm OPE images were taken of identical fields of view used for 720nm TPE. Unlike previous protocols, 750V detector gain was used, and to maintain signal:background ratio the laser power was increased as deeper images were acquired.
Figure 5.

Cropped regions of images taken of in situ calcein-loaded articular chondrocytes at increasing image depths (30μm intervals) into cartilage (see Materials and Methods). At each depth and with each wavelength, both laser power and detector sensitivity were optimised to produce an image with the best contrast possible. For TPE the same field of view was imaged using internal ‘de-scanned’ (black) and non-de-scanned detectors (red). OPE (488nm) was as good as or better than TPE images acquired using internal ‘de-scanned’ detectors. Improvements in imaging depth were produced with NDDs, especially at 920nm TPE. The scale bar shown in the top left hand image (488nm, 30μm depth) represented 10 μm.
The depth of imaging possible at varying TPE (Figure 5) was of a similar pattern to that shown for the calcein excitation profile (Figure 2), since the ability of TPE to elicit an image deep into the cartilage was similar to the relative efficiency of TPE to excite intracellular calcein. Surprisingly, OPE 488nm CLSM images produced comparable or better image contrast with depth than all TPE wavelengths used (720-920nm) with de-scanned detection. The use of NDDs improved the depth of imaging possible with all the TPE wavelengths examined, but only 920nm showed a large improvement in imaging depth, from 180□m to 330□m. However the quality of images from deeper within the tissue was very poor.
Our application requires an image of adequate quality to accurately determine cell volume, and this may render the deeper images acquired with TPE unusable. The volume analysis relies upon accurate identification of the edge of a cell, which is dependent upon the contrast between the extra-cellular matrix (background) and chondrocyte (foreground). Hence the greater the contrast between cell fluorescence and extra-cellular matrix, the more accurate the edge detection becomes. Image contrast was determined as defined (see Materials and Methods), the contrast being calculated along a line plotted through the longitudinal axis of each cell imaged at increasing depths into the cartilage. The rate of fluorescence intensity change from inside to outside the cell (Dfi/μm) is plotted in Figure 6 against the OPE or TPE wavelength used, and the depth into cartilage from where the image was acquired. The data plotted as a 3D contour refers to images of cells obtained using NDDs, whereas the data obtained without NDDs are drawn as black lines. TPE of 720, and 840 to 920nm provided the best contrast, but as with all wavelengths used, the contrast decreased quickly with depth.
Figure 6.
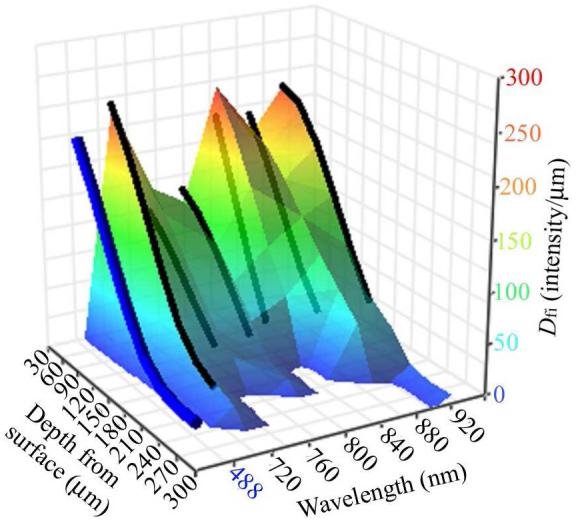
A 3D contour plot of Dfi/μm vs the depth of the acquired image and the wavelength used. Dfi/μm was calculated by measuring the gradient of fluorescence change along a line dawn through the edge of the cell image. The contour was fitted to the data associated with NDD acquired images, with black lines for images acquired using internal, de-scanned detection, while the blue line represents 488nm OPE. A Dfi/μm above ≈75 was required for determination of the cell boundary for volume analysis
To ascertain the minimum contrast required to calculate accurate volumes, a group of in situ cells were imaged using identical scan settings as used for regulatory volume decrease (RVD) experimental protocols (see Materials and Methods). Detector gain was sequentially reduced to mimic a reduction in contrast (data not shown). Subsequent volume analysis indicated that only cells with a contrast >75Dfi/μm resulted in consistent volumes. Cell volume estimates below this value were considered unreliable. Therefore, from curve fit data, only cell images obtained up to a depth of 114 μm using 488nm OPE, and for TPE 165μm (no-NDD) and 174μm (NDD) could reliably be used for quantitative cell volume analysis in our system.
4.5. In situ chondrocyte RVD: comparison of OPE vs TPE
TPE of 760nm provided the greatest ‘at sample’ power for our system and ability to produce calcein fluorescence (Figure 2). However, the detrimental effects on cell viability (Table 1) and calcein bleaching (Figure 4) discounted it from successful frequent imaging protocols. Wavelengths ≥900nm were optimal for eliciting calcein fluorescence (Figure 2), and the best for cell survival (Table 1) and minimal calcein bleaching (Figure 4), the transmission levels to the sample were poor (Figure 2). Hence as a compromise, a TPE wavelength of 800nm was chosen to compare with 488nm OPE.
The response of in situ articular chondrocytes to a hypo-osmotic challenge (280-180mOsm) applied to a cartilage explant is shown in Figure 7. Time-lapse 3D data sets obtained at 60sec intervals (30× 1μm sections, with a 25sec rest period between each 3D acquisition). The projected image from two typical cells exhibiting similar maximum swelling imaged using 800nm (Figure 7(a), upper panel) and 488nm (Figure 7(a), lower panel) at selected time points is shown. The cell imaged using 800nm TPE showed no evidence of calcein bleaching, whereas the cell imaged using 488nm OPE was clearly less bright with time. Measured volumes from each cell at each imaged time point are shown in Figure 7(b). Both excitation protocols reported a significant and equal increase in cell volume on exposure to 180 from 280mOsm and cell volume recovery was subsequently observed. The rate of RVD was identical over initial time points. As the TPE imaged cell continued to show RVD in an expected manner (12), OPE imaging resulted in an increase in apparent RVD behaviour. The cell imaged using OPE apparently showed a reduction of ≈40% from its resting volume. On further inspection, this was due to calcein bleaching reducing the contrast between cell and matrix, the contrast eventually being insufficient to enable an accurate determination of cell volume.
Figure 7.
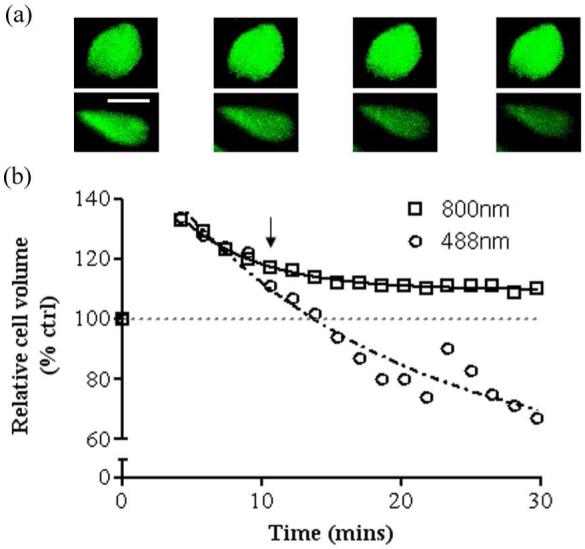
Relative in situ chondrocyte volume following osmotic challenge and subsequent volume recovery, imaged using OPE and TPE. Bovine articular cartilage explants were exposed to a hypo-osmotic challenge (280-180mOsm) and images acquired using 488nm OPE or 800nm TPE (with NDDs). A typical cell from each imaging condition showing near-identical relative swelling, was examined for comparison. (a) Images of in situ, calcein-loaded chondrocytes before, and at 10, 20 and 30mins after hypo-osmotic challenge imaged with either 800nm TPE (upper panels) or 488nm OPE (lower panels). Photo-bleaching was clearly evident in the cell exposed to OPE, whereas the fluorescence of the cell imaged using 800nm TPE remained relatively unchanged. Scale bar = 10μm. (b) The volume of each cell was determined and plotted relative to the initial volume vs time. Hypo-osmotic challenge caused an initial increase in cell volume (≈30%) followed by matched RVD in both cells over the next 3 time points. After the 5th time point (arrow) the 488nm exposed cell appeared to show accelerated RVD compared with TPE. In reality however, the apparent volume decrease was a consequence of rapid calcein bleaching, leading to a poor definition of the membrane edge, resulting in inaccurate volume estimation (see text).
5. DISCUSSION
We have assessed whether there are quantitative advantages offered by an ‘off the shelf’ TPE system over standard OPE CLSM. We found that TPE reduced fluorophore bleaching. However, cell viability and depth of acquisition with adequate image quality were only slightly improved. The benefits of TPE were highly wavelength-dependent, i.e. for cell viability the advantages were more pronounced at longer wavelengths, whereas the ability to elicit strong calcein excitation was only evident using our system at shorter wavelengths.
5.1. TPE of calcein
Calcein fluorescence is widely used for volume and viability measurements (24, 27-29), and is utilised here to compare and optimise TPE and OPE imaging on a commercial system. We present here the TPE profile for calcein (Figure 2). TPE between 910-930nm was most efficient at eliciting calcein fluorescence with TPE of 730-780nm also being effective, a similar profile to the parent compound fluorescein (30, 31).
Whilst calcein TPE fluorescence shown in Figure 2 was obtained with a constant ‘at sample’ power (5mW), the availability of TPE at a given wavelength at the sample plane depends on the laser output and loss of power through the system. The ‘at sample average power’ is very important for TPE where fluorescence intensity increases by the square of the excitation power (26). Manufacturer’s data (Coherent Inc., CA, U.S.A.) show maximal laser power at ∼800nm, but when system transmission is also taken into consideration, a peak ‘at sample’ power of only 8.2mW was recorded at 760nm (Figure 2). The ‘at sample’ power available reduced alarmingly beyond 800nm, and at 900nm reduced to ∼2mW or 1/16th the TPE compared to the sample TPE peak at 760nm. Although our ‘pen-meter’ measurements were not precise, the ‘at sample’ power results are similar to those reported for a near-identical Zeiss LSM510 NLO system fitted with a 40x/1.3NA Plan NeoFluar objective (32). The optimum wavelength for fluorophore excitation in our system (760nm) however, may not reflect the ideal set-up for a particular experiment (see below).
5.2. Rates of calcein bleaching: OPE vs TPE
Whilst OPE produced greater photo-bleaching rates, bleaching rates with TPE varied with the wavelength employed (Figure 4). Fluorescence emission intensity was matched across all TPE wavelengths, therefore TPE induced photo-bleaching was not simply a consequence of the number of fluorophore excitation events. Bleaching rates were considerable at 720 and 760nm TPE, in agreement with a previous study predicting more focal volume bleaching with TPE compared to OPE (26). Bleaching rates were only reduced at the longer TPE wavelengths >800nm. The reason for such high rates of bleaching <800nm was unclear, but not due to variations in the NIR pulse width (26) or subsequent single photon absorption after TPE (33).
Improved photo-stability with ∼800nm TPE has also been demonstrated for Fura-4F in cardiac myocytes using a commercial system and not using NDD (23). The choice of excitation wavelength was important. Reducing laser exposure, by improved detection sensitivity is also key in reducing photo-bleaching (6) as shown by improved photo-stability with the use of NDDs (see section 5.5).
5.3. Comparison of OPE vs TPE on cell viability
Previous studies show TPE illumination can be detrimental to live cell imaging (5, 9, 21, 34-41). However the majority of these studies were examining the effect of total power, pulse width, and exposure time, using few TPE wavelengths. The wavelength dependence of photo-damage shown here, agreed with previous observations of photo-toxicity associated with optical tweezers (21, 40, 41). Eukaryotic cells were most sensitive to TPE of 750-760nm (40, 41) and 900nm (40) during optical trapping. Whilst there may be differences in the reports of longer TPE (>800nm) wavelength dependence of photo-toxicity, the deleterious effects of TPE <800nm are in agreement with our study. We show cell damage at TPE <800nm was more severe than imaging using 488nm OPE, even when NDDs were employed to reduce TPE exposure.
The pattern of TPE wavelength cyto-toxicity dependence is similar to the cross-sectional spectra of endogenous flavoproteins, the TPE of flavonoids NAD(P)H, FAD, and LipDH peak at 700nm with a minimum at ∼800nm (38). The photoreduction of endogenous flavoproteins by TPE liberates free reactive oxygen species (ROS; (42)) which can trigger a cellular cascade, ultimately resulting in death, as shown in PtK2 cells exposed to relatively low levels of TPE illumination (37). The addition of free radical scavengers e.g. catalase (42), ascorbate (43), or trolox (a vitamin E analogue (44)) can limit cell toxicity. For experiments where cell viability is an issue but TPE is preferred, the understanding of photo-toxicity across the range of TPE wavelengths is important.
5.4. Improved tissue depth of imaging by TPE compared to OPE
Reduced tissue absorption and scattering of NIR wavelengths, together with the focal nature of TPE permitting non-confocal detection, should provide imaging deeper within biological specimens compared with OPE. Previous studies appear persuasive but were often obtained using modified systems with bespoke detection devices (3, 45). Whilst our data concur with respect to improved imaging depth, only 920nm TPE with de-scanned detection made marked improvements compared to OPE, and not to the doubling of depth as reported elsewhere (3, 25). This was in part due to the imaging depth (210μm) obtained with 488nm OPE, impressive when compared to the theoretical OPE image maximum of ≈100μm (46). In a comparable study, the image depth obtained in rat cartilage with 488nm OPE of Oregon-green was only 69μm(45).
Whilst 920nm TPE is optimal for calcein fluorescence, it is associated with extremely poor ‘at sample’ power (Figure 2), yet still managed to produce the greatest imaging depth. It is possible that reduced tissue scattering with increased wavelength compensated for poor power availability, the quadratic dependence of two-photon absorption making the process extremely sensitive to the power available. Emitted light may also be subject to tissue scattering, and even with the detector pinhole fully open is still relatively ‘confocal’. Indeed, significant improvements to imaging depth were obtained when NDDs were employed using 920nm TPE (330μm, Figure 5), far exceeding any other TPE wavelength with identical NDD protocols. However, image quality from NDD detection at improved depths was poor. Our analysis protocols require image quality high enough to obtain reliable estimates of cell volume as previously described to determine chondrocyte volume within bovine (14, 15, 28) and human cartilage (16, 19). This thresholding technique loses accuracy if the contrast between cell and background fluorescence is diminished (i.e. reduced signal:background ratio). To provide a measure of S:B, the gradient of fluorescence intensity between cell and extra-cellular matrix was determined (Figure 6). The shallower the gradient, the greater the error in accurate edge detection and hence cell volume estimation. An error of ≈10% in the diameter of a spherical cell will result in error of ≈30% in its volume. This is equivalent to an in situ chondrocyte volume change caused by a 100mOsm dilution in the culture media (15) and could clearly lead to a serious misinterpretation of results. A gradient below ≈75Dfi/μm resulted in poor volume estimation (data not shown). Therefore, for our volume measurements, TPE imaging did offer some advances over OPE. The application of NDDs did little to improve imaging depth further. However, for some applications, images acquired with NDD detection 300□m into cartilage may be adequate for other purposes For example, we have observed potentially important, large abnormal cytoplasmic processes in osteoarthritic human cartilage (16, 47) deep into the tissue using TPE.
5.5. Comparison of ‘de-scanned’ and ‘non-descanned’ detection systems
NDDs improve emission light detection sensitivity by positioning the detectors out of the ‘scanning’ route used for standard CLSM, reducing the mirrors, filters, and the pinhole aperture, each of which reduce the total number of photons reaching de-scanned detectors. Subsequent improved detection sensitivity should enhance cell viability (Table 1), reduce bleaching (Figure 4), and preserve contrast with increased imaging depth (Figures 5-6). However, the improvements we observed were not dramatic. The NDDs of our system, while situated out-with the ‘scanning route’, were not optimally positioned. The NDDs were a long distance from the sample plane, and mirrors/irises in the detection pathway reduced detection sensitivity.
Studies showing dramatic depth of imaging improvements using NDDs tend to have detectors situated directly beneath the objective lens (direct trans-detection), emitted detection used alone (3) or combined with epi-fluorescence NDDs (48). Whilst such systems are becoming commercially available, they tend to be designed for specific applications, and may not be suitable for a multiuser/study facility. Multifunctional turn-key TPE systems tend to be adaptations of existing CLSM configurations with limited redesigns of the optical microscope, reducing the possible placement of NDDs and not optimising the emission detection pathway. Although detector development continually offers improved sensitivity, positioning of NDDs in an optically ‘cleaner’ light path would provide significant improvement in image acquisition and make the purchase of these detectors a valuable addition. Otherwise, the cost would only be appropriate if any small improvement in imaging sensitivity were advantageous.
5.6. Comparison of OPE vs TPE for measuring RVD
In situ chondrocytes were exposed to hypo-osmolarity, initial cell swelling (15) and subsequent volume recovery were almost identical using either OPE or TPE. However, after the 5th image, the volumes determined using the two techniques diverged (Figure 7). Calcein bleaching in cells imaged using OPE, resulted in a reduced S:B ratio and erroneous cell volume estimations. Thus, observations of in situ chondrocyte volume in previous studies were limited to ∼5 time points (14-16, 19), and even less for fragile chondrocytes within degenerate human cartilage (unpublished observations). In contrast, 18 consecutive images over 25mins were obtained using TPE, with the chondrocytes showing the anticipated (14) volume regulatory behaviour of healthy cells.
5.7. Summary
Since 1994 (4) the potential to Life Sciences of an ‘improved’ laser scanning microscope using TPE became possible with the advent of commercially-available solid-state NIR pulsed lasers. Due to the high cost of these systems, a justification of the benefits afforded by TPE over OPE should be demonstrated. For many TPE laser scanning microscopy studies, the proposed improvements of TPE appear justified. However to date there are very few studies that systematically describe these proposed advantages using ‘off the shelf’ equipment.
For our system, and protocols for calcein-loaded in situ chondrocytes, we showed that TPE does offer improvements over 488nm OPE, but the overall picture is complex. The greatest advantage of TPE was the reduction in calcein photo-bleaching and improvement in cell viability at TPE >800nm. This allowed better temporal resolution and permitted more accurate tracking of cell RVD. Whilst the increased image depth was evident, for our purposes the image quality was not of a high enough S:B ratio to allow accurate image processing and would not be a justification for utilising TPE alone.
TPE above 900nm offered optimal calcein fluorescence, the lowest dye bleaching rates, and deepest image acquisition, but the transmission of these longer wavelengths through our system to the sample was poor. Improvements in the NIR transmission spectrum of acousto-optical mudulators are desired. Furthermore the system sensitivity is critical, and reducing the excitation insult to living cells will further improve viability (44) and reduce fluorophore bleaching. Improved positioning of NDDs is required to maximise their potential.
It is clear that optimal imaging conditions are not easy to determine without initial trials being performed. Unfortunately this relies upon having access to a two-photon laser scanning microscopy system and associated staff before deciding whether the outlay is justified. Other techniques made available by focal pulsed excitation, e.g. photolysis of ‘caged’ compounds (49) and fluorescent lifetime imaging (FLIM; 50), may help validate the high system cost.
Hopefully, with more knowledge becoming available, better understanding of specific fluorophores and cell behaviour with TPE, and further refinement of the imaging equipment, the decision of whether to use TPE or OPE for specific applications will become easier.
ACKNOWLEDGMENTS
Supported by the BBSRC (BB/C513985/1) and the Wellcome Trust (075753/Z/04/Z). We also thank Zeiss Ltd. for an Educational grant during which some of this work was performed.
Abbreviations
- 3D
3-dimensional
- AM
Acetoxymethyl
- AOM
Acousto-optical modulator
- CLSM
Confocal laser scanning microscopy
- Dfi
Change in fluorescence intensity
- EMmax
Emission maxima
- EXmax
Excitation maxima
- NA
Numerical aperture
- NDD
Non-descanned detector
- NIR
near infra-red
- NLO
Non linear optics
- OPE
One photon excitation
- RVD
Regulatory volume decrease
- t½
Half-life
- TPE
Two-photon excitation
Footnotes
Publisher's Disclaimer: This is an, un-copyedited, author manuscript that has been accepted for publication in the Frontiers in Bioscience. Cite this article as appearing in the Journal of Frontiers in Bioscience. Full citation can be found by searching the Frontiers in Bioscience (http://bioscience.org/search/authors/htm/search.htm) following publication and at PubMed (http://www.ncbi.nlm.nih.gov/entrez/query.fcgi?CMD=search&DB=pubmed) following indexing. This article may not be duplicated or reproduced, other than for personal use or within the rule of “Fair Use of Copyrighted Materials” (section 107, Title 17, U.S. Code) without permission of the copyright holder, the Frontiers in Bioscience. From the time of acceptance following peer review, the full final copy edited article of this manuscript will be made available at http://www.bioscience.org/. The Frontiers in Bioscience disclaims any responsibility or liability for errors or omissions in this version of the un-copyedited manuscript or in any version derived from it by the National Institutes of Health or other parties.
7. REFERENCES
- 1.Denk W, Strickler JH, Webb WW. 2-Photon Laser Scanning Fluorescence Microscopy. Science. 1990;248:73–76. doi: 10.1126/science.2321027. [DOI] [PubMed] [Google Scholar]
- 2.Squirrell JM, Wokosin DL, White JG, Bavister BD. Long-term two-photon fluorescence imaging of mammalian embryos without compromising viability. Nat Biotechnol. 1999;17:763–767. doi: 10.1038/11698. [DOI] [PMC free article] [PubMed] [Google Scholar]
- 3.Centonze VE, White JG. Multiphoton excitation provides optical sections from deeper within scattering specimens than confocal imaging. Biophys J. 1998;75:2015–2024. doi: 10.1016/S0006-3495(98)77643-X. [DOI] [PMC free article] [PubMed] [Google Scholar]
- 4.Denk W, Delaney KR, Gelperin A, Kleinfeld D, Strowbridge BW, Tank DW, Yuste R. Anatomical and functional imaging of neurons using 2-photon laser scanning microscopy. J Neurosci Methods. 1994;54:151–162. doi: 10.1016/0165-0270(94)90189-9. [DOI] [PubMed] [Google Scholar]
- 5.Sako Y, Sekihata A, Yanagisawa Y, Yamamoto M, Shimada Y, Ozaki K, Kusumi A. Comparison of two-photon excitation laser scanning microscopy with UV-confocal laser scanning microscopy in three-dimensional calcium imaging using the fluorescence indicator Indo-1. J Microsc. 1997;185:9–20. doi: 10.1046/j.1365-2818.1997.1480707.x. [DOI] [PubMed] [Google Scholar]
- 6.Drummond DR, Carter N, Cross RA. Multiphoton versus confocal high resolution z-sectioning of enhanced green fluorescent microtubules: increased multiphoton photobleaching within the focal plane can be compensated using a Pockels cell and dual widefield detectors. J Microsc. 2002;206:161–169. doi: 10.1046/j.1365-2818.2002.01024.x. [DOI] [PubMed] [Google Scholar]
- 7.Brakenhoff GJ, Squier J, Norris T, Bliton AC, Wade MH, Athey B. Real-time two-photon confocal microscopy using a femtosecond, amplified Ti:sapphire system. J Microsc. 1996;181(Pt 3):253–259. doi: 10.1046/j.1365-2818.1996.97379.x. [DOI] [PubMed] [Google Scholar]
- 8.Potter SM. Vital imaging: Two photons are better than one. Current Biology. 1996;6:1595–1598. doi: 10.1016/s0960-9822(02)70782-3. [DOI] [PubMed] [Google Scholar]
- 9.Konig K. Multiphoton microscopy in life sciences. J Microsc. 2000;200:83–104. doi: 10.1046/j.1365-2818.2000.00738.x. [DOI] [PubMed] [Google Scholar]
- 10.White N, Errington R. Multi-Photon Microscopy: Seeing More by Imaging Less. BioTechniques. 2002;33:298–305. doi: 10.2144/02332bi01. [DOI] [PubMed] [Google Scholar]
- 11.Jones CW, Smolinski D, Keogh A, Kirk TB, Zheng MH. Confocal laser scanning microscopy in orthopaedic research. Prog Histochem Cytochem. 2005;40:1–71. doi: 10.1016/j.proghi.2005.02.001. [DOI] [PubMed] [Google Scholar]
- 12.Niggli E, Egger M. Applications of multi-photon microscopy in cell physiology. Front Biosci. 2004;9:1598–1610. doi: 10.2741/1353. [DOI] [PubMed] [Google Scholar]
- 13.Denk W, Piston D, Webb WW. Two-photon molecular excitation in laser-scanning fluorescence microscopy. In: Pawley JB, editor. Handbook of Biological Confocal Microscopy. Plenum Press; New York: 1995. [Google Scholar]
- 14.Bush PG, Hall AC. Regulatory volume decrease (RVD) by isolated and in situ bovine articular chondrocytes. J Cell Physiol. 2001;187:304–314. doi: 10.1002/jcp.1077. [DOI] [PubMed] [Google Scholar]
- 15.Bush PG, Hall AC. The osmotic sensitivity of isolated and in situ bovine articular chondrocytes. J Orthop Res. 2001;19:768–778. doi: 10.1016/S0736-0266(01)00013-4. [DOI] [PubMed] [Google Scholar]
- 16.Bush PG, Hall AC. The volume and morphology of chondrocytes within non-degenerate and degenerate human articular cartilage. Osteoarth Cartilage. 2003;11:242–251. doi: 10.1016/s1063-4584(02)00369-2. [DOI] [PubMed] [Google Scholar]
- 17.Stockwell RA. Biology of cartilage cells. Cambridge University Press; Cambridge: 1979. [Google Scholar]
- 18.Sandell LJ, Aigner T. Articular cartilage and changes in arthritis. An introduction: cell biology of osteoarthritis. Arthritis Res. 2001;3:107–113. doi: 10.1186/ar148. [DOI] [PMC free article] [PubMed] [Google Scholar]
- 19.Bush PG, Hall AC. Passive osmotic properties of in situ human articular chondrocytes within non-degenerate and degenerate cartilage. J Cell Physiol. 2005;204:309–319. doi: 10.1002/jcp.20294. [DOI] [PubMed] [Google Scholar]
- 20.Huntley JS, Bush PG, McBirnie JM, Simpson AH, Hall AC. Chondrocyte death associated with human femoral osteochondral harvest as performed for mosaicplasty. J Bone Joint Surg Am. 2005;87A:351–360. doi: 10.2106/JBJS.D.02086. [DOI] [PubMed] [Google Scholar]
- 21.Neuman KC, Chadd EH, Liou GF, Bergman K, Block SM. Characterization of photodamage to Escherichia coli in optical traps. Biophys J. 1999;77:2856–2863. doi: 10.1016/S0006-3495(99)77117-1. [DOI] [PMC free article] [PubMed] [Google Scholar]
- 22.Dumas D, Grossin L, Cauchois G, Gentils M, Santus R, Stoltz JF. Comparison of wide-field/deconvolution and confocal microscopy in bioengineering. Interest of multi-photon microscopy in the study of articular cartilage. Biorheology. 2003;40:253–259. [PubMed] [Google Scholar]
- 23.Wokosin DL, Loughrey CM, Smith GL. Characterization of a range of fura dyes with two-photon excitation. Biophys J. 2004;86:1726–1738. doi: 10.1016/S0006-3495(04)74241-1. [DOI] [PMC free article] [PubMed] [Google Scholar]
- 24.Decherchi P, Cochard P, Gauthier P. Dual staining assessment of Schwann cell viability within whole peripheral nerves using calcein-AM and ethidium homodimer. J Neurosci Methods. 1997;71:205–213. doi: 10.1016/s0165-0270(96)00146-x. [DOI] [PubMed] [Google Scholar]
- 25.Gerritsen HC, De Grauw CJ. Imaging of optically thick specimen using two-photon excitation microscopy. Microsc Res Tech. 1999;47:206–209. doi: 10.1002/(SICI)1097-0029(19991101)47:3<206::AID-JEMT6>3.0.CO;2-H. [DOI] [PubMed] [Google Scholar]
- 26.Patterson GH, Piston DW. Photobleaching in two-photon excitation microscopy. Biophys J. 2000;78:2159–2162. doi: 10.1016/S0006-3495(00)76762-2. [DOI] [PMC free article] [PubMed] [Google Scholar]
- 27.Altamirano J, Brodwick MS, Alvarez-Leefmans FJ. Regulatory volume decrease and intracellular Ca2+ in murine neuroblastoma cells studied with fluorescent probes. J Gen Physiol. 1998;112:145–160. doi: 10.1085/jgp.112.2.145. [DOI] [PMC free article] [PubMed] [Google Scholar]
- 28.Bush PG, Hodkinson PD, Hamilton GL, Hall AC. Viability and volume of in situ bovine articular chondrocytes - changes following a single impact and effects of medium osmolarity. Osteoarth Cartilage. 2005;13:54–65. doi: 10.1016/j.joca.2004.10.007. [DOI] [PubMed] [Google Scholar]
- 29.Haskew-Layton RE, Mongin AA, Kimelberg HK. Hydrogen peroxide potentiates volume-sensitive excitatory amino acid release via a mechanism involving Ca2+/calmodulin-dependent protein kinase II. J Biol Chem. 2005;280:3548–3554. doi: 10.1074/jbc.M409803200. [DOI] [PubMed] [Google Scholar]
- 30.Xu C, Zipfel W, Shear JB, Williams RM, Webb WW. Multiphoton fluorescence excitation: new spectral windows for biological nonlinear microscopy. Proc Natl Acad Sci USA. 1996;93:10763–10768. doi: 10.1073/pnas.93.20.10763. [DOI] [PMC free article] [PubMed] [Google Scholar]
- 31.Xu C, Webb WW. Measurement of two-photon excitation cross sections of molecular fluorophores with data from 690 to 1050 nm. J Opt Soc Am B. 1996;13:481–491. [Google Scholar]
- 32.Dickinson ME, Simbuerger E, Zimmermann B, Waters CW, Fraser SE. Multiphoton excitation spectra in biological samples. J Biomed Opt. 2003;8:329–338. doi: 10.1117/1.1583734. [DOI] [PubMed] [Google Scholar]
- 33.Widengren J, Rigler R. Mechanisms of photobleaching investigated by fluorescence correlation spectroscopy. Bioimaging. 1996;4:149–157. [Google Scholar]
- 34.Koester HJ, Baur D, Uhl R, Hell SW. Ca2+ fluorescence imaging with pico- and femtosecond two-photon excitation: signal and photodamage. Biophys J. 1999;77:2226–2236. doi: 10.1016/S0006-3495(99)77063-3. [DOI] [PMC free article] [PubMed] [Google Scholar]
- 35.Cheng P, Lin B, Kao F, Gu M, Xu M, Gan X, Huang M, Wang Y. Multi-photon fluorescence microscopy--the response of plant cells to high intensity illumination. Micron. 2001;32:661–669. doi: 10.1016/s0968-4328(00)00068-8. [DOI] [PubMed] [Google Scholar]
- 36.Hopt A, Neher E. Highly nonlinear photodamage in two-photon fluorescence microscopy. Biophys J. 2001;80:2029–2036. doi: 10.1016/S0006-3495(01)76173-5. [DOI] [PMC free article] [PubMed] [Google Scholar]
- 37.Tirlapur UK, Konig K, Peuckert C, Krieg R, Halbhuber KJ. Femtosecond near-infrared laser pulses elicit generation of reactive oxygen species in mammalian cells leading to apoptosis-like death. Exp Cell Res. 2001;263:88–97. doi: 10.1006/excr.2000.5082. [DOI] [PubMed] [Google Scholar]
- 38.Huang S, Heikal AA, Webb WW. Two-photon fluorescence spectroscopy and microscopy of NAD(P)H and flavoprotein. Biophys J. 2002;82:2811–2825. doi: 10.1016/S0006-3495(02)75621-X. [DOI] [PMC free article] [PubMed] [Google Scholar]
- 39.Garsha K. The effects of femtosecond pulse dispersion pre-compensation on average power damage thresholds for live cell imaging: implications for relative roles of linear and nonlinear absorption in live cell imaging. Proc SPIE Conf. 2003:4963. [Google Scholar]
- 40.Liang H, Vu KT, Krishnan P, Trang TC, Shin D, Kimel S, Berns MW. Wavelength dependence of cell cloning efficiency after optical trapping. Biophys J. 1996;70:1529–1533. doi: 10.1016/S0006-3495(96)79716-3. [DOI] [PMC free article] [PubMed] [Google Scholar]
- 41.Vorobjev IA, Liang H, Wright WH, Berns MW. Optical trapping for chromosome manipulation: a wavelength dependence of induced chromosome bridges. Biophys J. 1993;64:533–5388. doi: 10.1016/S0006-3495(93)81398-5. [DOI] [PMC free article] [PubMed] [Google Scholar]
- 42.Hockberger PE, Skimina TA, Centonze VE, Lavin C, Chu S, Dadras S, Reddy JK, White JG. Activation of flavin-containing oxidases underlies light-induced production of H2O2 in mammalian cells. Proc Natl Acad Sci USA. 1999;96:6255–60. doi: 10.1073/pnas.96.11.6255. [DOI] [PMC free article] [PubMed] [Google Scholar]
- 43.Knight MM, Roberts SR, Lee DA, Bader DL. Live cell imaging using confocal microscopy induces intracellular calcium transients and cell death. Am J Physiol-Cell Ph. 2003;284:C1083–C1089. doi: 10.1152/ajpcell.00276.2002. [DOI] [PubMed] [Google Scholar]
- 44.Sacconi L, Dombeck DA, Webb WW. Overcoming photodamage in second-harmonic generation microscopy: real-time optical recording of neuronal action potentials. Proc Natl Acad Sci USA. 2006;103:3124–9. doi: 10.1073/pnas.0511338103. [DOI] [PMC free article] [PubMed] [Google Scholar]
- 45.Dumas D, Gigant C, Presle N, Cipolletta C, Miralles G, Payan E, Jouzeau JY, Mainard D, Terlain B, Netter P, Stoltz JF. The role of 3D-microscopy in the study of chondrocyte-matrix interaction (alginate bead or sponge, rat femoral head cap, human osteoarthritic cartilage) and pharmacological application. Biorheology. 2000;37:165–176. [PubMed] [Google Scholar]
- 46.Cheong W-F, Prahl SA, Welch AJ. A Review of the Optical Properties of Biological Tissues. IEEE J Quantum Elect. 1990;26:2166–2185. [Google Scholar]
- 47.Bush PG, Huntley JS, Brenkel IJ, Hall AC. The shape of things to come: chondrocytes and osteoarthritis. Clin Invest Med. 2003;26:249–51. [PubMed] [Google Scholar]
- 48.Mainen ZF, Maletic-Savatic M, Shi SH, Hayashi Y, Malinow R, Svoboda K. Two-photon imaging in living brain slices. Methods. 1999;18:231–239. doi: 10.1006/meth.1999.0776. [DOI] [PubMed] [Google Scholar]
- 49.Kiskin NI, Chillingworth R, McCray JA, Piston D, Ogden D. The efficiency of two-photon photolysis of a “caged” fluorophore, o-1-(2-nitrophenyl)ethylpyranine, in relation to photodamage of synaptic terminals. Eur Biophys J. 2002;30:588–604. doi: 10.1007/s00249-001-0187-x. [DOI] [PubMed] [Google Scholar]
- 50.Duncan RR, Bergmann A, Cousin MA, Apps DK, Shipston MJ. Multi-dimensional time-correlated single photon counting (TCSPC) fluorescence lifetime imaging microscopy (FLIM) to detect FRET in cells. J Microsc. 2004;215:1–12. doi: 10.1111/j.0022-2720.2004.01343.x. [DOI] [PMC free article] [PubMed] [Google Scholar]