

Abstract
Circulating free fatty acids are a reflect of the balance between lipogenesis and lipolysis that takes place mainly in adipose tissue. We have found that mice deficient for RGS4 have increased circulating catecholamines, and increased free fatty acids (FFA). Consequently, RGS4−/− mice have increased concentration of circulating free fatty acids, abnormally accumulate fatty acids in liver, resulting in liver steatosis, and show a higher degree of glucose intolerance, and decreased insulin secretion in pancreas. We show in this study that RGS4 controls adipose tissue lipolysis through regulation of the secretion of catecholamines by adrenal glands. RGS4 controls the balance between adipose tissue lipolysis and lipogenesis, secondary to its role in the regulation of catecholamine secretion by adrenal glands. RGS4 could be therefore a good target for the treatment of metabolic diseases.
Keywords: RGS4, lipolysis, catecholamines, liver steatosis, insulin secretion
Introduction
White adipose tissue (WAT) homeostasis implicates a complex regulatory network of signaling and transcriptional events resulting in a coordinated response to external stimuli. Under nutritional profusion, hormonal signaling results in increased energy storage in adipose tissue in form of triglycerides. Under nutritional deprivation stored triglycerides (TAG) are hydrolyzed in adipose tissue, providing free fatty acids (FFA) to other tissues, which act as oxidative substrates to maintain energy requirements. Adipose tissue lipolysis comprises sequential hydrolysis of TAG, resulting in glycerol and non-esterified fatty acids (NEFA), which are released into circulation as FFA to be taken up by other tissues. Adipose tissue lipases, such as hormone-sensitive lipase (HSL), or adipose triglyceride lipase (ATGL), whose activity is hormonally and nutritionally regulated, are the final effectors of TAG hydrolysis. In the postprandial state, insulin levels are increased. Insulin signaling through the PI3K/Akt pathway results in the phosphorylation and subsequent activation of the phosphodiesterase 3B (PDE3B). Activated PDE3B generates AMP from cAMP, resulting in the depletion of cAMP. This releases protein kinase A (PKA) from activation and lipolysis is inhibited through reduction in the phosphorylation-mediated activation of HSL and perilipin (1).
The hypothalamus-pituitary-adrenal (HPA) axis plays a major role in the regulation of fasting-induced lipolysis. During fasting, and in response to hypothalamus-derived stimuli adrenal glands are activated and secrete catecholamines, which are major signaling hormones (2). Catecholamines are the primary activators of fasting-induced lipolysis (1, 3), although postprandial plasma catecholamine concentration may be higher than in the fasting state, indicating increased sympathetic nervous system activity after meals (reviewed in (4)). Upon binding to β-adrenergic receptors, catecholamines increase intracellular cAMP concentration, resulting in the activation of PKA, which phosphorylates and activates HSL. Phosphorylation of HSL results in increased hydrolytic activity, and consequently leads to enhanced TG hydrolysis (1). Other lipases, such as ATGL are also the final effectors of lipolytic signaling in adipocytes (5). Activation of catecholamine release in adrenal glands is mediated by the G-protein coupled receptors (GPCR), such as the acetylcholine (ACh) receptor, which bind a heterotrimeric G-protein complex of α-, β, and γ-subunits. Agonist binding to GPCR receptor promotes G-protein activation by catalyzing GDP-GTP exchange on the α-subunit. GTP-bound α-subunit dissociates from βγsubunits, and regulates downstream effectors. Signaling by GPCR is terminated by the intrinsic GTPase activity of the Gα-subunit, which hydrolyzes bound-GTP to GDP, resulting in the reassociation of the G-protein heterotrimer. Intrinsic GTPase activity is, however insufficient to inactivate G-protein signaling, but the presence of GTPase-activating proteins, such as regulator of G-protein signaling (RGS) accelerate GTPase activity limiting the duration of G-protein activation (6). RGS proteins are therefore negative regulators of G-protein signaling.
RGS4 is a member of the large family of RGS proteins that defines the R4 class of the family, which differentiates from other classes by having the RGS domain simply flanked by N and C-terminal sequences with no specific function other than membrane attachment, and GPCR specificity (reviewed in (7, 8). RGS4 has been suggested to participate in several physiological processes, such as heart hypertrophy in response to hypertension (9), modulation of neurotransmitter receptors in brain (9), calcium signaling in heart and pancreas (10 ), neuronal differentiation (9), or schizophrenia (11). The phenotype of RGS4−/−mice could not demonstrate, however the participation of RGS4 in these processes. Instead, RGS4−/− mice had normal neural development, were viable and fertile. Only small sensory motor deficits, differences in weight, and central integration of painful stimuli were observed in RGS4−/− compared to RGS4+/+ mice (9). Compensation by other RGS family members, or genetic background specificity could mask the analysis of the participation of RGS4 in physiology.
The differences in weight observed in RGS4−/− mice prompted us to investigate the participation of this protein in metabolic processes. We show now that RGS4 controls adipose tissue lipolysis through regulation of the secretion of catecholamines by adrenal glands in response to fasting. RGS4−/− mice have increased concentration of serum catecholamines, increased circulating free fatty acids, accumulation of fatty acids in liver, resulting in liver steatosis, and show a higher degree of glucose intolerance, when mice are fed with high fat diet.
Materials and methods
Animals
Generation of RGS4 −/− mouse line has been previousely described (9). Only male mice were used. Animals were maintained in a temperature-controlled (23°C) facility with a 12 hr light/dark cycle and had access to food and water ad libitum unless indicated otherwise. The control and high-fat diet were obtained from UAR (Villemoisson-sur-Orge, France). This study was conducted according to the local animal ethics board of Institut de Recherche en Cancérologie de Montpellier (IRCM). The number of animals used was n=5 to 8 for wild-type (RGS4+/+) and RGS4 knock-out (RGS4−/−) mice as indicated.
Materials
All chemicals, except if stated otherwise, were purchased from Sigma (St-Louis, Missouri).
RNA isolation, Reverse transcription and quantitative real-time PCR
RNA was extracted with the use of TRI-Reagent (Euromedex, Mundolsheim, France) according to the manufacturers’ recommendations. Reverse transcription of total RNA was performed at 37°C using the M-MLV reverse transcriptase (Invitrogene SARL, France) and random hexanucleotide primers (Promega, Madison, WI), followed by a 15 min inactivation at 70°C. Quantitative PCR was carried out by real-time PCR using a LightCycler and SYBR Green Light Cycler Master Mix (Roche Applied Science, Mannheim, Germany). Results were normalized to rS9 levels. The primers used were as follows: rS9, 5′-CGGCCCGGGAGCTGTTGACG-3′; 5′-CTGCTTGCGGACCCTAATGTGACG-3′; aP2, 5′-AACACCGAGATTTCCTTCAA-3′; 5′-AGTCACGCCTTTCATAACACA-3′; Gpdl, 5′-CGTTGGGGCTGGCTTCTGTGAT-3′; 5′-GCCCCTGTAGCTTCTGCCCATTTA-3′; PEPCK, 5′-GGCCCCGGGAGTCACCATCA-3′; 5′-TGCCGAAGTTGTAGCCGAAGAAG G-3′; RGS4, 5′-GAAGAAGATTTTCAACCT GATGG-3′; 5′-GAACTCTTGGCTCCTTTC TGC-3′.
Cell culture, Retroviral infection, and Oil Red O staining of 3T3L1 cells
3T3-L1 and 293 cells were grown in DMEM supplemented with 10% fetal bovine serum (FBS), 100 U/ml penicillin and 100 µg/ml streptomycin. 3T3-L1 cells were differentiated with DMEM, 10% serum, 0.5 mM 3-Isobutyllmethylxanthine (IBMX), 10 μg/ml insulin, 1 μM dexamethasone and 1 μM rosiglitazone for 2 days. From the day 3 on, cells were incubated with DMEM, 10% serum, 10 μg/ml insulin, and 1 μM rosiglitazone. Oil Red O staining was performed as described (12). Briefly, 3T3L1 cells were grown on coverslips, fixed in 4% formaldehyde in PBS for 15 minutes at 4°C, than stained with Oil Red O for 20 minutes at room temperature. Stock solution of Oil Red O was prepared at 0.5 % in isopropanol, and working solution was prepared at 3:2 ratio Oil Red O/deionized water. Cells were rinsed with deionized water and slides were mounted with Mowiol. For retroviral infection, RGS4 cDNA, purchased from Origene (Rockville, Maryland), was cloned in pBabe Puro vector (cloning details are available upon request). Virus production and infection of 3T3-L1 cells was performed as described previously (13). Infection efficiency was estimated at 90%. Pooled clones were differentiated as described.
Protein expression assays
For protein extraction tissues were homogenized with Lysing Matrix D beeds (MP Biomedicals Europe, Illkirch, France), using a MagNa Lyser instrument (Roche Applied Science, Mannheim, Germany) in a lysis buffer containing 20mM Tris-HCl pH7.4, 137mM NaCl, 1mM MgCl2, 1mM CaCl2, 1mM dithiothreitol, 10% glycerol, 0.5% Nonidet P-40. A protease inhibitor cocktail (Sigma) and phosphatase inhibitors (1mM Na3VO4, 50mM NaF, and 5mM Na4P2O7) were added. Lysates were then centrifuged and the supernatant was recovered. Protein concentrations were determined by Bradford method (Bio-Rad, Hercules, CA). SDS-PAGE and electrotransfer was performed as follows. The membranes were blocked 1h in blocking buffer (PBS, 0,1% Tween-20, 5% skimmed milk). Filters were first incubated overnight at 4°C with pSer563 HSL antibody (Cell Signaling Technology, Danvers, MA) or total HSL antibody (Santa Cruz Biotechnology, Santa Cruz, CA), and then for 1h at room temperature with a peroxidase conjugate secondary antibody. The complex was visualized with enhanced chemiluminescence (ECL) (Interchim, France).
Glucose, insulin, free fatty acid, and catecholamine measurements
For the glucose tolerance tests, mice were fasted overnight (18–20h) and then injected intraperitonneally with 2g/kg (dose/kg body weight) glucose. For the free fatty acid measurement after insulin injection, mice were injected intraperitonneally with 0.75UI/kg after an overnight fast. Blood glucose levels were measured using an Accu Chek Go glucometer (Roche Diagnostics, Mannheim, Germany), free fatty acids (FFA) with NEFA C kit (Wako Chemicals, Neuss, Germany), and serum insulin levels using a Mouse Ultrasensitive Insulin ELISA kit (Mercodia, Uppsala, Sweden). Catecholamines (norepinephrine and epinephrine) were measured in serum collected from mice, and in a secretion medium from acute adrenal slices using a 2-CAT kit (Labor Diagnostica Nord, Nordhorn, Germany).
Lipolysis in vivo
For isoproterenol treatment, mice were fasted for 7 hours and injected intraperitoneally with isoproterenol (10 mg per kg body weight). Blood was collected from the tail before and 15 min after injection. For insulin treatment, mice were fasted over-night (18 hours) and injected IP with insulin (0.75UI per kg body weight). Blood was collected from the tail before and 60 min after injection. Serum was frozen at −20°C. Serum free fatty acids were determined with NEFA C kit (Wako Chemicals, Neuss, Germany).
Adrenal medulla studies
Catecholamine release was measured from adrenal slices. Mice were killed by cervical dislocation. Acute slices were prepared as reported previously (14). Briefly, after removal, the glands were kept in ice-cold saline for 2 min and embedded in a 5% agarose solution (agarose, type IX-A, Sigma). The hardened agar block was then glued with cyanoacrylate onto the stage of a vibratome (DTK-1000, D.S.K, Dosaka EM CO. LTD, Kyoto, Japan). Slices of 150 μm thickness were then cut with a razor blade and transferred to a storage chamber maintained at 37°C, containing Ringer’s saline (in mM): 125 NaCl, 2.5 KCl, 2 CaCl2, 1 MgCl2, 1.25 NaH2PO4, 26 NaHCO3, 12 glucose and buffered to pH 7.4. The saline was continuously bubbled with carbogen (95% O2, 5% CO2). All the slices cutting from a single adrenal were pooled in the same incubation well. Slices were kept for 15 minutes at 37°C, then fresh medium was added and a control pre-stimulation sample was collected. Acetylcholine at 100 μM was then added, aliquots were collected at different time points and stored at −20°C. Catecholamines (norepinephrine and epinephrine) were measured in the secretion medium using a 2-CAT kit (Labor Diagnostica Nord, Nordhorn, Germany). Data were expressed as a ratio per protein and total catecholamine content.
Pancreatic islet studies
Islet isolation and insulin secretion studies were described previously (15). Pancreas was digested by collagenase (3mg/ml) and isolated in oxygenated Krebs-Ringer Buffer (in mM: NaCl, 120; KH2PO4, 4; MgSO4.7H2O, 1 ;CaCl2.2H2O, 0,75; NaHCO3, 10; Hepes, 30; pH 7.4). Islets were equilibrated for 1 hour in presence of 10 mM glucose. Approximately five islets per condition were handpicked and exposed to either 2.8 or 20 mM glucose, in presence or absence of 1 or 10 μM carbachol. Medium containing the released insulin was collected 1 hour later. Total insulin of islets was extracted using acid ethanol (75% EtOH, 0.2M HCl) and measured using a Mouse Ultrasensitive Insulin ELISA kit (Mercodia, Uppsala, Sweden). Total islet protein concentration was determined using Bio-Rad protein assay (Bio-Rad, Hercules, California). Data were expressed as a ratio per protein and total insulin content.
Oil Red O staining of liver
Livers from RGS4+/+ and −/− mice were frozen in OCT, sectioned, post-fixed in 4% formaldehyde for 10 minutes at room temperature, and stained with Oil Red O. Slides were counterstained with hematoxylin (Vector, Burlingame, California).
The β-galactosidase (lacZ) expression assay
Mouse adrenals were collected from RGS4−/− mice and embedded in O.C.T. Embedding Matrix (Cell Path, Newtown, UK). Tissue blocks were sectioned at l0μm thickness, post fixed for 20 min in 2% paraformaldehyde and 0.2% glutaraldehyde, washed in PBS (2x5 min), and incubated overnight at 37°C in freshly prepared X-gal staining buffer, containing 1 mg/ml X-gal (Euromedex, Mundolsheim, France), 5mM potassium ferricyanide, 5mM potassium ferrocyanide, and 2mM MgCl2 in PBS. Tissue sections were rinsed in PBS and counterstained with 0.1% Gurr's Nuclear Fast Red (Gurr's, UK) in 5% aluminium sulfate (A12(SO4)3.15H2O) for 3–5 min. Mounting solution (Dako) and cover slips were added to the sections.
Triglyceride content measurement
For determination of hepatic triglyceride content in RGS+/+ and RGS4−/− mice, liver tissue (50–100 mg) was homogenized for 4 minutes in 2 ml isopropanol with a Polytron disrupter. The homogenate was centrifuged at 2,000g for 10 minutes, and 10 μl of the resulting supernatant were dried with a Speedvac System. The dry residue was dissolved in 5 μl isopropanol, and its triglyceride content was measured with Triglyceride FS kit (Diasys Diagnostic Systems, Holzheim, Germany). For muscle triglycerides, tissue (100–150 mg) was homogenized with Lysing Matrix D beeds (MP Biomedicals Europe, Illkirch, France), using a MagNa Lyser instrument (Roche Applied Science, Mannheim, Germany) in 1 ml isopropanol. The homogenate was centrifuged at 2,000g for 10 minutes, and 20 μl of the resulting supernatant were dried with a Speedvac System. The dry residue was dissolved in 5 μl isopropanol, and then proceeded as for hepatic triglyceride content. All values of tissue triglyceride content were corrected for tissue weight.
Statistical analysis
Data are presented as means ± standard error of the mean (S.E.M). Group means were compared by factorial analysis of variance (ANOVA). Differences were considered statistically significant at p < 0.05.
Results
Increased fasting FFA in RGS4−/− mice and β-agonist-induced lipolysis in adipose tissue of RGS4−/− mice
Previous studies showed decreased body weight in RGS4−/− compared to RGS4+/+ mice, suggesting the implication of RGS4 in adipose tissue biology (9). We therefore first analyzed whole body and relative WAT weights in these mice. No significant differences were observed either in body or in WAT weights (Fig. 1A-B). In contrast, we found consistent and significantly increased circulating fasting FFA in RGS4−/− compared to RGS4+/+ mice, independent of body or WAT weights (Fig. 1C). Since no differences in food intake (data not shown), or in WAT weight (Fig. 1B) could be demonstrated, the increase in circulating FFA observed in RGS4−/− mice suggested impaired WAT metabolism, pointing to abnormal fasting-induced lipolysis. To explore this hypothesis, we analyzed the response of RGS4+/+ and −/− mice to lipolytic stimulation. A 3-fold increase in FFA release, as measured by the concentration of circulating FFA in serum of RGS4+/+ mice was observed in response to the β-adrenergic agonist isoprotenerol (Fig. 1D). Interestingly, RGS4−/− mice, which showed increased FFA basal levels were significantly (p<0.05) less responsive to isoprotenerol compared to RGS4+/+ mice (1.5-fold compared to 3-fold stimulation; Fig. 1D). This suggested that RGS4 is implicated in the response of WAT to lipolytic stimulation. Next, the anti-lipolytic effects of insulin were tested. Insulin administration to fasted RGS4+/+ mice resulted, as expected in a 2.5-fold decrease in circulating FFA (Fig. 1E). An almost identical decrease in circulating FFA levels was observed when RGS4−/− mice were insulin-stimulated (Fig. 1E). These results indicated that the anti-lipolytic mechanisms are not impaired in RGS4−/− mice. Furthermore, increased lipolysis in WAT of RGS4−/− mice was further demonstrated by increased phosphorylation of the rate-limiting lipolytic enzyme, the hormone-sensitive lipase (HSL; Fig. 1F).
FIG 1.
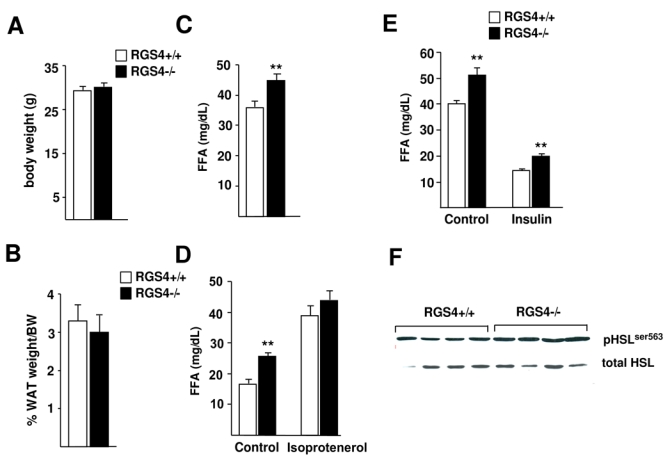
Adipose tissue weight, fatty acid quantification, and in vivo lipolysis analysis in RGS4−/− mice. (A) Body weight of RGS4 +/+ and RGS4 −/− mice (RGS4+/+, n=8; RGS4−/−, n=8) was analyzed at 25 weeks. (B) White adipose tissue (WAT) weight is represented as a percentage of body weight in the same mice. (C) Quantification of serum free fatty acid (FFA) concentration in mice fasted for 16 hours. (D) Isoproterenol-induced in vivo lipolysis in 7 hour-fasted RGS4+/+ (n=6) and RGS4−/− (n=6) mice measured by FFA concentration in serum. Blood serum was collected before (control) and 15 minutes after injection of isoproterenol (10 mg/kg). (E) Analysis of in vivo lipolysis in response to insulin in overnight fasted RGS4+/+ and −/− mice. FFA serum levels were determined before (control) and 60 minutes after intraperitoneal injection of insulin (0,75 UI/kg). (F) Expression of HSL phosphorylated on Ser563 compared to the expression of total HSL was assessed by Western blot. Data are mean ± SEM. Statistically significant differences (ANOVA, p<0.05) are indicated in this, and subsequent figures by an asterisk.
Abnormal fatty liver, hyperinsulinemia, and hyperglycemia in RGS4−/− mice
Increased fasting FFA is a risk factor for fatty liver and insulin resistance. A first interesting observation was the pale appearance of liver from RGS4−/− mice, suggesting increased fat accumulation (Fig. 2A). This was further demonstrated by Oil Red O staining (Fig. 2A) and triglyceride quantification analysis, which showed increased triglyceride content in liver from RGS4−/−, compared to RGS4+/+ mice (Fig. 2B). These differences were further increased when TG content of the livers of high fat diet (HFD)-fed RGS4−/− and +/+ mice were analyzed (Fig. 2B). Lipid accumulation in muscles of RGS4−/− compared to RGS4+/+ mice was also observed in normal fed mice (Fig. 2C), suggesting a more general effects. Moreover, gene expression analysis showed increased mRNA expression of markers of fatty acid content and synthesis, such as aP2, Gpd1, or PEPCK, in livers of RGS4−/− compared to RGS4+/+ mice (Fig. 2D). The increased lipid content in liver was correlated with increased glucose and insulin levels in serum of fasted RGS4−/− mice (Fig. 2E-F), which was overall consistent with the observed increase in circulating FFA in RGS4−/− mice.
FIG 2.
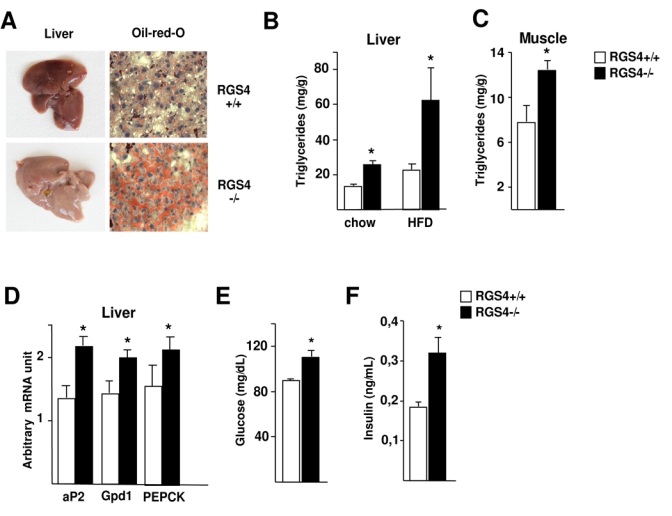
Lipid content in liver and serum metabolic factors in RGS4−/− mice. (A) Representative pictures of whole livers of 25-week-old RGS4+/+ or −/− mice. Pale colour is indicative of lipid accumulation. Oil Red O-stained liver sections in the same mice demonstrate lipid content. (B) Hepatic triglyceride content in 25 week-old RGS4+/+ (n=5) and −/− (n=5) mice on a chow or high fat diet for 4 weeks. (C) Muscle triglyceride content in 25 week-old RGS4+/+ (n=5) and −/− (n=5) normal fed mice. (D) Hepatic expression levels of aP2, Gpdl, and PEPCK in normal-fed mice as determined using quantitative RT-PCR. Serum fasting glucose concentration (E) and insulin serum levels (F) were determined in 18-week-old RGS4+/ or −/− mice as indicated.
Impaired glucose homeostasis and insulin secretion in RGS4−/− mice
Liver steatosis, hyperglycemia, and hyperinsulinemia are strong predictors of insulin resistance. We therefore evaluated glucose homeostasis in RGS4−/− and +/+ mice. Intraperitoneal glucose tolerance test (IPGTT) showed a significant trend of RGS4−/− mice towards glucose intolerance, compared to RGS4+/+ mice (Fig. 3A). These differences were even more pronounced when IPGTT was performed on high fat diet fed mice (Fig. 3B). Glucose intolerance in RGS4−/− mice was correlated with a decrease in insulin secretion in response to a glucose load (Fig. 3C). These results strongly suggested that RGS4 is implicated in the control of glucose homeostasis.
FIG 3.
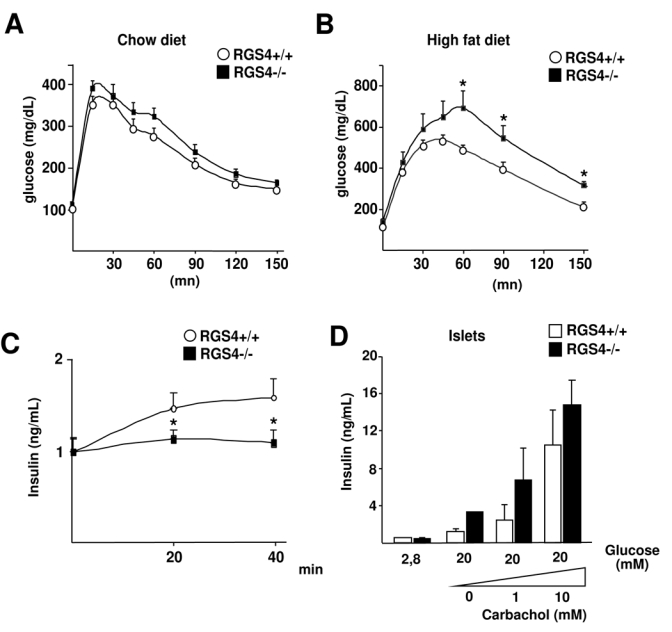
Glucose homeostasis in RGS4−/− mice. Intraperitoneal glucose tolerance test (IPGTT) in 25 week-old mice under chow diet (A) (RGS4+/+, n=8; RGS4−/−, n=8) or after 3 weeks of high fat diet (B) (RGS4 +/+, n=5; RGS4 −/−, n=5). Blood glucose concentrations were measured at the indicated time points following i.p. injection of glucose (2 g/kg). (C) Quantification of relative serum insulin levels measured by ELISA test at the indicated time points in the same mice during the IPGTT in A. (D) Insulin secretion of isolated islets from RGS4−/− or +/+ mice stimulated for 1 hour in the presence of 2.8 mM or 20 mM glucose, and increasing concentrations of carbachol. Results are relative to total insulin and protein content.
Decreased insulin secretion could point to either an intrinsic defect of RGS4−/− pancreatic β-cells, or a toxic effect, secondary to chronically elevated circulating FFA, such as observed in RGS4−/− mice. Analysis of isolated islets from RGS4−/− or +/+ mice demonstrated that RGS4−/− β-cells were not defective in insulin secretion in response to glucose, when compared to islets from RGS4+/+ mice (Fig. 3D), suggesting that the decrease in insulin secretion in response to glucose observed in RGS4−/− mice (Fig. 3C) was rather secondary to the toxic effects of FFA.
No effects of RGS4 in adipocyte differentiation and lipid content
To elucidate the implication of RGS4 in WAT development or function we first analyzed RGS4 mRNA expression during the adipocyte differentiation program of 3T3-L1 preadipocytes. RGS4 was expressed in 3T3-L1 preadipocytes, whereas its expression declined during the differentiation process reaching the limits of detection in fully differentiated adipocytes (Fig. 2A). In addition, no differences in the differentiation capacity was observed, as assessed by oil-red-O staining between 3T3-L1 cells infected with retrovirus expressing either RGS4 or empty vectors (Fig. 2B). Furthermore, the lack of differences in lipid content suggested a normal balance between lipolysis and lipogenesis in RGS4-overexpressing cells. RGS4 overexpression in these 3T3-L1 cells was verified by qPCR (Fig. 2C). Taken together these results suggested that the observed effects of RGS4 on lipolysis (Fig. 1) were not cell autonomous of WAT.
Increased catecholamine release in RGS4−/− mice
Insulin resistance observed in RGS4−/− mice was likely the result of impaired FFA secretion in WAT. Expression of RGS4 was however very low in adipose tissue of mice (Fig. 5A), precluding any effect of this protein in this tissue. Therefore the observed effects of RGS4 might be mediated by hormonal signaling, such as catecholamines, which are key hormones for the regulation of lipolysis. RGS4 was preferentially expressed in the mouse adrenal medulla as well as in the zona glomerulosa as demonstrated using β-gal staining of mouse adrenal and kidney sections (Fig 5B). Consistent with our hypothesis, serum concentration of both epinephrine and norepinephrine were robustly increased in RGS4−/− compared to RGS4+/+ overnight-fasted mice (Fig. 5C). Interestingly, this increase was abrogated when mice were refed for 4h (Fig. 5C). This was consistent with the observed increase in basal lipolysis and fasting FFA in RGS4−/− mice. In order to elucidate whether this increase in circulating catecholamine—levels originated from adrenal glands, the main tissue involved in catecholamine release at the periphery, secretion experiments using acute adrenal slices were performed. Upon ACh stimulation, epinephrine and norepinephrine secretion was up-regulated in glands from RGS4+/+ mice, as expected (Fig. 4D-E). Most interestingly was the observation that adrenal glands from RGS4−/− mice secreted at least 4-fold more epinephrine and norepinephrine in response to ACh stimulation than adrenals from RGS4+/+ mice (Fig. 4D-E). Furthermore, basal catecholamine secretion levels were increased in adrenals from RGS4−/− compared to +/+ mice (Fig. 4D-E). Altogether, these results suggest that RGS4 negatively regulates catecholamine secretion in adrenal glands.
FIG 5.
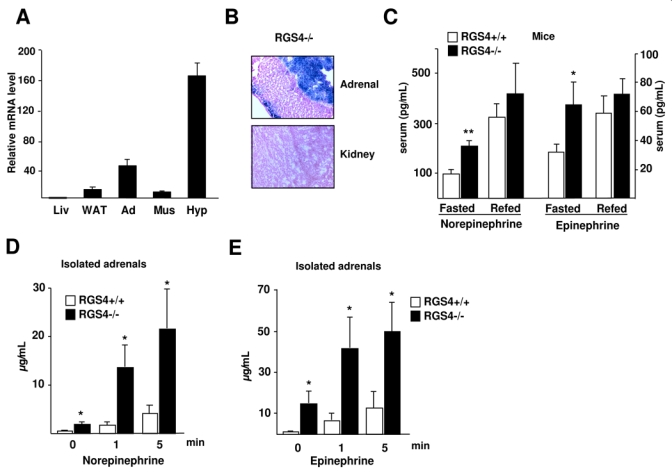
Increased catecholamine secretion in RGS4−/− mice. (A) RGS4 expression in mouse tissues (Liv=liver; WAT=white adipose tissue; Ad=adrenals; Mus=muscle; Hyp=hypothalamus). (B) Representative β-gal staining of adrenal glands and kidney sections of RGS4−/− mice as indicated. (C) Quantification of serum concentration of norepinephrine and epinephrine in overnight-fasted and 4 hour-refed 23 week-old mice (RGS4+/+, n=5, RGS4−/−, n=5). Norepinephrine (D) and epinephrine (E) concentrations were measured at the indicated time points following stimulation of acute adrenal slices (n=6) with acetylcholine (100 μM).
FIG 4.
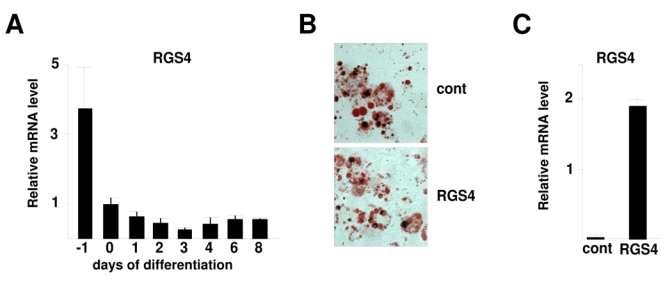
RGS4 expression during adipocyte differentiation. (A) RGS4 expression in 3T3L1 preadipocyte differentiation was determined using quantitative RT-PCR. Results were normalized by the expression level of rS9. (B) Oil Red O staining of 3T3L1 adipocytes expressing either an empty vector (control) or a vector encoding RGS4 (RGS4) 8 days after induction of differentation. (C) RGS4 mRNA expression, analysed by RT-PCR, in 3T3L1 empty vector or RGS4 vector expressing cells.
Discussion
Circulating catecholamines are mainly secreted by adrenal glands in response to synaptically-released ACh at the splanchnic nerve terminals synapsing onto chromaffin cells. ACh exerts its effects through activation of post-synaptic nicotinic and muscarinic cholinergic receptors (16, 17). RGS4 has been shown to participate in the attenuation of calcium signaling in CHO and acinar pancreatic cells (18–20). Enough evidence has led to propose RGS4 as a modulator of Ca2+ oscillations elicited by many hormones and neurotransmitters, such as ACh (reviewed in (7)). Participation of RGS4 in regulation of epinephrine and norepinephrine secretion in adrenal glands is therefore likely. Consistent with this hypothesis we show that adrenal glands from RGS4−/− mice secrete larger amounts of epinephrine and norepinephrine than RGS4+/+ mice, even in the absence of any stimulation, resulting in increased circulating catecholamines in these RGS4−/− mice.
Catecholamines play a major role in the stimulation of lipolysis in WAT, through the beta-adrenergic receptors (1). The increased levels of norepinephrine and epinephrine that we observed in serum of RGS4−/− compared to RGS4+/+ mice are likely translated into higher basal lipolytic rate in WAT. On its turn, this results in increased FFA release and accumulation of circulating FFA. Deregulation of the lipolytic process leading to increased circulating FFA levels, such as observed in RGS4−/− mice results in increased lipid uptake and lipid accumulation in liver. Liver steatosis in RGS4−/− mice is a consistent finding in our study. When adipose tissue is overloaded with lipids, or when lipolysis is abnormally elevated, liver, and to some extent muscle can buffer the increased circulating FFA, which are toxic for other tissues, specially for pancreatic β-cells. This protective mechanism is, however transient, since further TG accumulation in liver results in both increased glucose synthesis from FFA, and release of TG included in very low density lipoproteins (VLDL), which could impair peripheral tissue function, in particular pancreatic β-cell insulin secretion (21). Liver steatosis is associated with hepatic insulin resistance, which means that the liver is less sensitive to the suppressive effects of insulin on hepatic glucose production. If the ability of insulin to suppress the hepatic output of glucose is decreased, then this contributes to postprandial hyperglycemia and hyperlipidemia (22). This is the case for RGS4−/− mice, which show an increased glucose levels and a lower glucose tolerance, compared to RGS4+/+ mice. This effect is further increased in mice fed a high fat diet. Furthermore, quantification of lipid content in another metabolic tissue, such as muscle demonstrated an increase in TG content in RGS4−/− compared to +/+ muscles. Increased lipid content in muscle inhibits insulin action in these cells, which could contribute to the obseved insulin resistance in RGS4−/− mice. Glucose intolerance in RGS4−/− mice is therefore the result of the observed increase in circulating FFA, liver steatosis, and increased muscle lipid content in these mice. Elevated plasma FFA and liver steatosis are independent predictors of progression to insulin resistance (23). Chronically elevated FFA has several detrimental effects on glucose homeostasis. FFA may compete with glucose for entry into muscle cells. In addition, excessive fat oxidation inhibits pyruvate dehydrogenase, resulting in the inhibition of glucolysis. These major effects of FFA are reflected in RGS4−/− mice by increased glucose and insulin levels, and glucose intolerance (Fig. 3).
In summary, we have shown that RGS4, which has been so far described as a regulator of neurological processes is also implicated in the control of adipose tissue lipolysis through the regulation of catecholamine secretion. As a result, RGS4−/− mice have increased circulating FFA, liver steatosis, and glucose intolerance. RGS4 could be therefore considered as a new target for the treatment of insulin resistance and type II diabetes. Inhibition of RGS protein signaling has been proposed for the treatment of several neurological pathologies, such as depression, epilepsy, or pain (8). Concerning metabolic abnormalities, such as obesity, inhibition of RGS4 with specific inhibitors (24) could result in increased lipolysis and reduced adiposity at the long term. Concomitant treatments to avoid accumulation of lipids in liver and muscle should be, however also envisaged.
Acknowledgments
Emilie Blanchet, Jacques Teyssier and Corinne Henriquet are acknowledged for their technical assistance. We thank all the members of Lluis Fajas lab for their helpful support and discussion. This work was supported by grants from La Ligue Nationale Contre le Cancer, INSERM, Fondation Pour la Recherche Medicale, ANR, and ARC.
Abbreviations
- RGS
regulator of G-protein signaling
- WAT
white adipose tissue
- NEFA
non-esterified fatty acids
- FFA
free fatty acids
- TG
triglycerides
- ATGL
adipose triglyceride lipase
- HSL
hormone-sensitive lipase
- PDE3B
phosphodiesterase 3B
- IPGTT
intraperitoneal glucose tolerance test
- ACh
acetylcholine
References
- 1.Langin D. Adipose tissue lipolysis as a metabolic pathway to define pharmacological strategies against obesity and the metabolic syndrome. Pharmacol Res. 2006;53:482–91. doi: 10.1016/j.phrs.2006.03.009. [DOI] [PubMed] [Google Scholar]
- 2.DeHaven J, Sherwin R, Hendler R, Felig P. Nitrogen and sodium balance and sympathetic-nervous-system activity in obese subjects treated with a low-calorie protein or mixed diet. N Engl J Med. 1980;302:477–82. doi: 10.1056/NEJM198002283020901. [DOI] [PubMed] [Google Scholar]
- 3.Arner P. Human fat cell lipolysis: biochemistry, regulation and clinical role. Best Pract Res Clin Endocrinol Metab. 2005;19:471–82. doi: 10.1016/j.beem.2005.07.004. [DOI] [PubMed] [Google Scholar]
- 4.Tentolouris N, Liatis S, Katsilambros N. Sympathetic system activity in obesity and metabolic syndrome. Ann N Y Acad Sci. 2006;1083:129–52. doi: 10.1196/annals.1367.010. [DOI] [PubMed] [Google Scholar]
- 5.Zimmermann R, Strauss JG, Haemmerle G, et al. Fat mobilization in adipose tissue is promoted by adipose triglyceride lipase. Science. 2004;306:1383–6. doi: 10.1126/science.1100747. [DOI] [PubMed] [Google Scholar]
- 6.Cabrera-Vera TM, Vanhauwe J, Thomas TO, et al. Insights into G protein structure, function, and regulation. Endocr Rev. 2003;24:765–81. doi: 10.1210/er.2000-0026. [DOI] [PubMed] [Google Scholar]
- 7.Hollinger S, Hepler JR. Cellular regulation of RGS proteins: modulators and integrators of G protein signaling. Pharmacol Rev. 2002;54:527–59. doi: 10.1124/pr.54.3.527. [DOI] [PubMed] [Google Scholar]
- 8.Neubig RR, Siderovski DP. Regulators of G-protein signalling as new central nervous system drug targets. Nat Rev Drug Discov. 2002;1:187–97. doi: 10.1038/nrd747. [DOI] [PubMed] [Google Scholar]
- 9.Grillet N, Pattyn A, Contet C, Kieffer BL, Goridis C, Brunet JF. Generation and characterization of Rgs4 mutant mice. Mol Cell Biol. 2005;25:4221–8. doi: 10.1128/MCB.25.10.4221-4228.2005. [DOI] [PMC free article] [PubMed] [Google Scholar]
- 10.Ishii M, Inanobe A, Fujita S, Makino Y, Hosoya Y, Kurachi Y. Ca(2+) elevation evoked by membrane depolarization regulates G protein cycle via RGS proteins in the heart. Circ Res. 2001;89:1045–50. doi: 10.1161/hh2301.100815. [DOI] [PubMed] [Google Scholar]
- 11.Riley B, Kendler KS. Molecular genetic studies of schizophrenia. Eur J Hum Genet. 2006;14:669–80. doi: 10.1038/sj.ejhg.5201571. [DOI] [PubMed] [Google Scholar]
- 12.Hansen JB, Petersen RK, Larsen BM, Bartkova J, Alsner J, Kristiansen K. Activation of peroxisome proliferator activated receptor g bypasses the function of the retinoblastoma protein in adipocyte differentiation. JBC. 1999;274:2386–2393. doi: 10.1074/jbc.274.4.2386. [DOI] [PubMed] [Google Scholar]
- 13.Picard F, Gehin M, Annicotte J, et al. SRC-1 and TIF2 control energy balance between white and brown adipose tissue. Cell. 2002;11:931–941. doi: 10.1016/s0092-8674(02)01169-8. [DOI] [PubMed] [Google Scholar]
- 14.Moser T, Neher E. Rapid exocytosis in single chromaffin cells recorded from mouse adrenal slices. J Neurosci. 1997;17:2314–23. doi: 10.1523/JNEUROSCI.17-07-02314.1997. [DOI] [PMC free article] [PubMed] [Google Scholar]
- 15.Fajas L, Annicotte JS, Miard S, Sarruf D, Watanabe M, Auwerx J. Impaired pancreatic growth, beta cell mass, and beta cell function in E2F1 (−/−) mice. J Clin Invest. 2004;113:1288–95. doi: 10.1172/JCI18555. [DOI] [PMC free article] [PubMed] [Google Scholar]
- 16.Douglas WW, Rubin RP. Mechanism of nicotinic action at the adrenal medulla: calcium as a link in stimulus-secretion coupling. Nature. 1961;192:1087–9. doi: 10.1038/1921087b0. [DOI] [PubMed] [Google Scholar]
- 17.Douglas WW, Rubin RP. The role of calcium in the secretory response of the adrenal medulla to acetylcholine. J Physiol. 1961;159:40–57. doi: 10.1113/jphysiol.1961.sp006791. [DOI] [PMC free article] [PubMed] [Google Scholar]
- 18.Ho G, Wang Y, Jones PG, Young KH. Activation of serum response element by D2 dopamine receptor is governed by Gbetagamma-mediated MAPK and Rho pathways and regulated by RGS proteins. Pharmacology. 2007;79:114–21. doi: 10.1159/000098097. [DOI] [PubMed] [Google Scholar]
- 19.Xu X, Zeng W, Popov S, et al. RGS proteins determine signaling specificity of Gq-coupled receptors. J Biol Chem. 1999;274:3549–56. doi: 10.1074/jbc.274.6.3549. [DOI] [PubMed] [Google Scholar]
- 20.Riddle EL, Schwartzman RA, Bond M, Insel PA. Multi-tasking RGS proteins in the heart: the next therapeutic target? Circ Res. 2005;96:401–11. doi: 10.1161/01.RES.0000158287.49872.4e. [DOI] [PubMed] [Google Scholar]
- 21.Lewis GF, Carpentier A, Adeli K, Giacca A. Disordered fat storage and mobilization in the pathogenesis of insulin resistance and type 2 diabetes. Endocr Rev. 2002;23:201–29. doi: 10.1210/edrv.23.2.0461. [DOI] [PubMed] [Google Scholar]
- 22.den Boer MA, Voshol PJ, Kuipers F, Romijn JA, Havekes LM. Hepatic glucose production is more sensitive to insulin-mediated inhibition than hepatic VLDL-triglyceride production. Am J Physiol Endocrinol Metab. 2006;291:E1360–4. doi: 10.1152/ajpendo.00188.2006. [DOI] [PubMed] [Google Scholar]
- 23.Tataranni PA, Baier LJ, Paolisso G, Howard BV, Ravussin E. Role of lipids in development of noninsulin-dependent diabetes mellitus: lessons learned from Pima Indians. Lipids. 1996;31(Suppl):S267–70. doi: 10.1007/BF02637088. [DOI] [PubMed] [Google Scholar]
- 24.Roman DL, Talbot JN, Roof RA, Sunahara RK, Traynor JR, Neubig RR. Identification of small-molecule inhibitors of RGS4 using a high-throughput flow cytometry protein interaction assay. Mol Pharmacol. 2007;71:169–75. doi: 10.1124/mol.106.028670. [DOI] [PubMed] [Google Scholar]