

Abstract
Clinical Relevance
It remains a critical issue to reliably identify specific patients at high risk for recurrence and metastasis of lung cancer. To date, there has been no clinically applied gene test for predicting lung cancer recurrence. This study validated a 35-gene prognostic signature in various cell types of non-small cell lung cancer. The analysis showed that the 35-gene signature could further stratify patients at stage 1A into distinct prognostic subgroups. This lung cancer prognostic signature is independent of traditional clinicopathological factors, including patient age, clinical stage, tumor differentiation, and tumor grade. This signature had better prognostic performance than other lung cancer signatures, including the 5-gene signature and the 133-gene signature in the studied cohorts. The gene expression and protein expression of the identified biomarkers were validated in real-time RT-PCR and Western blots analysis of clinical specimens. This study indicates that the 35-gene signature could be applied in clinics for patient stratification.
Purpose
It remains a critical challenge to determine the risk for recurrence in early stage non-small cell lung cancer (NSCLC) patients. Accurate gene expression signatures are needed to classify patients into high- and low-risk groups to improve the selection of patients for adjuvant therapy.
Experimental Design
Multiple published microarray datasets were used to evaluate our previously identified lung cancer prognostic gene signature. Expression of the signature genes was further validated with real-time RT-PCR and Western blot assays of snap frozen lung cancer tumor tissues.
Results
Our previously identified 35-gene signature stratified 264 patients with non-small cell lung cancer into high- and low-risk groups with distinct overall survival rates (P < 0.05, Kaplan-Meier analysis, log-rank tests). The 35-gene signature further stratified patients with clinical stage 1A diseases into poor prognostic and good prognostic subgroups (P = 0.0007, Kaplan-Meier analysis, log-rank tests). This signature is independent of other prognostic factors for non-small cell lung cancer, including age, sex, tumor differentiation, tumor grade, and tumor stage. The expression of the signature genes was validated with real-time RT-PCR analysis of lung cancer tumor specimens. Protein expression of two signature genes, TAL2 and ILF3, was confirmed in lung adenocarcinoma tumors by using Western blot analysis. These two biomarkers showed correlated mRNA and protein over-expression in lung cancer development and progression.
Conclusions
The results indicate that the identified 35-gene signature is an accurate predictor of survival in non-small cell lung cancer. It provides independent prognostic information in addition to traditional clinicopathological criteria.
Keywords: molecular signature, non-small cell lung cancer, prognosis, microarray analysis, protein expression, Western blots
Introduction
Lung cancer is the leading cause of cancer-related deaths, and non-small cell lung cancer (NSCLC) accounts for almost 80% of deaths (1, 2). Currently, surgery is the major treatment option for patients with stage I NSCLC. However, 35–50% of stage I NSCLC patients will relapse within 5 years (3), indicating that a subgroup of these patients might benefit from adjuvant chemotherapy (4). On the other hand, patients with clinical stage IB, IIA, IIB, or IIIA NSCLC receive adjuvant chemotherapy, and some may unnecessarily receive potentially toxic chemotherapeutic treatment (5). It remains a critical and unsolved challenge for clinicians to precisely estimate the risk for recurrence in individual patients for appropriate personalized therapy.
The emerging use of biomarkers may enable clinicians to make treatment decisions based on specific characteristics of individual patients and their tumor (6). There have been significant advances in refining the prognosis of NSCLC by gene expression signatures (3, 7–14), most notably the 5-gene signature from Chen et al (4) and the 133-gene signature from Potti et al (5). Gene expression-based diagnosis of lung adenocarcinomas (15) has already been incorporated in clinical settings to treat this deadly disease.
The major histological types of NSCLC include adenocarcinoma and squamous cell carcinoma. Our previous analysis identified a prognostic 35-gene signature from microarray profiles of 170 lung adenocarcinomas (16). The present study further validates that the 35-gene signature quantifies overall survival in 264 patients with lung adenocarcinoma and squamous cell lung cancer. These microarray profiles and associated clinical information were obtained from three previously published patient cohorts (8, 9, 11). The association between the expression-defined risk groups and lung cancer prognostic factors, including patient age, sex, tumor grade, clinical stage, and tumor differentiation was assessed. The expression of the signature genes was further confirmed by real-time RT-PCR and Western blot analysis of lung cancer tumor specimens.
Materials and Methods
Patient samples and microarray profiles
The microarray profiles of the patients analyzed in this study included a training set from Beer et al. (3) (n = 86), and three validation sets from Bild et al. (8) (n = 111), Garber et al. (9) (n = 24), and Raponi et al. (11) (n = 129). The histological groups of the studied patient cohorts include lung adenocarcinoma and squamous cell lung cancer. The clinical characteristics of these patient cohorts were described in Supplementary Table 3. Genes screened on different microarray platforms were matched by their Unigene Cluster IDs or gene names with the interactive MatchMiner (17) website interface.1
The lung adenocarcinoma tumor specimens used in Western blot analysis were obtained from the Cooperative Human Tissue Network (CHTN) (Ohio State University Tissue Bank, Columbus, OH). Tumor tissues were collected in surgical resections and were snap-frozen at −80° C until used for protein extraction. Histological preparations of tumor sections were examined by pathologists. This study was approved with an IRB exemption from West Virginia University.
Nearest centroid classification method
The raw microarray data from Bild et al (8) was obtained from the Duke website.2 As these microarray data were measured on different platforms, a two-step normalization method was used to convert these datasets into comparable scales. First, the raw microarray data were quantile normalized with dChip (18). Second, the signature genes were sample-wise normalized to have mean value of zero and standard deviation of 1. Specifically, for each patient sample, the gene expression g(x) was normalized to [g(x) − mean(x)]/sd(x), where mean(x) is the mean of all the genes measured on this sample in the quantile normalized microarray data, and sd(x) is the standard deviation of all the genes measured on this sample. After the normalization, the signature genes in the validation sets were identified. In the training set from Beer et al (3), patients who survived 5-year constitute the good prognosis group (centroid). The average expression value for each signature gene in the good prognosis centroid was computed. In the validation sets, Pearson’s correlation coefficient was determined between each tumor sample and the good prognosis centroid in the training set. The cutoff value for patient stratification was determined from Garber’s cohort (n = 24) (9). Each tumor sample was classified into good prognosis group if the correlation coefficient is greater than 0.32; otherwise, it is classified into poor prognosis group. The same prognostic categorization scheme was applied to Bild’s cohort (n = 111) (8).
The cohort from Raponi et al. (11) (n = 129) was retrieved from the GEO website (GDS2373). The data was randomly partitioned into a training set (n = 65) and a test set (n = 64). In the training set, each tumor sample was classified into good prognosis group if the correlation coefficient is greater than −0.15; otherwise, it is classified into poor prognosis group. The same cutoff was applied to the test set in patient stratification.
Statistical methods
Kaplan-Meier analysis was used to assess the probability of overall survival of two prognostic groups in the studied patient cohorts. To evaluate the association between gene expression-defined risk groups and clinicopathologic parameters in the studied patient cohorts, Chi-square tests or Fisher’s exact tests (two-sided) were used. Differential gene expression was assessed by using t-tests. All statistical testing was performed with software R.
Evaluation of other non-small cell lung cancer prognostic signatures
The DNA microarray data from Bild et al. (8), Garber et al. (9), and Raponi et al. (11) were retrieved from the GEO website. The 5-gene signature from Chen et al. (4) contains DUSP6, MMD, STAT1, ERBB3, and LCK; and the control gene is TBP. To make the levels of gene expression from the microarrays and from RT-PCR comparable, the microarray data was log-transformed to a base-2 scale after assigning a value of 1.1 to intensity values of less than 1.1. After log transformation, the levels of expression of the five genes were divided by the level of expression of the control gene TBP in order to calculate the relative level of expression. The decision-tree model was described in the Supplementary Figure 1 from Chen et al. (4). The overall survival rates of the high- and low-risk groups defined by the 5-gene signature were assessed by Kaplan-Meier analysis.
The probe sets of the 133-gene signature (listed in Supplementary Table 2) from Potti et al. (5) were identified from Bild et al. (8) and Raponi et al. (11). A total of 123 signature genes were identified in each of the validation sets. Garber’s cohort was not used in the validation because the samples size (n = 24) is too small compared with the number of signature genes. The mean value of multiple probes was computed to obtain a unique expression value for each gene. There was a convergence problem when fitting these genes in a Cox hazard proportional model. The convergence problem could be caused by over-fitting and/or correlated covariates. In order to solve the problem, we computed the correlation coefficient of all possible pairs of the signature genes. Highly correlated genes were randomly removed from the Cox model of overall survival. Specifically, genes with correlation coefficients greater than 0.44 (P < 1E-6) were dropped from the Cox model of Bild’s cohort; and genes with correlation coefficients greater than 0.46 (P < 1E-6) were dropped from the Cox model of Raponi’s cohort. The Cox model could be fit with 71 or less genes for Bild’s cohort (8) and with 88 or less genes for Raponi’s cohort (11).
RNA extraction
Total RNA was extracted from frozen lung tissue using the RNeasy mini kit according the manufacturer’s protocol (Qiagen, USA). RNA was eluted in 30 μl of RNase-free water and stored at −80°C. The quality and integrity of the total RNA was evaluated on the 2100 Bioanalyzer (Agilent Technologies, CA).
Reverse transcription
From each sample, 1 μg of RNA was used to generate cDNA using the High Capacity cDNA kit according to manufacturer’s protocol (Applied biosystems, CA).
Real-time RT-PCR
An endogenous control gene TaqMan Low Density Array card (Applied Biosystems, CA) was run on the ABI PRISM 7900HT Sequence Detection System for eight clinical samples in order to choose a gene that had the most relatively constant expression in the different tissue samples. Three control genes, namely 18S, UBC, and POLR2A had constant expression in the different tissue samples. Constant expression of mRNA for 18S and UBC genes was also confirmed for all lung tissue samples using the individual TaqMan® Gene Expression Assays.
Expression of mRNA for 35 signature genes was measured in each of the lung tissues by real-time PCR using TaqMan® Gene Expression Assays on ABI PRISM 7500 HT Sequence Detection System (Applied Biosystems, CA). On each plate, one no-template control was also run. Total RNA samples run on an Agilent 2100 Bioanalyzer RNA 6000 Nano LabChip.
Protein expression validation using Western blot analysis
Anti-TAL2 antibodies were obtained from Santa Cruz Biotech (Santa Cruz, CA) and anti-ILF3 antibodies were obtained from Abcam (Cambridge, MA) (www.abcam.com). Protein extraction kit was ordered from EMD (Gibbstown, NJ). Western blot analysis was performed according to the methods described previously (19).
Results
Gene expression-based prediction of lung cancer overall survival
In a previous DNA microarray study (16), we identified a 37-gene prognostic signature from 86 lung adenocarcinomas from Beer et al. (3), and validated the signature in 84 adenocarcinomas from Bhattacharjee et al. (7). Several previously unknown genes now have functional annotations, and two unknown genes are removed from the signature (Supplementary Table 1). In this study, we sought to explore whether this gene signature could also predict overall survival in other major cell types of non-small cell lung cancer. Three additional cohorts were obtained from Bild et al. (8) (n = 111), Garber et al. (9) (n = 24), and Raponi et al. (11) (n = 129). These cohorts include lung adenocarcinomas and squamous cell carcinomas. The clinical information provided in the patient cohorts includes age, smoking status, tumor stage, grade, differentiation, and overall survival. The signature genes were identified from various microarray platforms with MatchMiner (17).
To substantiate the prognostic prediction of the 35-gene signature, a nearest centroid classification method was used to stratify patients into high- and low-risk groups. In the cohorts from Bild et al. (8) (n = 111) and Garber et al. (9) (n = 24), patients were stratified based on the correlation between the gene expression signature in the tumor sample and the good prognosis centroid in the training set from Beer et al. (3). The cutoff value for patient stratification was determined from Garber’s cohort (n = 24) (9). Each tumor sample was classified into good prognosis group if the correlation coefficient is greater than 0.32; otherwise, it is classified into poor prognosis group. The same prognostic categorization scheme was applied to Bild’s cohort (n = 111) (8). In both validation sets, the gene expression-defined high- and low-risk groups had distinct overall survival (P < 0.05, log-rank tests) in Kaplan-Meier analysis (Figure 1A and 1B).
Figure 1.

Validation of the 35-gene prognostic signature in two patient cohorts. A. Patients in Garber’s cohort (n = 24) were classified into high- and low-risk groups based on the correlation with the good prognostic centroid in Beer’s cohort. Each tumor sample was classified as low-risk if the correlation coefficient is greater than 0.32; otherwise, it is classified as high-risk. B. The same cutoff was applied to Bild’s cohort (n = 111) in patient stratification. Kaplan-Meier analysis was used to assess the survival rates of different prognostic groups.
In this study, the validation sets were generated on heterogeneous DNA microarray platforms and the RNA was extracted according to different experimental protocols. The same cutoff as described above did not generate significant patient stratification in Raponi’s cohort (11) (n = 129). To avoid over-fitting in the prognostic validation, Raponi’s cohort was randomly partitioned into a training set (n = 65) and a test set (n = 64). In the training set, each tumor sample was classified into good prognosis group if the correlation coefficient is greater than −0.15; otherwise, it is classified into poor prognosis group. In the training set, the high- and low-risk groups had distinct (log-rank P < 0.01) overall survival in Kaplan-Meier analysis (Figure 2A). The same cutoff was applied to the test set in patient stratification. In the test set, the high- and low-risk groups had distinct (log-rank P < 0.03) overall survival in Kaplan-Meier analysis (Figure 2B). These results indicate that the 35-gene signature could stratify patients into high- and low-risk groups in multiple independent cohorts.
Figure 2.

Validation of the 35-gene prognostic signature in Raponi’s cohort (n = 129). The data was randomly partitioned into a training set (n = 65) and a test set (n = 64). In the training set, each tumor sample was classified as low-risk if the correlation with the good prognostic group in Beer’s cohort is greater than −0.15; otherwise, it is classified as high-risk. The same cutoff was applied to the test set in patient stratification.
The 35-gene signature identified poor and good prognostic subgroups in Stage 1A NSCLC
Clinical stage (20) is the most important prognostic factor in lung cancer treatment. In the current practice, surgery is the major treatment option for patients with stage 1 lung cancer. A 5-year survival rate of stage 1 NSCLC was in the range of 40 – 67%, with better results in patients in stage 1A (1). Refined prognostic models are needed to select specific patients in this stage who are at high risk for tumor recurrence for adjuvant chemotherapy.
We sought to explore whether the 35-gene signature could further stratify stage 1A NSCLC into poor and good prognostic groups. In three combined validation cohorts from Bild et al. (8), Garber et al. (9), and Raponi et al. (11), all patients with stage 1A were analyzed. Based on the gene-expression defined prognostic classification as described above, the overall survival rates of the high- and low-risk groups defined in the nearest centroid classification were estimated using Kaplan-Meier analysis. The 35-gene signature was able to further stratify stage 1A NSCLC into high- and low-risk groups with distinct overall survival (P = 0.0007, log-rank tests, Figure 3). The results indicate that the 35-gene signature provides additional prognostic information for stage 1A non-small cell lung cancer.
Figure 3.

The 35-gene signature is independent of tumor stage in lung cancer prognosis. Patients with stage 1A NSCLC from combined cohorts from Bild et al (8), Garber et al (9), and Raponi et al (11) were classified into high- and low-risk groups based on the 35-gene signature in Kaplan-Meier analysis.
Association between expression-defined risk groups and clinicopathological parameters
In order to test whether the 35-gene prognostic signature is independent of traditional criteria, the association of the expression-defined risk groups and clinicopathological parameters was assessed with chi-square tests or Fisher’s exact tests (Supplementary Table 7). Based on the available information, there was no significant association between the prognostic signature and patient age (>60 y), tumor differentiation, tumor grade, tumor stage, or sex. These results indicate that the 35-gene signature is independent of traditional clinicopathological factors in lung cancer prognosis. It should be noted that several clinical parameters are missing in these validation cohorts.
Comparison with other lung cancer prognostic gene signatures
Previous research has established two prognostic gene signatures for lung cancer, namely, the 5-gene signature from Chen et al. (4) and the 133-gene signature from Potti et al. (5). The performance of these two signatures was compared with our identified 35-gene signature in three validation sets. The 5-gene signature was evaluated with the decision-tree model as described in Chen et al. (4) (details provided in Materials and Methods). In Kaplan-Meier analysis on Raponi’s cohort, the difference between the overall survival of gene expression-defined high- and low-risk groups reached borderline significance (log-rank P = 0.06). Different prognostic groups stratified by the 5-gene model did not have distinct overall survival rates in Bild’s or Garber’s cohorts (Figure 4).
Figure 4.

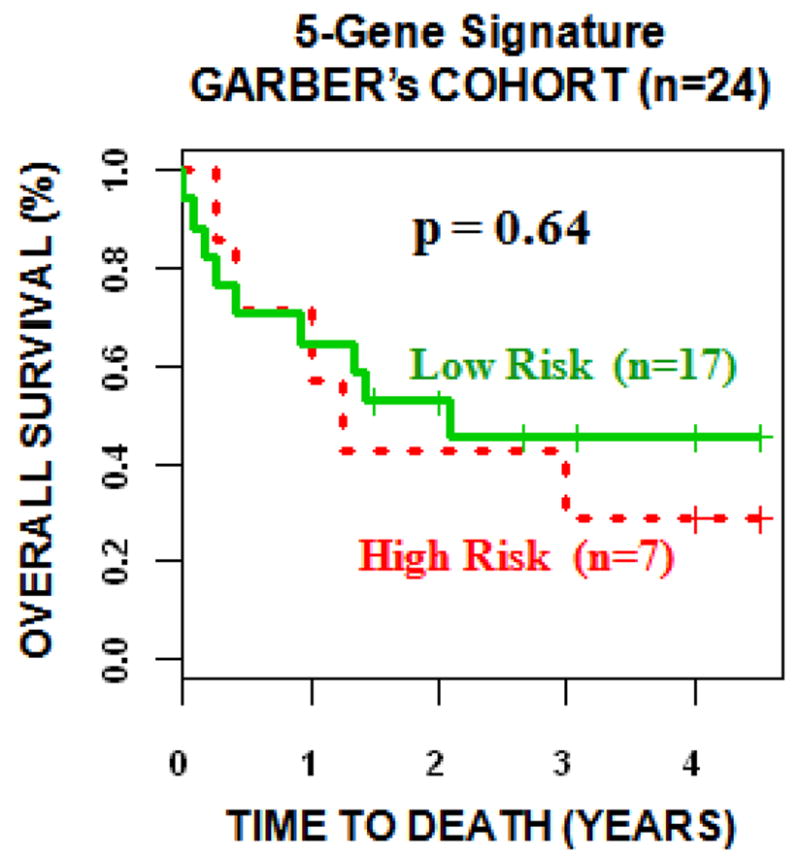
The 5-gene model from Chen et al. (4) was evaluated in three validation sets from Bild et al (8), Garber et al (9), and Raponi et al (11). The 5-gene signature did not stratify patients into distinct prognostic groups in the validation sets using Kaplan-Meier analysis.
There were insufficient details about the weighted classification-tree model for the 133-gene signature from Potti et al (5). In addition, the survival information was not available in the data provided in Potti et al (5). A total of 123 signature genes were identified from both validation sets in Bild et al. (8) and Raponi et al. (11). To validate the prognostic power of Potti’s gene signature, the signature genes were fitted in a Cox proportional hazard ratio. There was a convergence problem when fitting these genes into a Cox proportional hazard model. This problem was solved after correlated genes were removed from the Cox model, suggesting that the 133-gene signature caused an over-fitting problem due to correlated or redundant biomarkers within the gene signature. Based on the fitted Cox model, a survival risk score was generated for each patient. The median of these risk scores was used as a cutoff in the prognostic stratification. Patients with a risk score greater than median were defined as high-risk, whereas those with a smaller risk score were defined as low-risk. This stratification partitioned patients into different prognostic groups with distinct (P < 0.0001, log-rank tests; Figure 5) overall survival in Kaplan-Meier analysis. Due to the lack of details of the classification model in Potti et al (5), a strict separate training-validation scheme on the 133-gene signature could not be performed in this study.
Figure 5.

The 133-gene model from Chen et al. (4) was evaluated in two validation sets from Bild et al (8) and Raponi et al (11). After correlated genes were removed, this signature could fit a Cox proportional hazard model. A survival risk score was generated for each patient. The median of the risk scores was used as a cutoff to stratify each patient cohort into high- and low-risk groups.
Validation of gene expression and protein expression in lung adenocarcinoma
Having established the clinical relevance of the identified prognostic signature in NSCLC using publicly available DNA microarray data, we further confirmed the expression of the signature genes using real-time RT-PCR assays of eight snap-frozen lung cancer tissue samples (details provided in Materials and Methods as well as Supplementary Materials). We then sought to confirm the protein expression of several signature genes of interest since protein products ultimately play an essential role in cancer development and progression. Tissue lysates of both lung cancer tissues and the adjacent normal tissues were subjected to Western blot analysis was used to measure the protein expression of the identified 35 genes. Among the identified 35 genes, only 15 genes have commercially available antibodies to detect their protein products. We first examined the specificity of these antibodies using the cell lysates from a normal lung epithelial cell line (BEAS-2B) and a lung cancer cell line (A549), and found that only six antibodies were able to detect their corresponding protein products (CHD4, GHRHR, ILF3, TAL2, CREB3, and MSX2) in the cell lysates (data not shown). In further analysis with these six antibodies, we found that four out of six genes over-expressed their proteins in a lung cancer tumor tissue sample (ILF3, TAL2, CREB3, and MSX2). To validate the specificities of these identified six proteins, each protein was further probed with a different specific antibody that targets a different epitope. The results confirmed that TAL2 and ILF3 proteins were over-expressed in lung adenocarcinoma tumor tissues compared with the adjacent normal tissues (Figure 6). Both TAL2 and ILF3 are oncogenic proteins.
Figure 6.

Protein expression in lung adenocarcinoma tumor tissues. (A) Histologic specimen of a human lung tissue sample stained with hematoxylin and eosin (H & E). Both sections are well differentiated adenocarcinoma of the lung mostly of bronchoalveolar pattern and with mucin formation. (B and C) Both lung cancer tumor tissues (T) and the adjacent normal tissues (N) tissue lysates were resolved by SDS-PAGE, followed by transferring to PVDF by Western transfer. The transferred proteins on PVDF were probed with the specific antibodies TAL2 (B) and ILF3 (C), respectively. To confirm the specificity of the identified proteins, each protein was sequentially probed with two different antibodies (1 and 2) targeting different epitopes. The transferred PVDF was probed with the first round antibodies (1), treated with stripping buffer, followed by probing with the second round of antibodies (2).
Gene expression levels may not be necessarily correlated with protein expression levels. We further investigated the differential gene expression and qualitative correlation with protein expression for the identified lung cancer signature genes. Our previous study (16) analyzed differential expression patterns of the identified signature genes by using two bioinformatics tools, ONCOMINE (21) and SAGE (22). Specifically, the expression level of ILF3 was significantly higher in lung cancer tissues compared to normal tissues (7, 9, 23), higher in metastasis than in primary lung cancer (7) (P < 0.002), and higher in poorly differentiated lung cancer tumors than in well differentiated tumors (3) (P < 0.002). In this study, we further analyzed the differential expression patterns of the signature genes in high-risk vs. low-risk groups in the studied lung cancer cohorts (details provided in Supplementary Materials). TAL2 had consistent over-expression in high-risk groups in Beer et al. (3) (P < 0.005), Bild et al. (8), and Larsen et al. (14) (Supplementary Table 10). These results demonstrate that several members of our identified gene signature are correlated to the protein expression profiles in lung cancer.
Discussion
Lung cancer is a dynamic and diverse disease and associated with numerous somatic mutations, deletion and amplification events. Patients with the same stage of disease can have markedly different clinical outcomes. Traditional diagnostic and prognostic factors may stratify patients with molecularly distinct diseases into the same group based on morphological assessments. It remains a critical issue to reliably identify specific patients at high risk for recurrence and metastasis lung cancer. Molecular prediction is a necessary step in the future direction of personalized cancer care. The FDA has recently approved the first cancer gene test, MammaPrint (24), for treating early stage breast cancer patients with negative lymph node status. Oncotype is another clinically applied gene test for predicting recurrence of tamoxifen-treated, node-negative, and estrogen-receptor-positive breast cancer (25). To date, there has been no clinically applied gene test for predicting lung cancer recurrence.
Research in transforming molecular diagnostic and prognostic models into predictive and preventive medicine has become increasingly important and needs to meet important recommendations. According to an alternative REMARK (stands for REporting recommendations for tumor MARKer) system (26, 27), cancer prognostic studies must demonstrate whether tumor markers provide information independent of traditional criteria or provide prognostic information within subgroups defined by traditional criteria. In this study, we used previously published DNA microarray data to validate a 35-gene prognostic signature for non-small cell lung cancer. A nearest centroid classification method based on the correlation of gene expression patterns was used in patient stratification. The overall survival rates of the classified high- and low-risk groups were assessed with Kaplan-Meier analysis and log-rank tests. The patient stratification scheme determined on Garber’s cohort (n = 24) (9) also classified patients into distinct (log-rank P < 0.05, Kaplan-Meier analysis) prognostic groups on Bild’s cohort (n = 111) (8). Since the validated DNA microarray data were generated using heterogeneous experimental protocols and platforms, a different cutoff value was used in patient stratification on Raponi’s cohort (11). To avoid over-fitting in the validation, Raponi’s cohort was randomly partitioned into a training set (n = 65) and a test set (n = 64). The cutoff value identified in the training set generated significant patient stratification in both training (log-rank P < 0.01, Kaplan-Meier analysis) and test (log-rank P < 0.03, Kaplan-Meier analysis) sets. The results indicate that the 35-gene signature provides useful information for patient stratification in clinical decision-making. The analysis showed that this gene signature could further stratify patients in stage 1A NSCLC into subgroups with distinct overall survival (log-rank P < 0.0007, Kaplan-Meier analysis). The relation of the gene signature to standard prognostic values was investigated. There was no significant association between the 35-gene prognostic signature and patient age, sex, tumor differentiation, tumor grade, or tumor stage. It should be noted that many clinical parameters were not available in the studied cohorts. This is acknowledged as a limitation of the current study.
The 35-gene signature was compared with two other most notable lung cancer gene signatures, namely, the 5-gene signature from Chen et al (4) and the 133-gene signature from Potti et al (5). The 5-gene signature was validated based on the decision-tree model reported in Supplementary Figure 1 in Chen et al (4). The 5-gene model did not stratify patients into distinct prognostic groups in any of the three validation cohorts. In comparison, the 35-gene signature generated significant (log-rank P < 0.05, Kaplan-Meier analysis) patient stratification on the same datasets, indicating that the 35-gene signature outperformed the 5-gene signature from Chen et al (4). The 133-gene signature (as listed in Supplementary Table 2) from Potti et al (5) could not be validated because insufficient details were provided for their prognostic model, including patient survival time and the weighted decision-tree algorithm. When fitted in a Cox regression hazard function, the 133-gene signature caused a non-convergence problem. This problem was solved after the removal of significantly correlated signature genes, suggesting that Potti’s gene signature contains correlated and/or redundant biomarkers. In this study, the 133-gene signature from Potti et al (5) could not be evaluated with other lung cancer signatures because the details of the prognostic model were not provided either through the publication (5) or personal communication.
After we validated the clinical prognostic value of the lung cancer gene signature using public DNA microarray data, we have validated the expression of the signature genes using real-time RT-PCR analysis of snap-frozen lung cancer tissue samples. Furthermore, we sought to determine the relevance of our identified signature genes at the protein level. Because the commercially available antibodies to the identified 35 genes are very limited, thus far we have only validated the protein expression for TAL2 and ILF3. Western blots results show that both TAL2 and ILF3 are over-expressed in lung cancer tumor tissues compared to adjacent normal lung tissues. In order to prove the specificity of the identified proteins, each protein was probed with two different antibodies which recognize different epitopes of the same protein. Both TAL2 and ILF3 are oncogenes, and their protein products are likely involved in the cancer process. Our results indicated that some signature genes have correlated protein expression in lung cancer.
Microarray technologies promise the discovery of novel biomarkers in genome-scale association analysis. Nevertheless, there are several disadvantages that have limited its application into routine clinical tests: 1) microarray tests are labor intensive, time consuming, and expensive; 2) they require a specific system to perform the assays, which is not available in many clinical centers; 3) the results can be influenced by each step of the complex assay, ranging from array manufacturing to sample preparation (extraction, labeling, hybridization) and image analysis, which raises the issue of reproducibility; and 4) they usually include a high number of genes and their predictive value needs to be substantially improved before being accepted for routine clinical tests (28–31). Compared with microarrays, real-time RT-PCR is more efficient and consistent. It requires only a small amount of sample and can quantify gene expression in paraffin-embedded tissues. The combined use of real-time RT-PCR with microarray analysis can overcome the inherent biases of the microarray technique and is emerging as the optimal method of choice for genome-scale gene expression analysis (32).
In this study, the 35-gene signature is validated as an independent prognostic factor for non-small cell lung cancer. The transcriptional profiles analyzed in this study were generated on DNA microarrays and the gene expression of the identified biomarkers was further confirmed using real-time RT-PCR assays of snap-frozen lung cancer tumor tissues. Several protein products in the signature were also validated in both lung cancer cell lines and lung adenocarcinoma tumor tissues. Our future research will use quantitative RT-PCR techniques to validate the gene expression profiles on a separate patient cohort. A clinical protocol will be developed based on RT-PCR assays for the management of non-small cell lung cancer patients. Further, more signature genes will be validated in proteomic assays to explore whether this signature is associated with clinical outcome or contributive to tumor development and progression.
Supplementary Material
Acknowledgments
This work is supported by the NIH/NCRR P20 RR16440-03 (Dr. Guo) and 5R01CA060731-13 (Dr. Flynn). We thank Dr. Lisa McShane from the National Cancer Institute (Bethesda, MD) for her help in statistical analysis. We appreciate Drs. Mitch Raponi and Jack Yu from Johnson & Johnson (Radnor, PA) for providing the original microarray data.
Footnotes
Publisher's Disclaimer: Disclaimer
The findings and conclusions in this report are those of the author(s) and do not necessarily represent the views of the National Institute for Occupational Safety and Health.
References
- 1.Hoffman PC, Mauer AM, Vokes EE. Lung cancer. Lancet. 2000;355:479–85. doi: 10.1016/S0140-6736(00)82038-3. [DOI] [PubMed] [Google Scholar]
- 2.Spira A, Ettinger DS. Multidisciplinary management of lung cancer. N Engl J Med. 2004;350:379–92. doi: 10.1056/NEJMra035536. [DOI] [PubMed] [Google Scholar]
- 3.Beer DG, Kardia SL, Huang CC, et al. Gene-expression profiles predict survival of patients with lung adenocarcinoma. Nat Med. 2002;8:816–24. doi: 10.1038/nm733. [DOI] [PubMed] [Google Scholar]
- 4.Chen HY, Yu SL, Chen CH, et al. A five-gene signature and clinical outcome in non-small-cell lung cancer. N Engl J Med. 2007;356:11–20. doi: 10.1056/NEJMoa060096. [DOI] [PubMed] [Google Scholar]
- 5.Potti A, Mukherjee S, Petersen R, et al. A genomic strategy to refine prognosis in early-stage non-small-cell lung cancer. N Engl J Med. 2006;355:570–80. doi: 10.1056/NEJMoa060467. [DOI] [PubMed] [Google Scholar]
- 6.Dalton WS, Friend SH. Cancer biomarkers--an invitation to the table. Science. 2006;312:1165–8. doi: 10.1126/science.1125948. [DOI] [PubMed] [Google Scholar]
- 7.Bhattacharjee A, Richards WG, Staunton J, et al. Classification of human lung carcinomas by mRNA expression profiling reveals distinct adenocarcinoma subclasses. Proc Natl Acad Sci U S A. 2001;98:13790–5. doi: 10.1073/pnas.191502998. [DOI] [PMC free article] [PubMed] [Google Scholar]
- 8.Bild AH, Yao G, Chang JT, et al. Oncogenic pathway signatures in human cancers as a guide to targeted therapies. Nature. 2006;439:353–7. doi: 10.1038/nature04296. [DOI] [PubMed] [Google Scholar]
- 9.Garber ME, Troyanskaya OG, Schluens K, et al. Diversity of gene expression in adenocarcinoma of the lung. Proc Natl Acad Sci U S A. 2001;98:13784–9. doi: 10.1073/pnas.241500798. [DOI] [PMC free article] [PubMed] [Google Scholar]
- 10.Powell CA, Spira A, Derti A, et al. Gene expression in lung adenocarcinomas of smokers and nonsmokers. Am J Respir Cell Mol Biol. 2003;29:157–62. doi: 10.1165/rcmb.2002-0183RC. [DOI] [PubMed] [Google Scholar]
- 11.Raponi M, Zhang Y, Yu J, et al. Gene expression signatures for predicting prognosis of squamous cell and adenocarcinomas of the lung. Cancer Res. 2006;66:7466–72. doi: 10.1158/0008-5472.CAN-06-1191. [DOI] [PubMed] [Google Scholar]
- 12.Wigle DA, Jurisica I, Radulovich N, et al. Molecular profiling of non-small cell lung cancer and correlation with disease-free survival. Cancer Res. 2002;62:3005–8. [PubMed] [Google Scholar]
- 13.Tomida S, Koshikawa K, Yatabe Y, et al. Gene expression-based, individualized outcome prediction for surgically treated lung cancer patients. Oncogene. 2004;23:5360–70. doi: 10.1038/sj.onc.1207697. [DOI] [PubMed] [Google Scholar]
- 14.Larsen JE, Pavey SJ, Passmore LH, Bowman RV, Hayward NK, Fong KM. Gene Expression Signature Predicts Recurrence in Lung Adenocarcinoma. Clin Cancer Res. 2007;13:2946–54. doi: 10.1158/1078-0432.CCR-06-2525. [DOI] [PubMed] [Google Scholar]
- 15.Hayes DN, Monti S, Parmigiani G, et al. Gene expression profiling reveals reproducible human lung adenocarcinoma subtypes in multiple independent patient cohorts. J Clin Oncol. 2006;24:5079–90. doi: 10.1200/JCO.2005.05.1748. [DOI] [PubMed] [Google Scholar]
- 16.Guo L, Ma Y, Ward R, Castranova V, Shi X, Qian Y. Constructing molecular classifiers for the accurate prognosis of lung adenocarcinoma. Clin Cancer Res. 2006;12:3344–54. doi: 10.1158/1078-0432.CCR-05-2336. [DOI] [PubMed] [Google Scholar]
- 17.Bussey KJ, Kane D, Sunshine M, et al. MatchMiner: a tool for batch navigation among gene and gene product identifiers. Genome Biol. 2003;4:R27. doi: 10.1186/gb-2003-4-4-r27. [DOI] [PMC free article] [PubMed] [Google Scholar]
- 18.Schadt EE, Li C, Su C, Wong WH. Analyzing high-density oligonucleotide gene expression array data. J Cell Biochem. 2000;80:192–202. [PubMed] [Google Scholar]
- 19.Qian Y, Liu KJ, Chen Y, Flynn DC, Castranova V, Shi X. Cdc42 regulates arsenic-induced NADPH oxidase activation and cell migration through actin filament reorganization. J Biol Chem. 2005;280:3875–84. doi: 10.1074/jbc.M403788200. [DOI] [PubMed] [Google Scholar]
- 20.AJCC. Cancer Staging Manual. Springer; 2002. [Google Scholar]
- 21.Rhodes DR, Yu J, Shanker K, et al. ONCOMINE: a cancer microarray database and integrated data-mining platform. Neoplasia. 2004;6:1–6. doi: 10.1016/s1476-5586(04)80047-2. [DOI] [PMC free article] [PubMed] [Google Scholar]
- 22.Velculescu VE, Zhang L, Vogelstein B, Kinzler KW. Serial analysis of gene expression. Science. 1995;270:484–7. doi: 10.1126/science.270.5235.484. [DOI] [PubMed] [Google Scholar]
- 23.Su AI, Welsh JB, Sapinoso LM, et al. Molecular classification of human carcinomas by use of gene expression signatures. Cancer Res. 2001;61:7388–93. [PubMed] [Google Scholar]
- 24.van ’t Veer LJ, Dai H, van de Vijver MJ, et al. Gene expression profiling predicts clinical outcome of breast cancer. Nature. 2002;415:530–6. doi: 10.1038/415530a. [DOI] [PubMed] [Google Scholar]
- 25.Paik S, Shak S, Tang G, et al. A multigene assay to predict recurrence of tamoxifen-treated, node-negative breast cancer. N Engl J Med. 2004;351:2817–26. doi: 10.1056/NEJMoa041588. [DOI] [PubMed] [Google Scholar]
- 26.McShane LM, Altman DG, Sauerbrei W, Taube SE, Gion M, Clark GM. REporting recommendations for tumor MARKer prognostic studies (REMARK) Breast Cancer Res Treat. 2006;100:229–35. doi: 10.1007/s10549-006-9242-8. [DOI] [PubMed] [Google Scholar]
- 27.McShane LM, Altman DG, Sauerbrei W, Taube SE, Gion M, Clark GM. Reporting recommendations for tumor marker prognostic studies (remark) Exp Oncol. 2006;28:99–105. [PubMed] [Google Scholar]
- 28.Espinosa E, Vara JA, Redondo A, et al. Breast cancer prognosis determined by gene expression profiling: a quantitative reverse transcriptase polymerase chain reaction study. J Clin Oncol. 2005;23:7278–85. doi: 10.1200/JCO.2005.01.4746. [DOI] [PubMed] [Google Scholar]
- 29.Hood L, Heath JR, Phelps ME, Lin B. Systems biology and new technologies enable predictive and preventative medicine. Science. 2004;306:640–3. doi: 10.1126/science.1104635. [DOI] [PubMed] [Google Scholar]
- 30.Mager J, Schultz RM, Brunk BP, Bartolomei MS. Identification of candidate maternal-effect genes through comparison of multiple microarray data sets. Mamm Genome. 2006;17:941–9. doi: 10.1007/s00335-006-0034-6. [DOI] [PubMed] [Google Scholar]
- 31.Rajeevan MS, Vernon SD, Taysavang N, Unger ER. Validation of array-based gene expression profiles by real-time (kinetic) RT-PCR. J Mol Diagn. 2001;3:26–31. doi: 10.1016/S1525-1578(10)60646-0. [DOI] [PMC free article] [PubMed] [Google Scholar]
- 32.Bosotti R, Locatelli G, Healy S, et al. Cross platform microarray analysis for robust identification of differentially expressed genes. BMC Bioinformatics. 2007;8(Suppl 1):S5. doi: 10.1186/1471-2105-8-S1-S5. [DOI] [PMC free article] [PubMed] [Google Scholar]
Associated Data
This section collects any data citations, data availability statements, or supplementary materials included in this article.