

Abstract
There are currently no effective therapies for metastatic melanoma and targeted immunotherapy results in the remission of only a very small percentage of tumors. In this study we demonstrate that the non-canonical Wnt ligand, Wnt5A, can increase melanoma metastasis in vivo while downregulating the expression of tumor-associated antigens important in eliciting cytotoxic T lymphocyte (CTL) responses (eg., MART-1, GP100, tyrosinase). Melanosomal antigen expression is governed by MITF, PAX3 and SOX10, and is inhibited upon STAT3 activation, via decreases in PAX3 and subsequently MITF expression. Increasing Wnt5A in Wnt5A-low cells activated STAT3, and STAT3 was decreased upon Wnt5A knockdown. Downstream targets such as PAX3, MITF amd MART-1 were also affected by Wnt5A treatment or knockdown. Staining of a melanoma tissue array also highlighted the inverse relationship between MART-1 and Wnt5A expression. PKC activation by phorbol ester mimicked Wnt5A effects, and Wnt5A treatment in the presence of STAT3 or PKC inhibitors did not lower MART-1 levels. CTL activation studies demonstrated that increases in Wnt5A correspond to decreased CTL activation and vice versa, suggesting that targeting Wnt5A before immunotherapy may lead to the enhancement of current targeted immunotherapy for patients with metastatic melanoma.
Keywords: Melanoma, immune surveillance, Wnt5A, STAT3, MART-1, GP100
Introduction
Effective therapy for metastatic melanoma continues to elude us. Experimental therapies include manipulating tumor-infiltrating T lymphocytes to boost immune recognition of melanoma cells via specific antigens, as well as enhancing the antigenicity of tumor cells themselves (1–4). Melanoma–associated antigens include MART-1, TYRP-1 (gp75) or gp100 (SILV), the transcription of which is governed by the transcription factors SOX10, PAX3 and MITF. A recent study demonstrated that melanomas could be separated into three dominant cohorts based on their MITF status, motility and proliferation (5). Of these samples (known as the Mannheim data set), Cohort A consisted of highly proliferative melanoma cells with low metastatic potential and high MITF expression and Cohort C of weakly proliferative cells with high metastatic potential and low MITF expression. Another key discriminator between these cohorts was the gene Wnt5A, which was more highly expressed in the metastatic samples.
We have previously implicated the gene Wnt5A in melanoma progression (6–8). Wnt5A is a non-canonical Wnt protein that signals via Ca2+/PKC (9). This gene was downregulated in melanomas that had better outcome, and its overexpression correlated with more aggressive disease (7). Interestingly, in the initial study by Bittner et al, the gene Melan-A/MART-1 (Melanoma Antigen Recognized by T cells-1) was second only to Wnt5A in its ability to distinguish less aggressive tumors from more aggressive ones and was inversely correlated with Wnt5A expression. Wnt5A overexpression or knockdown using siRNA in melanoma cells identified several genes that were suppressed by Wnt5A overexpression, including metastasis suppressors such as Kiss-1 (8). Further analysis of this data set has also highlighted the inverse relationship between Wnt5A and various tumor-associated antigens of melanocytic lineage, including TYRP-1, DCT, gp100, and MART-1. The implication of these data is that the overexpression of Wnt5A correlates with the downregulation of potent melanocytic antigens such as MART-1, and may actually regulate their expression in melanoma. In this study, we examine the mechanism by which Wnt5A regulates the expression of these tumor-associated antigens and the implications of this regulation for melanoma therapy.
Materials and Methods
Data Analysis of the Mannheim data set
The Mannheim data is available from NCBI’s gene expression omnibus (www.ncbi.nlm.nih.gov/geo), under GEO Series accession #GSE4845. This data set was generated from microarray analysis of 45 primary cultures of melanoma biopsies, using Affymetrix HG-U133 microarray chips. A Student’s two-tailed T-test (assuming equal variance) was used to determine statistical significance of variation of the specific genes among the cohorts.
Cell Lines
UACC-1273EV, UACC1273-4-3 and UACC1273-4-7, as well the cell lines UACC647, M93-047, and UACC903 have been previously described (8). T2 is a lymphoblastoid cell line deficient in TAP function, whose HLA class I proteins can be easily loaded with exogenous peptides (10) and was grown in RPMI, as were B16 melanoma cells. The melanoma cell line Mel526 (also grown in RPMI) was a generous gift from Drs. Steven A. Rosenberg and John Wunderlich, (Surgery Branch, National Cancer Institute, National Institutes of Health, Bethesda, MD) and expresses high levels of MART-1. All media was supplemented with 10% fetal bovine serum, 100 units/ml penicillin/streptomycin, and 2mM L-glutamine (all from GIBCO/BRL, Grand Island, NY). Human T lymphocytes were cultured in RPMI with 10% human AB serum (Sigma, St. Louis, MO), 0.05μM mercaptoethanol, 0.1mM non-essential amino acids, 0.1mM sodium pyruvate, 10mM HEPES (all from Invitrogen, Grand Island, NY) and 300 IU/ml IL-2 (Hoffmann-LaRoche). Murine splenocytes, collected from 8 week old Pmel-1 TCR Tg mice, were stimulated as described below and cultured in the same media as human T lymphocytes with the exception that human AB serum was replaced with 10% FCS. All T-cell cultures were supplemented with 100 units/ml penicillin/streptomycin and 2mM L-glutamine (Invitrogen).
Peptides and reagents
MART-1 peptide 27–35 (AAGIGILTV) (11, 12) was synthesized at the University of Maryland Biopolymer Laboratory. Rhodamine-tagged Wnt5A siRNA was designed as previously described (8) and purchased from Qiagen, Valencia, CA. Lipofectamine Plus was from Invitrogen, recombinant murine Wnt5A was from R and D Biosystems, Minneapolis, MN. Gö6983 (a specific inhibitor of PKC α, β, γ, δ, and ζ, but not μ) and the STAT3 inhibitor peptide were purchased from Calbiochem (San Diego, CA).
Transfections and Treatments
SiRNA transfections were performed as previously described; “mock” conditions refer to control siRNAs at 48h (8). RWnt5A was reconstituted in PBS containing 0.1% endotoxin-free BSA (10μg/mLstock), and used at 0.2μg/ml for human melanoma cells and 0.05 μg/ml for mouse B16 melanoma cells. PKC inhibition studies using Gö6983 (1μM) were performed as previously described (8). Cells were pre-treated with inhibitor for 1 hour and then treated with rWnt5A for 12–16 hours. For vehicle controls, cells were treated with equivalent amounts of DMSO. For STAT3 inhibitor studies, cells were pretreated for 6–12 hours with 100 μg/ml of STAT3 inhibitor peptide in serum-free media (SFM), after which rWnt5A was added for 12–16 hours. For vehicle controls, cells were treated with equivalent amounts of sterile water. All experiments were performed in triplicate, and incubated in a 37°C, 5% CO2 incubator.
Western Blotting
Western blots were performed as previously described (8). Sources of antibody and concentrations used are as follows: phospho-pan-PKC (1:1000), phospho-STAT3 (ser727) (1:500), β-tubulin (1:1000) antibodies were obtained from Cell Signaling Technology Inc (Danvers, MA), biotinylated Wnt5A antibody (1:100, R&D), MART-1 mAb clone M2–7C10 (1:500, LabVision, Fremont, CA), PAX3 antibody (1:250, Abcam, Cambridge, MA), gp100 antibody (1:500, Novus Biologicals Littleton, CO).
Realtime PCR Analysis
Primers were designed to generate products of less than 200bp for efficient analysis, and are listed below:
| Vimentin: | forward 5′- ATTCCACTTTGCGTTCAAGG -3′, reverse 5′- CTTCAGAGAGAGGAAGCCGA -3′ |
| CD44: | forward 5′-CCATCTGTGCAGCAAACAAC- 3′, reverse 5′-GAGCTGAAGCATTGAAGCAA -3′ |
| Wnt5A: | forward 5′-TAAGCCCAGGAGTTGCTTTG- 3′, reverse 5′-GCAGAGAGGCTGTGCTCCTA-3′ |
| MART-1: | forward 5′-AGAAGATGCCCACAAGAAGG- 3′, reverse 5′-CGCTGGCTCTTAAGGTGAAT-3′ |
| SOX10: | forward 5′-AAAGACCACCCGGACTACAA- 3′, reverse 5′-TTGCCGAAGTCGATGTGA-3′ |
| IL-6R: | forward 5′-GGGACCATGGAGTGGTAGC- 3′, reverse 5′-ACTGGTCAGCACGCCTCT-3′. |
cDNA was transcribed from 1 μg of total RNA according to the manufacturer’s protocol (Applied Biosystems, Foster City, CA), and 200ng was used for real time RT-PCR. Samples were normalized to 18S, using universal 18S primers (Ambion, Austin, TX), and the ratio of signal to 18S and the fold increase as compared to controls was calculated using the calculation 2 −ΔΔCT according to the manufacturer’s protocol (Perkin Elmer).
Immunofluorescence and Immunohistochemistry
Cells were fixed and blocked as previously described (7) and incubated overnight at 4°C in phospho-STAT3Tyr705 primary antibody (Cell Signaling Technology Inc), and then washed (three 5 minute washes in PBS-T) and stained (1 hour, RT) with Alexafluor 594 anti-rabbit IgG (Molecular Probes, Eugene, OR). Slides were washed, then mounted in Prolong gold anti-fade (Molecular Probes) and imaged using a Zeiss Axiovert microscope (Thornwood, NY). Tissue arrays were obtained from the Tissue Array Research Program of the National Cancer Institute, Bethesda, MD and the Moffit Cancer Center, University of South Florida, Tampa, FL. Deparaffinization, antigen-retrieval and staining of tissue arrays were performed as previously described (13, 14). Scoring of tissue arrays was performed by a board-certified pathologist (SMH).
Flow cytometry
HLA-A2-FITC monoclonal antibodies and FITC and PE IgG isotype controls were obtained from BD PharMingen (San Diego, CA). Other antibodies and controls used were: MART-1 mAb clone M2–7C10 (LabVision, Fremont, CA), rat anti-mouse IgG-FITC (ICN Costa Mesa, CA), CD8-PE and human IgG-PE (R & D Biosystems). Tumor cells and T cells were stained for the cell surface marker HLA-A2 and tumor cells only were stained internally for MART-1. For surface staining, 2×10⁵ cells were harvested directly or first trypsinized, followed by washing in PBS containing 1% BSA, 0.1% sodium azide (FACS buffer), and incubated with target antibody or control FITC/PE isotype control antibodies for 30 min on ice. Intracellular staining for MART-1 was performed by fixing cells in 2% paraformaldehyde for 10 min at 4°C, and permeabilizing cells with 0.02% saponin (Sigma) in PBS containing 0.2% FCS (fetal calf serum) before staining with primary antibody (30 minutes, 4°C) followed by secondary anti-mouse IgG-FITC antibody (30 minutes, 4°C). Stained cells were washed and resuspended in 600μl PBS, and for each histogram, 5000 cells were counted on a Becton-Dickinson FACScan. Values given in tables reflect the mean channel of fluorescence of the cells.
Cytokine release assays
2.5×10³ human melanoma cells were cultured in a 96-well flat bottom microtiter plate (Corning, Inc, Corning, NY) for 24–48 hours, after which supernatant was collected and analyzed by ELISA for IL-6 (Invitrogen), VEGF and IL-10 (both from R & D Biosystems) according to the manufacturer’s instructions.
HLA-A2+ CD8+ T cell isolation
CD8+ T-lymphocytes were isolated from anti-CD3 (200ng/ml), anti-CD28 (1 μg/ml) stimulated HLA-A2 positive donor T-cells using a CD8 isolation kit (Dynal, Invitrogen). Donor T-cells were obtained from healthy volunteers under IRB protocol #NIA2003-054. Anti-CD8-coated beads were added to T-cells in a ratio of 1ul beads per 1×10⁸ T cells in Dynal buffer (2mM EDTA, 0.1% BSA in PBS) and incubated for 30 min at 4°C. CD8+ T-cells were magnetically isolated and washed (0.1% BSA in PBS). Finally, a detach solution (Dynal, Invitrogen) at a 1:10 dilution (1 hour, room temperature) was used to remove the beads attached to the CD8+ T-cell fraction. The resulting population, consisting of >90% CD8+ T cells as analyzed by FACS, was electroporated with IVT-capped anti-MART-1 TCR α and β mRNA.
In vitro transcription and transfection of capped mRNA
mRNA encoding GFP was prepared from plasmid pGEM4Z/EGFP/A64 and mRNA encoding TCRα and β chains of MART-1 were prepared from plasmids pGEM4Z/TCRα/A64 and pGEM4Z/TCR β/A64 (15, 16) (kindly provided by Dr. Richard Morgan and Dr. Cyrille Cohen, Surgery Branch, National Cancer Institute, Bethesda, Maryland). Briefly, 10 μg of DNA encoding GFP, anti-MART-1 TCRα or TCRβ was linearized with SpeI and run on a 1% agarose gel, after which linearized DNA was purified using the QIAquick gel extraction kit (Qiagen InC). IVT RNA was transcribed using the mMESSAGE mMACHINE High Yield Capped RNA Transcription Kit (Ambion Inc, Austin TX) and purified using LiCl (supplied in the mMESSAGE mMACHINE kit). Denaturing gel electrophoresis was used to ensure a single RNA product before electroporation. 10 μg of RNA was electroporated into 5×10⁶ stimulated T-cells or CD8+ T-cells using the human T-cell Nucleofector kit (Amaxa Biosystems, Gaithersburg, MD). Electroporated cells were >90% positive for GFP as analyzed by FACS, 8 hours post electroporation. T-cells electroporated with anti-MART-1 TCRα/β RNA were used in an antigen presentation assay with human melanoma cells 8 hours post-electroporation.
In vitro antigen presentation assays for endogenous MART-1
Anti-MART-1 TCR expressing T cells or CD8+ T cells were co-cultured with melanoma cells expressing high and low amounts of Wnt5A or stimulated with MART-1 peptide-pulsed (9μg/mL) T2 cells. To test for effects of Wnt5A in priming T cell activation, melanoma cells were pre-treated with rWnt5A or Wnt5A siRNA and used as effectors in T cell activation assays. Briefly, 5×10⁴ irradiated (30Gy) melanoma cells were co-cultured in triplicate in a 96-well microtiter plate with 1×10⁵ responder T cells in 200μl T cell culture medium in a 96-well flat bottom plate. Cells were incubated at 37°C for 24 hours and supernatants were assayed by ELISA for interferon gamma according to the manufacturer’s instructions (Endogen, Rockford, IL). Each experiment was repeated in triplicate, and standard deviations are represented by error bars.
Mice
C57BL/6 mice and pMEL mice were housed at the National Institute of Aging animal facility, Baltimore, MD. Animal care was provided according to the Guide for the Care and Use of Laboratory Animals (ref: National Research Council. Guide for the Care and Use of Laboratory Animals. Washington, DC: National Academy Press; 1985. NIH publication number. 86–23).
Preparation of gp100 specific T cells from pMEL mice and in vitro antigen presentation assays for endogenous gp100
Mice were vaccinated subcutaneously twice at 3-week intervals with 10μg human gp10025–33 peptide emulsified in 100μl incomplete Freund’s adjuvant (IFA). Three weeks after the second vaccination, splenocytes were cultured with 20 IU/ml rhIL-2 and 1μg/ml gp10025–33 as previously described (17) and used on day 7 after the initiation of the culture. For in vitro activation of T cells, 1×10⁴ B16 melanoma cells treated or untreated with 50ng/ml rWnt5A were irradiated (30Gy) and co-cultured in triplicate with 5×10⁴ pMEL responder T cells in a 96-well flat bottom microtiter plate (Corning, Inc, Corning, NY) in 200μl T cell culture medium. Cells were incubated at 37°C for 24 hours and supernatants were assayed by ELISA for IFNγ according to the manufacturer’s instructions (Endogen, Rockford, IL). Values are the averages of triplicate points, with S.E.M. Control experiments indicated that Wnt5A could not suppress T-cell activation in cells that are pulsed with GP100 peptide (Supplementary Figure 3). All assays were repeated at least in triplicate.
In vivo tail-vein metastasis assays
2×10⁵ B16-F10 murine melanoma cells treated with 0.05μg/ml of rWnt5A protein for 16 hours (experimental group) or untreated (control group), were inoculated into the tail vein of 8-week old C57BL/6 mice (Jackson Laboratories, Alameda, CA). The experimental group received bi-weekly injections of rWnt5A (75ng/mouse) starting the 3rd day after primary tumor cell inoculation. Lung metastases were scored 2 weeks after the inoculation of cells.
Wound-healing Assays
B16 melanoma cells were plated in slide chambers coated with fibronectin or collagen. After cells reached confluency, a scratch was made through the matrix using a sterile pipette tip. Photographs of the scratch were taken at the indicated time points.
Statistical Analysis
All in vitro assays were repeated in triplicate, or more, and S.E.M was calculated as shown in the individual figures (error bars). For staining of tissue arrays, statistical analysis of MART-1 and Wnt5A expression across tumor types was calculated using a test for linear trends in proportions. For in vivo mouse assays a Fisher’s exact test was used to calculate significance between control and Wnt5A treated groups.
Results
Wnt5A expression is inversely correlated with melanosomal antigens
We examined the Mannheim data set (5) for the relationship between melanosomal antigens and Wnt5A expression. Wnt5A was highly expressed in the more metastatic Cohort C, but not in the less metastatic Cohorts A and B (Figure 1A). Conversely, expression of MART-1 (Figure 1B), MITF, DCT, TYRP1 and SILV (GP100) (Supplementary Figure 1C—F) was significantly lower in Cohort C than in A and B. To confirm these observations in patient biopsies, we performed immunohistochemistry on a melanoma tissue microarray (NCI- TARP). These lesions were first scored for Wnt5A and MART-1 status independently. Staining was scored as negative, weak or positive. Overall scoring for the staining of each of these antigens confirmed that Wnt5A expression is increased in subcutaneous and visceral metastases of melanoma as compared to primary melanoma and nevi. On the other hand, MART-1 staining decreases from positivity in almost all nevi to positivity in only about half of all visceral metastases (Supplementary Table 1). We then compared Wnt5A and MART-1 levels in each corresponding patient sample on the tissue array (examples are shown in Figure 1 C). Scoring was performed as follows: 33% of nevi (n=43) had equal staining for Wnt5A and MART-1 and stained positive for both antigens. However, in the 67% of nevi where MART-1 and Wnt5A staining was unequal, every lesion expressed higher MART-1 than Wnt5A (Table 1). 56% of primary melanomas (n=39) were equivalently stained for MART-1 and Wnt5A, and most were either weakly positive (n=11) or positive (n=9) for both antigens. 2 tumors were negative for both antigens. In the unequally stained primaries, 18% (n=7) expressed more Wnt5A than MART-1, and 27% expressed less (n=10). 44% (n=8) of subcutaneous metastases (total=20) exhibited equal levels of MART-1 and Wnt5A, 28% scored higher for Wnt5A than MART-1 (n=6), and 28% scored lower (n=6). 50% of visceral metastases (n=16) exhibited equal levels of Wnt5a and MART-1 (n=8), 44% had higher Wnt5A (n=7) and 6% (n=1) had lower Wnt5A than MART-1. However, we found a striking discrepancy between staining for Wnt5A in lymph node metastases and other types of melanoma metastases. 51% of lymph node metastases (n=23) stained equivalently for Wnt5A and MART-1. Of these over half (23% of total) stained negative for both MART-1 and Wnt5A. In the 49% that had differential staining for Wnt5A and MART-1, only 4% expressed less Wnt5A than MART-1. To confirm that these observations were not due to selection bias, we stained a melanoma TMA obtained from a different institution (the Moffit Cancer Center). We confirmed the same trend: in the 16 visceral metastases scored, 10 were positive for both Wnt5A and MART-1, 5 had greater Wnt5A staining than MART-1 staining, and only 2 had weak Wnt5A staining as compared to strong MART-1 staining. In the 30 lymph node metastases scored, the reverse was true: 5 had stronger Wnt5A staining than MART-1, 13 had stronger MART-1 staining than Wnt5A. Adding both sets of lesions gave a ratio of Wnt5A high: MART-1 low samples of 12:3 in visceral metastases as compared to 6:23 in lymph node metastases confirming our observation of a striking difference in Wnt5A expression in different types of metastatic lesions. These lesions were not selected based on MART-1 status and the staining results are consistent across two different arrays composed of samples from several different institutes, making artificial bias unlikely. Furthermore, these results were supported by the demonstration that transfection of Wnt5A-low UACC1273 cells with a plasmid overexpressing WNT5A results in a dramatic downregulation of MART-1 RNA by 24h (Figure 1D).
Figure 1. Wnt5A and the expression of melanosomal antigens are inversely correlated.

Gene expression of Wnt5A and melanosomal antigens were examined across a set of 45 samples that have already been characterized into cohorts of high (cohort C) versus low (Cohorts A and B) motility. The Y-axis represents normalized signal intensity for each probe set. A) Wnt5A is highly expressed in metastatic melanoma cells, Cohort C, but not in samples that are less motile (Cohorts A and B). Conversely, the melanosomal antigen MART-1 B), is decreased in the more metastatic Cohort C. Samples in each cohort are ordered according to increasing Wnt5A expression. C) MART-1 and Wnt5A staining in melanoma. MART-1 staining tends to be more evident in nevi and primary lesions, where Wnt5A can be found more commonly in melanoma metastases. D) Melanoma cells stably transfected with Wnt5A (UACC1273-4-3 and -4-7) show increases in Wnt5A and decreases in MART-1 expression as compared to empty vector controls (set as 1 on the log scale).
Table 1. Distribution of Wnt5A and MART-1 Staining Intensity Among Tumor Stage.
In a sample-to-sample comparison of Wnt5A and MART-1 staining, biopsies were scored as either equal intensity for Wnt5A and MART-1, or higher Wnt5A than MART-1, or higher MART-1 than Wnt5A. Where staining was equal, the groups were further subdivided into positive, weak or negative. Numbers shown are percentages of the total number of specimens scored; total number is given in parentheses next to the identification of tumor stage. P values were obtained by performing a Fisher’s Exact test between visceral metastases and all other tumor stages. P values show significance between nevi (p<5 × 10⁻²⁶), primary (p<1 × 10⁻⁵), subcutaneous metastases (p<2 × 10⁻⁵), lymph node metastases (p<1 ×10⁻¹⁵) and visceral metastases.
Wnt5A regulates MART-1 expression via STAT3, a negative regulator of MART-1
MART-1 transcription is controlled by MITF, which in turn is regulated by the transcription factor PAX3 (18). PAX3 expression can be downregulated by STAT3 activation (19). PKC has been implicated in the phosphorylation of STAT3 on its serine727 residue (20), and Wnt5A activates PKC (21). We hypothesized that Wnt5A activation of PKC could lead to STAT3 phosphorylation, and ultimately MART-1 downregulation (Figure 2A).
Figure 2. Wnt5A activation of STAT3.

A) Wnt5A can activate PO4-PKC, which can activate STAT3. STAT3 has been shown to inhibit PAX3 expression, which in turn is required for MITF, and subsequently MART-1 transcription. This schematic combines data from various studies into a hypothetical schematic of how Wnt5A may activate STAT3 and result in the downregulation of MART-1. B) Transfection of Wnt5A into Wnt5A-low cell lines results in an increase in nuclear, PO4-STAT3 (tyr705) as compared to the empty vector control. Conversely, the transfection of WNT5A siRNA into Wnt5A-high cell lines results in a decrease in nuclear PO4-STAT3 expression. Staining shown is in the rhodamine channel only C) Western analysis confirms these results, where treating Wnt5A-low melanoma cells with rWnt5A results in increases in PO4-STAT3(ser727) and PO4-PKC and decreases in MART-1. The reverse is true when Wnt5A-high cells are treated with Wnt5A siRNA: Levels of PO4-PKC and PO4-STAT3 decrease, and MART-1 expression is restored. D) Pax3 and MITF expression is similarly regulated by Wnt5A, decreasing upon treatment with rWnt5A, and increasing upon WNT5A knockdown.
Upon transfection with WNT5A, UACC1273 cells showed a dramatic and sustained increase of nuclear, phosphorylated STAT3 (Figure 2B, UACC1273). Conversely, treatment of Wnt5A-high M93-047 cells with siRNA against WNT5A resulted in a loss of PO4-STAT3 (Figure 2B, M93-047). Western analysis confirms that there was a dramatic increase in the levels of PO4-STAT3 (ser727) upon treatment with recombinant Wnt5A (rWnt5A) (Figure 2C- PO4-STAT3). Treatment of UACC903 Wnt5A-high cells with Wnt5A siRNA results in a significant decrease of PO4-STAT3 (Figure 2C). Furthermore, PO4-STAT3 increases corresponded to decreases in MART-1 expression, and PO4-STAT3 decreases corresponded to MART-1 increases (Figure 2C). It has been shown that STAT3 phosphorylation can decrease the expression of PAX3, which is required for MITF transcription. Treatment of Wnt5A-low cells with rWnt5A downregulated the expression of PAX3, and MITF (Figure 2D). Knockdown of Wnt5A with siRNA results in an increase in expression of both PAX3 and MITF (Figure 2D). These data imply that Wnt5A can modulate MART-1 expression, as well as that of MITF and PAX3.
Wnt5A requires STAT3 and PKC for MART-1 regulation
We have previously demonstrated that both rWnt5A and PMA treatment of Wnt5A-low melanoma cells results in a sustained increase of PKC activity (8). PMA treatment also increased the level of PO4-STAT3 (Ser727), which correlated with decreases in MART-1 (Figure 3A). Conversely, PKC inhibition of Wnt5A-high UACC903 melanoma cells resulted in reduced PO4-STAT3 (Ser727) levels, and increased MART-1 expression (Figure 3B). To ascertain whether PKC activation was required for Wnt5A-mediated STAT3 phosphorylation and MART-1 down-regulation, cells were pre-treated with the PKC inhibitor GÖ 6983 and then treated with rWnt5A. In the presence of PKC inhibitors, rWnt5A had no effect on either PO4-STAT3 or MART-1 (Figure 3C). Similarly, when cells were pre-treated with the STAT3 inhibitor peptide PpYLKTK-AAVLLPVLLAAP, subsequent treatment with rWnt5A in the continued presence of inhibitor did not alter MART-1 or PAX3 levels, indicating that Wnt5A signaling requires both PKC and STAT3 activation for the regulation of MART-1 (Figure 3D).
Figure 3. PKC and STAT3 activation are required for Wnt5A regulation of MART-1.
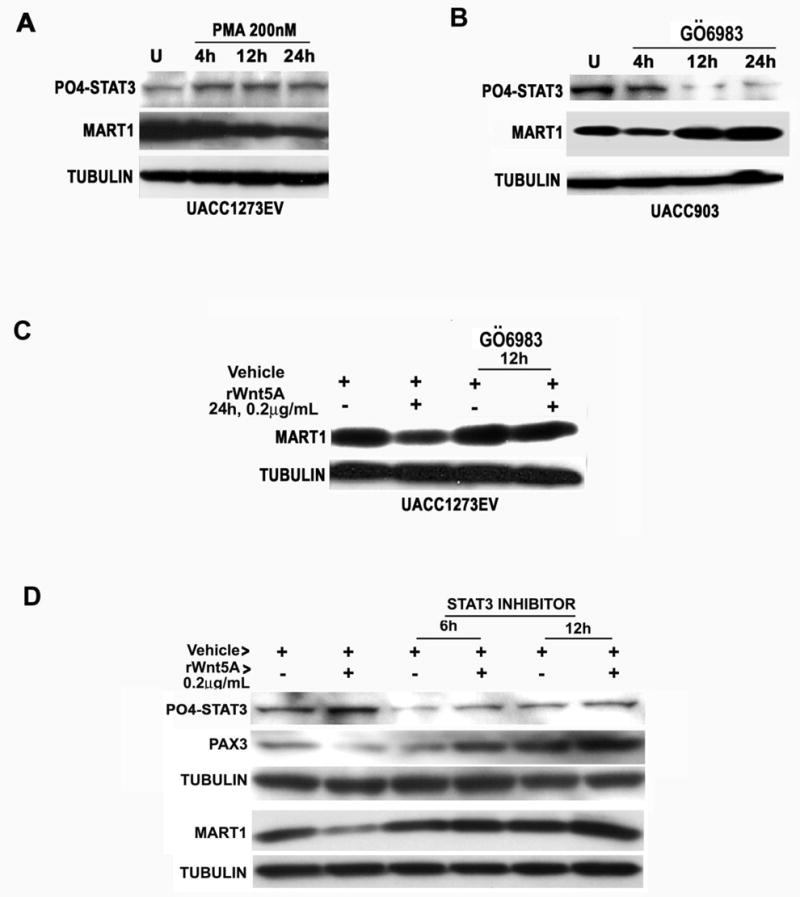
A) Treatment of Wnt5A-low, PKC-low UACC1273EV melanoma cells with phorbol ester results in an increase in PO4-STAT3 and a decrease in MART-1 expression. B) Inhibiting PKC in Wnt5A-high, PKC-high UACC903 melanoma cells results in a decrease in PO4- STAT3 and an increase in MART-1. C) Furthermore, treating Wnt5A low cells with a PKC inhibitor prior to rWnt5A treatment inhibits the ability of Wnt5A to decrease MART-1 expression. D) Treating Wnt5A-low cells with rWnt5A for 24 hours increases PO4-STAT3, and decreases PAX3 and MART-1. Inhibiting STAT3 prior to Wnt5A treatment for either 6 or 12 hours results in an inability of Wnt5A to activate STAT3 or decrease PAX3 and MART-1 expression.
Wnt5A renders melanoma cells less able to activate T-cells
Donor T-cells were transfected with capped mRNA coding for the α- and β-chains of the T-cell receptor for MART-1, according to the protocol of Cohen et al (15). These cells were then co-cultured with melanoma cells in which Wnt5A levels were manipulated. (Figure 4A, B). UACC903 cells have moderate to high levels of Wnt5A expression, but unlike other Wnt5A-high lines (e.g., UACC647), UACC903 also express some MART-1, albeit less than UACC1273EV cells (Figure 4B). Interferon-γ release was assayed as a measure of T-cell activation and demonstrated that Wnt5A-high, MART-1 negative UACC647 cells could not activate T cells (Figure 4C), whereas UACC1273EV cells (low Wnt5A, high MART-1) could. Upon incubation of UACC1273EV cells with rWnt5A, they lose their ability to activate T cells (Figure 4C). RWnt5A alone has no effect on IFNγ release, excluding the possibility that Wnt5A in the media could affect T cells directly (Figure 4C). UACC903 cells, which express both Wnt5A and low levels of MART-1, are also able to efficiently activate T cells (Figure 4C), but inhibiting Wnt5A with siRNA greatly increased T-cell activation by these cells (Figure 4C). Mel526 cells, and T2 cells pulsed with MART-1 peptide, were used as positive controls for T-cell activation.
Figure 4. Effects of Wnt5A on T cell activation.

A) Melanoma cells were tested for their MHC class I phenotype, and cells that were HLA-02.01 positive were used in subsequent assays. B) Cells were also tested for MART-1 status. Wnt5A-low UACC1273EV cells expressed abundant MART-1, whereas Wnt5A-high UACC647 cells did not. UACC903 cells (which express more Wnt5A than UACC1273EV cells, but not as much UACC647 cells) expressed some MART-1 (albeit less than the UACC1273EV cells). C) MART-1-positive CD8+ T cells were generated as described and co-cultured with melanoma cells. UACC647 cells, negative for MART-1, could not activate T cells as measured by interferon gamma release. Wnt5A-low UACC1273EV cells were able to activate T cells, but when treated with rWnt5A, lost the ability to do so. Treating UACC903 cells with Wnt5A siRNA, on the other hand, resulted in a significant increase in the ability of these cells to activate T cells. Mel526 cells and T2 cells pulsed with MART-1 peptide are shown as positive controls for T cell activation. T-cells incubated with rWnt5A only, and no melanoma cells are shown as a control for the lack of rWnt5A effect on IFNγ release.
Increases in Wnt5A cause increases in metastases in vivo
B16 melanoma cells were assayed in vitro for expression of Wnt5A, and were shown to express very little Wnt5A (data not shown). B16 cells were then treated with rWnt5A and analyzed for the expression of the SOX10 transcription factor (Figure 5A), and also for increases in PO4-PKC and concomitant downregulation of gp100 (Figure 5B). The downregulation of gp100 upon treatment of B16 cells with rWnt5A was associated with a decreased ability of B16 cells to activate gp100-specific T cells (Figure 5C). Gp100 specific T-cells were isolated from pMEL transgenic mice as described in the Methods section. Wnt5A treatment does not cause a general immunosuppressive effect, as gp100-pulsed EL4 cells continue to activate gp100 specific T-cells even in the presence of rWnt5A (Supplementary Figure 3).
Figure 5. Wnt5A is able to mediate metastasis in vivo as well as in vitro.

A) SOX10 expression could be significantly down-regulated in B16 melanoma cells upon 24 hours of rWnt5A treatment as demonstrated by real-time PCR. B) Treatment of B16 cells with rWnt5A resulted in a dramatic increase in PO4-PKC and a decrease in gp100 expression. C) The presentation of B16 melanoma cells to gp100 positive CD8+ T cells resulted in an activation of the T cells, and treatment of these cells with rWnt5A decreases this activation. D) Wnt5A increases the in vivo metastasis of B16 melanoma cells via the tail-vein. 10 out of 10 rWnt5A-treated mice had lung metastases, of which only three had less than 50. Only 3 of the control mice had any metastases at all with only one having over 50. 5 out of 10 of the lungs are shown as representations below, and underlined lungs are the outliers of each group. In the rWnt5A-treated lungs, arrows indicate examples of lightly pigmented metastases not often seen in the control group.
Upon treatment with rWnt5A, B16 melanoma cells demonstrated increases in CD44 and vimentin, two molecules we have previously shown to be increased by Wnt5A in human cells and associated with increased melanoma metastases (Supplementary Figure 4A). These changes correlated with increases in B16 cell motility, as measured by an in vitro wound-healing assay (Supplementary Figure 4B). Briefly, cells were grown to confluency on a fibronectin-coated dish, and a scratch wound was inflicted on the monolayer. RWnt5A-treated B16 cells closed the wound much faster than untreated cells, indicating that Wnt5A increases the motility of these cells. Although B16 cells are known to be metastatic in vivo, we could decrease the number of metastases to almost zero by decreasing both the number of cells injected into the mouse, and the time allowed for the mice to develop metastases. B16 cells were pre-treated with either a vehicle control or rWnt5A and 2×10⁵ cells were injected via the tail vein into C57BL/6 mice. Injections of 75ng of rWnt5A per mouse were given twice a week to the mice bearing rWnt5A-treated B16 cells. After two weeks, mice were sacrificed and scored for lung metastases. 100% of Wnt5A-treated mice had metastases, and most (7/10) had too many metastases to count (scored as “greater than 50”). In contrast, 3/10 mice injected with untreated B16 cells had metastases (p<0.01), only one of which had over 50 metastases (Figure 5D). Although many of the individual metastatic colonies are highly pigmented, several others showed lighter pigment (Figure 5D, arrows). This is a phenomenon we have observed with cultured cells upon treatment with Wnt5A, and may be attributable to decreases in melanosomal antigens involved in melanin production (Supplementary Figure 2). These data clearly demonstrate the ability of Wnt5A to increase metastases in vivo. We also attempted to perform subcutaneous tumor growth and metastasis assays to determine the effects of co-transfecting gp100 specific T-cells with B16 melanoma cells in the presence or absence of rWnt5A. However, rWnt5A caused such severe ulceration of the primary lesion, that we could not draw any conclusions from these assays.
Discussion
We have previously demonstrated that Wnt5A signaling increases melanoma cell motility (7, 8) and here, we confirm this finding in vivo. We show here that the ratio of Wnt5A positive to MART-1 negative tumors increased dramatically as tumors progressed. A striking exception to this rule was in lymph node metastases, where most tumors had lower Wnt5A expression than MART-1 expression. Much discussion has focused on the origins of metastases in melanoma. Studies have shown that in animal models of melanoma, pulmonary metastases occur even in the absence of lymph node metastases, underscoring a potential difference between hematogenous and lymphatic routes of tumor cell dissemination (22). In support of this, recent studies have shown that even though younger patients develop more sentinel lymph node metastases than older patients, outcome is poorer for older patients, due to increased visceral metastases (23). This may depend on the type of invasion, whether it is an “amoeboid” type of migration, which does not involve proteases, and is more likely to favor lymphatic dissemination, or whether the invasion is a mesenchymal-type invasion that requires the secretion of matrix-metalloproteinases and molecules such as CD44 (24, 25). If indeed the phenotype of invasion dictates the route of metastatic dissemination, these observations would account for why less than 30% metastases identified in the lymph nodes tend to be Wnt5A positive as opposed to 95% in the other metastatic subtypes. Importantly, these data indicate that Wnt5A may be modulating a very specific type of tumor invasion, which sentinel node imaging might overlook. How the expression levels of Wnt5A and MART-1 correlate to survival in melanoma patients is the subject of a larger ongoing study in our laboratory.
Tumor-associated antigens are used as targets for immunotherapy (11, 26). but the clinical success of targeted immunotherapy has been somewhat limited. We propose that this may be due to the presence of Wnt5A-positive tumor cells, prone to metastasis, which also express less MART-1 and other similar antigens. Indeed, overexpression of Wnt5A has been associated with poorer outcome for patients with both cutaneous and uveal melanoma (7, 27), where increased MART-1 expression in primary tumors is a predictor of more favorable outcome (28). In the present study, we have shown that the inverse relationship between the expression of Wnt5A and melanoma antigens is not simply a correlation, but is cause and effect. Although our current study has focused on MART-1, other antigens such as gp100, DCT and TYRP1, regulated by the same set of transcription factors (PAX3, SOX10 and MITF), show a similar inverse relationship to Wnt5A (Supplementary Figures 1, 2).
It has been shown that STAT3 activation results in a loss of PAX 3 expression (19). Several studies have implicated various PKC isoforms in the phosphorylation of STAT3 at serine727. Signaling via janus kinases activates PKC epsilon, which in turn phosphorylates STAT3 (29). Phorbol ester causes STAT3 activation, and inhibitors of PKC can ablate STAT3 in thyrocytes (30). Our current data support these observations and further, Wnt5A-mediated STAT3 activation did not occur in the presence of PKC inhibitors, demonstrating the necessity of PKC in this process. STAT3 is a known immunosuppressor (31), and melanoma cells that have activated STAT3 also secrete increased levels of immunosuppressive cytokines such as VEGF (32), IL10, and IL-6 (31). IL-6 expression can inhibit the maturation of dendritic cells, contributing to the immunosuppressive effects exerted by tumor cells (33). In our melanoma cells, increased Wnt5A expression corresponded to IL-6 release, but not IL-6 receptor status (Supplementary Figure 5A and B). Other studies have also identified a relationship between Wnt5A and IL-6 (34, 35). We believe that in our cells it is unlikely that increased IL-6 is acting to activate STAT3, due to high SOCS3 levels, and IL-6 receptor levels that do not correlate with increases in STAT3 (Supplementary Figure 5C).
In summary, we demonstrate for the first time that, in addition to promoting melanoma metastasis, Wnt5A can downregulate the expression of melanoma differentiation antigens via PKC and STAT3 activation. Although common, these are not the only antigens used as targets for immunotherapy. However, even other immunotherapeutic targets such as β-catenin, can also be affected by Wnt5A expression. Wnt5A can downregulate β-catenin expression, by promoting its degradation via a Siah2/APC dependent pathway (36, 37). In the current study, we focused on the part of the Wnt5A signaling pathway that involves PKC, but data from these other groups suggest that the effects of Wnt5A may be even more widespread, lending further credence to our proposal that targeting Wnt5A may enhance the current immunotherapy available for melanoma. Further, for viable immunotherapeutic targets that are Wnt5A-independent, our data suggest that these targets may be more appropriate targets upon which to focus. Current improvements to techniques such as the efficient generation of antigen-specific CTLs hold great promise for immunotherapy (4, 11), and our data suggest that the efficacy of such treatments could be improved upon by pretreatment with either STAT3 inhibitors or Wnt5A inhibitors.
Supplementary Material
Supplementary Figure 1. Expression of WNT5A and Melanosomal Antigens in the Mannheim data set.
Gene expression of WNT5A and melanosomal antigens were examined across a set of 45 samples that have already been characterized into cohorts of high (cohort C) versus low (Cohorts A and B) motility. The Y-axis represents normalized signal intensity for each probe set. A) WNT5A is highly expressed in metastatic melanoma cells, Cohort C, but not in samples that are less motile (Cohorts A and B). Conversely, the melanosomal antigens B) MART-1, C) MITF, D) GP100, E) DCT and F) TYRP1 are decreased in the more metastatic Cohort C. Samples in each cohort are ordered according to increasing Wnt5A expression.
Supplementary Figure 2. Wnt5A downregulation of melanosomal antigens results in decreases in pigmentation.
A) Phase contrast microscopy demonstrates that highly pigmented UACC1273 cells lose pigment expression when transfected with WNT5A (UACC1273 4–7) as compared to transfection with an empty vector control (UACC1273 EV). B) RT-PCR confirmation of decreases in TYRP1, MART-1 and MITF in Wnt5A high M93-047 and UACC647 cells as compared to Wnt5A-low UACC1273EV cells, or normal human melanocytes. C) Western analysis shows that Wnt5A-high lines have increased PO4-PKC and PO4-STAT3 and decreased MART-1 as compared to Wnt5A- low UACC1273EV cells.
Supplementary Figure 3. Wnt5A effects on T-cell activation are specific
A) When EL4 cells are pulsed with gp100 peptide, and presented to gp100 specific T-cells (from pMEL transgenic mice), Wnt5A cannot downregulate T-cell activation.
Supplementary Figure 4. Wnt5A increases the metastatic ability of B16 melanoma cells
A) Markers of Wnt5A-mediated metastasis, CD44 and Vimentin, were measured in B16 cells, and increased post rWnt5A treatment. B) B16 cells treated with rWnt5A are able to heal a scratch wound much faster than those treated with a vehicle control. C) Wnt5A increases the in vivo metastasis of B16 melanoma cells. 10 out of 10 rWnt5A-treated mice had lung metastases, of which only three had less than 50, and are represented by the numbers in parentheses. Only 3 of the control mice had any metastases at all with only one having over 50, giving a significant p value of p<0.01. The number of metastases present in the other two mice is noted in parentheses.
Supplementary Figure 5. IL-6 is not responsible for Wnt5A-mediated STAT3 activation in melanoma cells.
A) Melanoma cell lines release significant amounts of IL6, as measured by ELISA, however B) the expression of the IL6 receptor as measured by real time PCR varies greatly among melanoma lines and does not correlate to invasive capability or Wnt5A status. C) Furthermore, melanoma cells express high levels of SOCS3, a cytokine suppressor known to suppress IL6 signaling in melanoma cells.
Acknowledgments
We thank Drs. Suzanne Topalian, Suzanne Ostrand-Rosenberg, Paritosh Ghosh, Pat Morin, Nan-Ping Weng for helpful discussions and technical assistance, and Ms Karen Madara and Mr. Gary Collins for providing us with normal donor T cells. We thank the following members of the NCI Surgery Branch for their help with protocols, cells and reagents: Drs. Cyrille Cohen, John Wunderlich, Steven Rosenberg and Richard Morgan. This work was supported by funding from the Intramural Research Program of the National Institute on Aging.
References
- 1.Dissanayake SK, Thompson JA, Bosch JJ, et al. Activation of tumor-specific CD4(+) T lymphocytes by major histocompatibility complex class II tumor cell vaccines: a novel cell-based immunotherapy. Cancer Research. 2004;64:1867–74. doi: 10.1158/0008-5472.can-03-2634. [DOI] [PubMed] [Google Scholar]
- 2.Mansoor W, Gilham DE, Thistlethwaite FC, Hawkins RE. Engineering T cells for cancer therapy. British Journal of Cancer. 2005;93:1085–91. doi: 10.1038/sj.bjc.6602839. [DOI] [PMC free article] [PubMed] [Google Scholar]
- 3.Cross D, Burmester JK. Gene therapy for cancer treatment: past, present and future. Clinical Medicine & Research. 2006;4:218–27. doi: 10.3121/cmr.4.3.218. [DOI] [PMC free article] [PubMed] [Google Scholar]
- 4.Morgan RA, Dudley ME, Wunderlich JR, et al. Cancer Regression in Patients After Transfer of Genetically Engineered Lymphocytes. Science. 2006;314:126–9. doi: 10.1126/science.1129003. [DOI] [PMC free article] [PubMed] [Google Scholar]
- 5.Hoek KS, Schlegel NC, Brafford P, et al. Metastatic potential of melanomas defined by specific gene expression profiles with no BRAF signature. Pigment Cell Res. 2006;19:290–302. doi: 10.1111/j.1600-0749.2006.00322.x. [DOI] [PubMed] [Google Scholar]
- 6.Bittner M, Meltzer P, Chen Y, et al. Molecular classification of cutaneous malignant melanoma by gene expression profiling. Nature. 2000;406:536–40. doi: 10.1038/35020115. [DOI] [PubMed] [Google Scholar]
- 7.Weeraratna AT, Jiang Y, Hostetter G, et al. Wnt5a signaling directly affects cell motility and invasion of metastatic melanoma. Cancer Cell. 2002;1:279–88. doi: 10.1016/s1535-6108(02)00045-4. [DOI] [PubMed] [Google Scholar]
- 8.Dissanayake SK, Wade M, Johnson CE, et al. The Wnt5A/protein kinase C pathway mediates motility in melanoma cells via the inhibition of metastasis suppressors and initiation of an epithelial to mesenchymal transition. J Biol Chem. 2007;282:17259–71. doi: 10.1074/jbc.M700075200. [DOI] [PMC free article] [PubMed] [Google Scholar]
- 9.Kuhl M, Sheldahl LC, Malbon CC, Moon RT. Ca(2+)/calmodulin-dependent protein kinase II is stimulated by Wnt and Frizzled homologs and promotes ventral cell fates in Xenopus. J Biol Chem. 2000;275:12701–11. doi: 10.1074/jbc.275.17.12701. [DOI] [PubMed] [Google Scholar]
- 10.Zehn D, Cohen CJ, Reiter Y, Walden P. Efficiency of peptide presentation by dendritic cells compared with other cell types: implications for cross-priming. Int Immunol. 2006;18:1647–54. doi: 10.1093/intimm/dxl098. [DOI] [PubMed] [Google Scholar]
- 11.Kawakami Y, Rosenberg SA. Immunobiology of human melanoma antigens MART-1 and gp100 and their use for immuno-gene therapy. Int Rev Immunol. 1997;14:173–92. doi: 10.3109/08830189709116851. [DOI] [PubMed] [Google Scholar]
- 12.Skipper JC, Gulden PH, Hendrickson RC, et al. Mass-spectrometric evaluation of HLA-A*0201-associated peptides identifies dominant naturally processed forms of CTL epitopes from MART-1 and gp100. Int J Cancer. 1999;82:669–77. doi: 10.1002/(sici)1097-0215(19990827)82:5<669::aid-ijc9>3.0.co;2-#. [DOI] [PubMed] [Google Scholar]
- 13.Weeraratna AT, Becker D, Carr KM, et al. Generation and analysis of melanoma SAGE libraries: SAGE advice on the melanoma transcriptome. Oncogene. 2004;23:2264–74. doi: 10.1038/sj.onc.1207337. [DOI] [PubMed] [Google Scholar]
- 14.Leotlela PD, Wade MS, Duray PH, et al. Claudin-1 overexpression in melanoma is regulated by PKC and contributes to melanoma cell motility. Oncogene. 2007;26:3846–56. doi: 10.1038/sj.onc.1210155. [DOI] [PubMed] [Google Scholar]
- 15.Cohen CJ, Zhao Y, Zheng Z, Rosenberg SA, Morgan RA. Enhanced Antitumor Activity of Murine-Human Hybrid T-Cell Receptor (TCR) in Human Lymphocytes Is Associated with Improved Pairing and TCR/CD3 Stability. Cancer Res. 2006;66:8878–86. doi: 10.1158/0008-5472.CAN-06-1450. [DOI] [PMC free article] [PubMed] [Google Scholar]
- 16.Zhao Y, Zheng Z, Cohen CJ, et al. High-efficiency transfection of primary human and mouse T lymphocytes using RNA electroporation. Mol Ther. 2006;13:151–9. doi: 10.1016/j.ymthe.2005.07.688. [DOI] [PMC free article] [PubMed] [Google Scholar]
- 17.Schiavo R, Baatar D, Olkhanud P, et al. Chemokine receptor targeting efficiently directs antigens to MHC class I pathways and elicits antigen-specific CD8+ T-cell responses. Blood. 2006;107:4597–605. doi: 10.1182/blood-2005-08-3207. [DOI] [PMC free article] [PubMed] [Google Scholar]
- 18.Murisier F, Beermann F. Genetics of pigment cells: lessons from the tyrosinase gene family. Histol Histopathol. 2006;21:567–78. doi: 10.14670/HH-21.567. [DOI] [PubMed] [Google Scholar]
- 19.Kamaraju AK, Bertolotto C, Chebath J, Revel M. Pax3 down-regulation and shutoff of melanogenesis in melanoma B16/F10.9 by interleukin-6 receptor signaling. J Biol Chem. 2002;277:15132–41. doi: 10.1074/jbc.M200004200. [DOI] [PubMed] [Google Scholar]
- 20.Gartsbein M, Alt A, Hashimoto K, Nakajima K, Kuroki T, Tennenbaum T. The role of protein kinase C delta activation and STAT3 Ser727 phosphorylation in insulin-induced keratinocyte proliferation. J Cell Sci. 2006;119:470–81. doi: 10.1242/jcs.02744. [DOI] [PubMed] [Google Scholar]
- 21.Sheldahl LC, Park M, Malbon CC, Moon RT. Protein kinase C is differentially stimulated by Wnt and Frizzled homologs in a G-protein-dependent manner. Curr Biol. 1999;9:695–8. doi: 10.1016/s0960-9822(99)80310-8. [DOI] [PubMed] [Google Scholar]
- 22.Rebhun RB, Lazar AJ, Fidler IJ, Gershenwald JE. Impact of sentinel lymphadenectomy on survival in a murine model of melanoma. Clin Exp Metastasis. 2008 doi: 10.1007/s10585-008-9141-y. [DOI] [PubMed] [Google Scholar]
- 23.Chao C, Martin RC, 2nd, Ross MI, et al. Correlation between prognostic factors and increasing age in melanoma. Ann Surg Oncol. 2004;11:259–64. doi: 10.1245/aso.2004.04.015. [DOI] [PubMed] [Google Scholar]
- 24.Wolf K, Mazo I, Leung H, et al. Compensation mechanism in tumor cell migration: mesenchymal-amoeboid transition after blocking of pericellular proteolysis. J Cell Biol. 2003;160:267–77. doi: 10.1083/jcb.200209006. [DOI] [PMC free article] [PubMed] [Google Scholar]
- 25.Wong SY, Hynes RO. Lymphatic or hematogenous dissemination: how does a metastatic tumor cell decide? Cell Cycle. 2006;5:812–7. doi: 10.4161/cc.5.8.2646. [DOI] [PMC free article] [PubMed] [Google Scholar]
- 26.Sosman JA, Weeraratna AT, Sondak VK. When will melanoma vaccines be proven effective? J Clin Oncol. 2004;22:387–9. doi: 10.1200/JCO.2004.11.950. [DOI] [PubMed] [Google Scholar]
- 27.Zuidervaart W, Pavey S, van Nieuwpoort FA, et al. Expression of Wnt5a and its downstream effector beta-catenin in uveal melanoma. Melanoma Res. 2007;17:380–6. doi: 10.1097/CMR.0b013e3282f1d302. [DOI] [PubMed] [Google Scholar]
- 28.Berset M, Cerottini JP, Guggisberg D, et al. Expression of Melan-A/MART-1 antigen as a prognostic factor in primary cutaneous melanoma. Int J Cancer. 2001;95:73–7. doi: 10.1002/1097-0215(20010120)95:1<73::aid-ijc1013>3.0.co;2-s. [DOI] [PubMed] [Google Scholar]
- 29.Aziz MH, Manoharan HT, Church DR, et al. Protein Kinase C (varepsilon) Interacts with Signal Transducers and Activators of Transcription 3 (Stat3), Phosphorylates Stat3Ser727, and Regulates Its Constitutive Activation in Prostate Cancer. Cancer Res. 2007;67:8828–38. doi: 10.1158/0008-5472.CAN-07-1604. [DOI] [PubMed] [Google Scholar]
- 30.Park YJ, Park ES, Kim MS, et al. Involvement of the protein kinase C pathway in thyrotropin-induced STAT3 activation in FRTL-5 thyroid cells. Mol Cell Endocrinol. 2002;194:77–84. doi: 10.1016/s0303-7207(02)00185-5. [DOI] [PubMed] [Google Scholar]
- 31.Yu H, Kortylewski M, Pardoll D. Crosstalk between cancer and immune cells: role of STAT3 in the tumour microenvironment. Nat Rev Immunol. 2007;7:41–51. doi: 10.1038/nri1995. [DOI] [PubMed] [Google Scholar]
- 32.Xie TX, Huang FJ, Aldape KD, et al. Activation of stat3 in human melanoma promotes brain metastasis. Cancer Res. 2006;66:3188–96. doi: 10.1158/0008-5472.CAN-05-2674. [DOI] [PubMed] [Google Scholar]
- 33.Park SJ, Nakagawa T, Kitamura H, et al. IL-6 regulates in vivo dendritic cell differentiation through STAT3 activation. J Immunol. 2004;173:3844–54. doi: 10.4049/jimmunol.173.6.3844. [DOI] [PubMed] [Google Scholar]
- 34.Sen M, Chamorro M, Reifert J, Corr M, Carson DA. Blockade of Wnt-5A/frizzled 5 signaling inhibits rheumatoid synoviocyte activation. Arthritis Rheum. 2001;44:772–81. doi: 10.1002/1529-0131(200104)44:4<772::AID-ANR133>3.0.CO;2-L. [DOI] [PubMed] [Google Scholar]
- 35.Katoh M. STAT3-induced WNT5A signaling loop in embryonic stem cells, adult normal tissues, chouronic persistent inflammation, rheumatoid arthritis and cancer (Review) Int J Mol Med. 2007;19:273–8. [PubMed] [Google Scholar]
- 36.Topol L, Jiang X, Choi H, et al. Wnt-5a inhibits the canonical Wnt pathway by promoting GSK-3 independent beta-catenin degradation. J Cell Biol. 2003;162:899–908. doi: 10.1083/jcb.200303158. [DOI] [PMC free article] [PubMed] [Google Scholar]
- 37.Westfall TA, Brimeyer R, Twedt J, et al. Wnt5/pipetail functions in vertebrate axis formation as a negative regulator of Wnt/beta-catenin activity. J Cell Biol. 2003;162:889–98. doi: 10.1083/jcb.200303107. [DOI] [PMC free article] [PubMed] [Google Scholar]
Associated Data
This section collects any data citations, data availability statements, or supplementary materials included in this article.
Supplementary Materials
Supplementary Figure 1. Expression of WNT5A and Melanosomal Antigens in the Mannheim data set.
Gene expression of WNT5A and melanosomal antigens were examined across a set of 45 samples that have already been characterized into cohorts of high (cohort C) versus low (Cohorts A and B) motility. The Y-axis represents normalized signal intensity for each probe set. A) WNT5A is highly expressed in metastatic melanoma cells, Cohort C, but not in samples that are less motile (Cohorts A and B). Conversely, the melanosomal antigens B) MART-1, C) MITF, D) GP100, E) DCT and F) TYRP1 are decreased in the more metastatic Cohort C. Samples in each cohort are ordered according to increasing Wnt5A expression.
Supplementary Figure 2. Wnt5A downregulation of melanosomal antigens results in decreases in pigmentation.
A) Phase contrast microscopy demonstrates that highly pigmented UACC1273 cells lose pigment expression when transfected with WNT5A (UACC1273 4–7) as compared to transfection with an empty vector control (UACC1273 EV). B) RT-PCR confirmation of decreases in TYRP1, MART-1 and MITF in Wnt5A high M93-047 and UACC647 cells as compared to Wnt5A-low UACC1273EV cells, or normal human melanocytes. C) Western analysis shows that Wnt5A-high lines have increased PO4-PKC and PO4-STAT3 and decreased MART-1 as compared to Wnt5A- low UACC1273EV cells.
Supplementary Figure 3. Wnt5A effects on T-cell activation are specific
A) When EL4 cells are pulsed with gp100 peptide, and presented to gp100 specific T-cells (from pMEL transgenic mice), Wnt5A cannot downregulate T-cell activation.
Supplementary Figure 4. Wnt5A increases the metastatic ability of B16 melanoma cells
A) Markers of Wnt5A-mediated metastasis, CD44 and Vimentin, were measured in B16 cells, and increased post rWnt5A treatment. B) B16 cells treated with rWnt5A are able to heal a scratch wound much faster than those treated with a vehicle control. C) Wnt5A increases the in vivo metastasis of B16 melanoma cells. 10 out of 10 rWnt5A-treated mice had lung metastases, of which only three had less than 50, and are represented by the numbers in parentheses. Only 3 of the control mice had any metastases at all with only one having over 50, giving a significant p value of p<0.01. The number of metastases present in the other two mice is noted in parentheses.
Supplementary Figure 5. IL-6 is not responsible for Wnt5A-mediated STAT3 activation in melanoma cells.
A) Melanoma cell lines release significant amounts of IL6, as measured by ELISA, however B) the expression of the IL6 receptor as measured by real time PCR varies greatly among melanoma lines and does not correlate to invasive capability or Wnt5A status. C) Furthermore, melanoma cells express high levels of SOCS3, a cytokine suppressor known to suppress IL6 signaling in melanoma cells.