Abstract
Cytochrome P450scc (CYP11A1) metabolizes vitamin D3 to 20-hydroxyvitamin D3 as the major product, with subsequent production of dihydroxy and trihydroxy derivatives. The aim of this study was to determine whether cytochrome P450scc could metabolize 1α-hydroxyvitamin D3 and whether products were biologically active. The major product of 1α-hydroxyvitamin D3 metabolism by P450scc was identified by mass spectrometry and NMR as 1α,20-dihydroxyvitamin D3. Mass spectrometry of minor metabolites revealed the production of another dihydroxyvitamin D3 derivative, two trihydroxy-metabolites made via 1α,20-dihydroxyvitamin D3 and a tetrahydroxyvitamin D3 derivative. The Km for 1α-hydroxyvitamin D3 determined for P450scc incorporated into phospholipid vesicles was 1.4 mol substrate/mol phospholipid, half that observed for vitamin D3. The kcat was 3.0 mol/min/mol P450scc, 6-fold lower than that for vitamin D3. 1α,20-Dihydroxyvitamin D3 inhibited DNA synthesis by human epidermal HaCaT keratinocytes propagated in culture, in a time- and dose-dependent fashion, with a potency similar to that of 1α,25-dihydroxyvitamin D3. 1α,20-Dihydroxyvitamin D3 (10 μM) enhanced CYP24 mRNA levels in HaCaT keratinocytes but the potency was much lower than that reported for 1α,25-dihydroxyvitamin D3. We conclude that the presence of the 1-hydroxyl group in vitamin D3 does not alter the major site of hydroxylation by P450scc which, as for vitamin D3, is at C20. The major product, 1α,20-dihydroxyvitamin D3, displays biological activity on keratinocytes and therefore might be useful pharmacologically.
Keywords: Vitamin D, Keratinocytes, CYP11A1, NMR
1. Introduction
1α-Hydroxyvitamin D3 (1(OH)D3) is a synthetic prohormone that can be converted to 1α,25-dihydroxyvitamin D3 (1,25(OH)2D3), the biologically active form of vitamin D3 [1]. This conversion occurs in the liver by the 25-hydroxylase activities of CYP3A4, CYP2J2, CYP27A1 and CYP2R1 [2–4]. The biological significance of these reactions is emphasized by the use of 1(OH)D3 in the treatment of osteoporosis, rickets and hypocalcemia [5].
Cytochrome P450scc (CYP11A1) is well known for its role in catalyzing the cleavage of the side chain of cholesterol to produce pregnenolone, the first enzymatic step in steroid synthesis [6]. More recently it has been shown that cytochrome P450scc can hydroxylate both vitamin D2 (D2) and vitamin D3 (D3), plus their precursors ergosterol and 7-dehydrocholesterol [7–12]. D2 and D3, as well as ergosterol, undergo hydroxylations at substrate-specific sites without cleavage of the side chain occurring. Purified P450scc preferentially hydroxylates D3 at C20, with subsequent hydroxylations producing dihydroxy- and trihydroxy-metabolites [7,10,12]. 20-Hydroxyvitamin D3 (20(OH)D3) is released from the active site of the enzyme and is the major product of D3 metabolism by P450scc. In contrast to D3, P450scc is not able to metabolize 25-hydroxyvitamin D3 [10].
Recently we have used human epidermal keratinocytes as a model to compare the effects of 20(OH)D3 to those of 1,25(OH)2D3 [13]. We found that 20(OH)D3 inhibits cell proliferation and stimulates keratinocyte differentiation with a potency comparable to 1,25(OH)2D3. In the present study we tested whether cytochrome P450scc can hydroxylate 1(OH)D3 to produce 1,20(OH)2D3 and whether this product is biologically active.
2. Materials and methods
2.1. Preparation of enzymes
Adrenodoxin reductase and cytochrome P450scc were purified from bovine adrenal mitochondria [14,15]. Adrenodoxin was expressed in Escherichia coli and purified as described before [16].
2.2. Measurement of 1 (OH)D3 metabolism in phospholipid vesicles
Phospholipid vesicles were prepared from dioleoyl phosphatidylcholine and bovine heart cardiolipin in the ratio 85:15 (mol/mol). Phospholipids (1.25 μmol) dissolved in ethanol were placed in glass tubes, the solvent removed under nitrogen and 0.5 ml buffer comprising 20 mM HEPES (pH 7.4), 100 mM NaCl, 0.1 mM dithiothreitol and 0.1 mM EDTA was added. Tubes were sonicated for 10 min in a bath-type sonicator [17]. D3, 1(OH)D3, or 1(OH)D3 derivatives were included in the mixture for sonication as required (see Section 3). P450scc was added to the vesicles and incubated for 20 min at room temperature to permit incorporation into the vesicle membrane [17]. The incubation mixture comprised vesicles (510 μM phospholipid), cytochrome P450scc (0.2–2 μM), 15 μM adrenodoxin, 0.2 μM adrenodoxin reductase, 2mM glucose 6-phosphate, 2 U/ml glucose 6-phosphate dehydrogenase and 50 μM NADPH, in the buffer used for sonication. Samples (typically 0.25–1.0 ml) were pre-incubated for 8 min at 37 °C then the reaction started by the addition of NADPH. Samples were incubated at 37 °C with shaking for various times (see Section 3), then reactions were stopped by the addition of 2 ml ice-cold dichloromethane and vortex mixing. The lower phase was retained and the upper aqueous phase was extracted twice more with 2 ml aliquots of dichloromethane. The solvent was removed under nitrogen and samples were dissolved in 64% methanol in water for HPLC analysis.
2.3. Measurement of 1(OH)D3 metabolism in 2-hydroxypropyl-β-cyclodextrin
Incubations were carried out as described above for phospholipid vesicles except that the vesicles were replaced by 2-hydroxypropyl-β-cyclodextrin (cyclodextrin) at a final concentration of 0.45%. Substrates were initially dissolved in 45% cyclodextrin (typically 5 mM) [18].
2.4. Analysis of 1(OH)D3 metabolites by HPLC
Metabolites were analyzed using a PerkinElmer HPLC equipped with a C18 column (Brownlee Aquapore, 22 cm × 4.6 mm, particle size 7 μm). Samples were applied to the column in 64% methanol and eluted with a 64–100% methanol gradient in water, at a flow rate 0.5 ml/min. Products were detected using a UV monitor at 265 nm. The percentage of substrate and each product relative to the total secosteroid present was determined from peak integrations, then from the known initial concentration of substrate, the moles of substrate consumed or product produced were calculated. The lower limit of detection was 5 pmol of secosteroid and the coefficient of variation between assays was 1.0%. For kinetic assays, Km and kcat values were determined from the initial rates of substrate depletion, since in some assays multiple products were produced (see Section 3). Since P450scc action on cholesterol and hydroxyvitamin D substrates has previously been shown to give a good fit to the Michaelis–Menten equation [7,8,15,16,19,20], this equation was fitted to the experimental data using Kaleidagraph 3.6 and data are presented as mean ± SD from the curve fit.
2.5. Large-scale preparation of 1,20(OH)2D3 for NMR and biological testing
1,20(OH)2D3 (the identification of this metabolite is described in Section 3) was prepared enzymatically from a 40 ml incubation of 2 μM P450scc with 50 μM 1(OH)D3 (Sigma) in 0.45% cyclodextrin, in a scaled-up version of the method described above. The 1,20(OH)2D3 was purified by preparative TLC using three developments of the silica gel G plate in hexane:ethyl acetate (1:1), similar to the purification of D3 metabolites [10]. The resulting 1,20(OH)2D3 was further purified by preparative HPLC using a Brownlee Aquapore column (25 cm × 10 mm, particle size 20 μM) and eluted with a methanol gradient in water (64–100% methanol). This yielded 180 μg of pure product of which 150 μg was used for NMR. The UV spectrum of the product was the same as the 1(OH)D3 substrate.
2.6. Preparation of minor metabolites of 1(OH)D3 to test as substrates for P450scc
Minor metabolites of 1(OH)D3 were purified from the same 40 ml incubation of 50 μM 1(OH)D3 with 2 μM P450, as described above for the preparation of 1,20(OH)2D3. The TLC plate was divided into sections and products eluted from the silica gel for each section with CHCl3:CH3OH (1:1). Products were purified by reverse-phase HPLC as described above for the analysis of 1(OH)D3 metabolites. UV spectra of products were recorded to check that they had the same typical D3 spectrum as the substrate and were quantitated using an extinction coefficient of 18,000 M−1 cm −1 at 263 nm [21].
2.7. NMR
All NMR measurements were performed on a Varian Unity Inova-500 MHz spectrometer equipped with a 3 mm inverse probe (Varian NMR, Inc., Palo Alto, CA). We used deuterated methanol as solvent and susceptibility matched 3 mm Shigemi NMR tubes were used for maximum sensitivity (Shigemi, Inc., Allison Park, PA 15101). Temperature was regulated at 20 °C and was controlled with a general accuracy of ±0.1 °C. Chemical shifts were referenced to 3.31 ppm for proton and 49.15 ppm for carbon from solvent peaks. The HDO peak around 4.8 ppm from solvent was suppressed using pre-saturation method for both one-dimensional proton and two-dimensional NMR measurement.
2.8. Cell culture
Immortalized human keratinocytes (HaCaT) were cultured in Dulbecco's Modified Eagle Medium (DMEM) supplemented with glucose, l-glutamine, pyridoxine hydrochloride (Cell Grow), 5% fetal bovine serum (Sigma) and 1% penicillin/streptomycin/amphotericin antibiotic solution (Sigma) at 37 °C in 5% CO2 as described previously [22].
2.9. DNA synthesis assay
We followed protocols described previously [23], with some modifications. HaCaT keratinocytes were plated in 24-well plates, 50,000 cells/well and cultured in DMEM containing 5% charcoal-treated serum. 1,20(OH)2D3 (or ethanol vehicle at 10−6M) was added to final concentrations ranging from 10−6 to 10−10M. After 24 or 48 h of incubation, [3H]thymidine (specific activity 88.0 Ci/mmol; Amersham Biosciences, Picataway, NY, USA) was added to a final concentration of 1.0 μCi/ml. After 4 h media were discarded, cells washed with cold phosphate-buffered saline and incubated in 10% trichloroacetic acid for 30 min. Cells were washed again with phosphate-buffered saline, 100 μl 1.0 M NaOH was added to each well and plates incubated for 30 min at 30°C. The supernatant was collected and the 3H-radioactivity measured by scintillation counting using a Direct Beta-Counter Matrix 9600 (Packard). The radioactivity was measured separately for each well and the results entered into the calculation as means of 4 wells for each condition in a series of 4 experiments (n = 16).
2.10. Relative cell number estimated by sulforhodamine B assay
HaCaT cells were seeded in a 96-well plate (10,000 cells/well). Following 12 h of incubation the medium was changed to DMEM plus 5% charcoal-treated serum containing serial dilutions of 1,20(OH)2D3 or ethanol vehicle. After 47 h cells were fixed with 10% trichloroacetic acid, washed and then incubated with 0.04% sulforhodamine B (in 1% acetic acid) for 30 min. Following a second wash with 1% acetic acid, dye incorporated into the cells was solubilized in 10 mM Tris by shaking for 5 min and the absorbance was measured at 565 nm. Data are presented as a percent of control. All reagents were from Sigma (Sigma–Aldrich, St. Louis, MO).
2.11. Real-time RT-PCR for CYP24
The RNA was isolated using an Absolutely RNA Miniprep Kit (Stratagen). Reverse transcription was performed using a Transcriptor First Strand cDNA Synthesis Kit (Roche). Real-time PCR was performed in triplicate as described previously [13] using primers (right: 5′-GCA GCT CGA CTG GAG TGA C-3′; left: 5′-CAT CAT GGC CAT CAA AAC AAT-3′) and specific probe (designed using a universal probe library (Roche)). The data were collected on a Roche Light Cycler 480. The amount of CYP24 mRNA was compared to that for Cyclophilin B using a comparative CT method.
2.12. Other procedures
The concentration of cytochrome P450scc was determined from the CO-reduced minus reduced difference spectrum using an extinction coefficient of 91,000 M−1 cm−1 for the absorbance difference between 450 and 490 nm [24]. Mass spectra were recorded by positive ESI using a Micromass VG Waters Autospec Mass Spectrometer at 8 kV. The sample was run in 100% methanol at a sample flow rate of 30 μl min−1. Nitrogen was used as both the bath (250 l/h) and nebulizing gas (12 l/h). The scan range for the mass spectrum was m/z=100–1000.
2.13. Statistical analyses
Data on the biological activity of 1,20(OH)2D3 are presented as mean ± SEM and have been analyzed with Student's t-test (for 2 groups) or one-way analysis of variance and appropriate post-hoc test (for more than 2 groups) using Excel (Microsoft) and Prism 4.00 (GraphPad Software, San Diego). Differences were considered significant when P < 0.05.
3. Results
3.1. Metabolism of 1(OH)D3 by cytochrome P450scc
Incubation of 1(OH)D3 dissolved in 0.45% cyclodextrin, with P450scc, resulted in one major product and several minor ones (Fig. 1). Four of the products were purified and subjected to mass spectral analysis with ESI. The major product (retention time (RT) = 34 min) gave the most abundant ion at m/z = 439.7 (416.7 + Na+) indicating the product was dihydroxyvitamin D3 ((OH)2D3). A major ion was also observed at 856.4 corresponding to Na+ complexed to two trihydroxyvitamin D3 molecules. This product was identified as 1,20(OH)2D3 by NMR (see later). The electrospray mass spectra for the products with RT = 29 min and RT = 26 min in Fig. 1 were similar, with m/z = 455 (432 + Na+) for the major ion. These products were therefore identified as trihydroxyvitamin D3 ((OH)3D3). A major ion was also observed at m/z = 887 for both, which corresponds to Na+ complexed to two trihydroxyvitamin D3 molecules. The electrospray mass spectrum for the product with RT = 32 min in Fig. 1 had m/z = 439 (416 + Na+) and was identified as another dihydroxyvitamin D3 derivative.
Fig. 1.
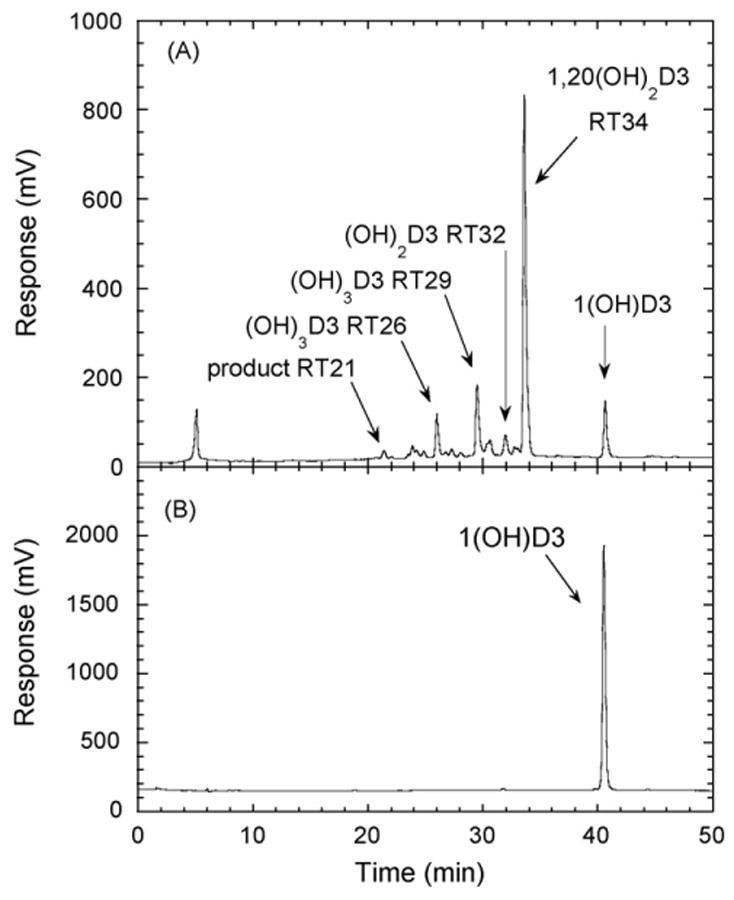
Chromatogram showing products of 1(OH)D3 metabolism by P450scc. (A) 1(OH)D3 (50 μM) dissolved in cyclodextrin to a final concentration of 0.45%, was incubated with 1.0 μM P450scc for 1 h in a reconstituted system containing adrenodoxin and adrenodoxin reductase. Samples were extracted and analyzed by reverse-phase HPLC. (B) Control incubation (zero time) showing the 1(OH)D3 substrate. The identification of the number of hydroxyl groups in the products is described in the text. RT, retention time in minutes.
A time course for the metabolism of 1(OH)D3 in cyclodextrin is shown in Fig. 2A. The two dihydroxy products (RT = 32 min and RT = 34 min) appeared without a lag, consistent with them requiring only one P450scc-catalyzed hydroxylation for their formation. The two trihydroxy products (RT = 26 min and RT = 29 min) showed an initial lag before they appeared, suggesting that some accumulation of a dihydroxy product was required to serve as their substrate. The product with RT = 21 min in Fig. 1 was not produced in sufficient quantities for reliable quantitation and was not included in the time course.
Fig. 2.
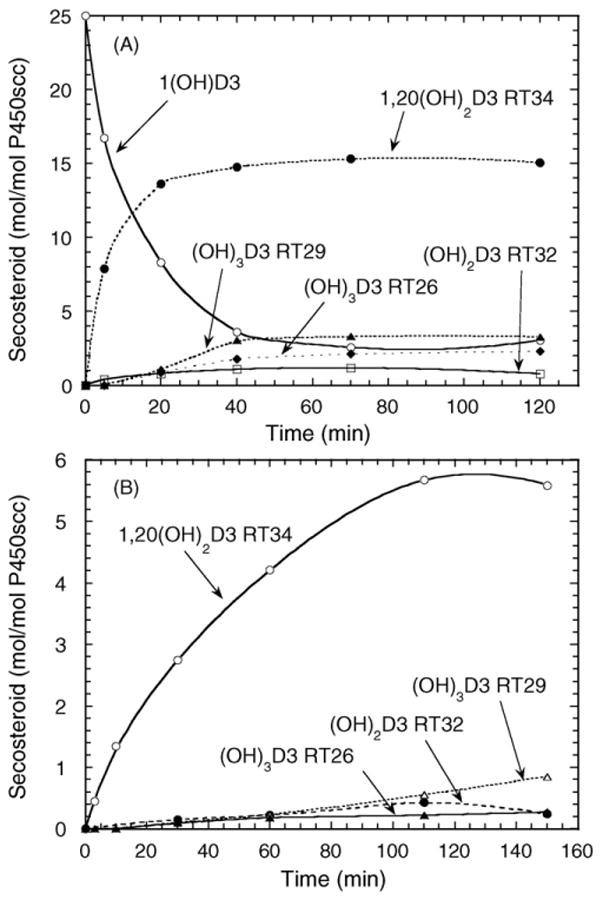
Time course for metabolism of 1(OH)D3 by P450scc in cyclodextrin and in phospholipid vesicles. (A) 1(OH)D3 (50 μM) dissolved in cyclodextrin to a final concentration of 0.45%, was incubated with 2.0 μM P450scc. (B) Vesicles containing 0.1 mol 1(OH)D3/mol phospholipid were incubated with 2.0 μM P450scc. Samples were analyzed by HPLC as described for Fig. 1. RT, retention time in minutes.
Since cyclodextrin provides an artificial means of holding 1(OH)D3 in solution, we also examined the metabolism of 1(OH)D3 incorporated into the membrane of vesicles made from dioleoyl phosphatidylcholine and cardiolipin, which more closely resemble the mitochondrial membrane environment of P450scc [19,25]. The ability of vitamin D and its hydroxy-metabolites to efficiently partition in to the bilayer of phospholipid vesicles has been established previously [26,27]. Fig. 2B shows that the same 1(OH)D3 metabolites that were produced in cyclodextrin (Figs. 1 and 2A) are also observed in vesicles, although there are some changes to their relative proportions. At the end of the 3 h incubation of 1(OH)D3 with P450scc in vesicles, only 25% of the original 1(OH)D3 was consumed.
3.2. NMR identification of major product of 1(OH)D3 metabolism as 1,20(OH)2D3
The most notable change in the proton NMR for the major dihydroxyvitamin D3 metabolite (RT = 34, Fig. 1) compared to the 1(OH)D3 substrate is the methyl group at position 21 (Fig. 3A). The doublet expected for 1(OH)D3 for the 21-methyl group is a singlet in the major metabolite and there is concurrent downfield shift of the proton chemical shift. This is due to the removal of coupling from the methine proton at position 20, clearly indicating hydroxylation at position 20. One proton from 19-CH2 coincidently overlapped with HDO peak from the solvent. Suppression of solvent peak also suppressed this proton, resulting in a much lower intensity than expected. Further two-dimensional proton–proton TCOSY (Total Correlation Spectroscopy, Fig. 3B) and proton–carbon HSQC (Heteronuclear Single Quantum Correlation, Fig. 3C) measurements for this metabolite indicated that no other changes occurred to the molecular structure. Thus, this metabolite is unambiguously identified as 1,20(OH)2D3. The structure is shown in Fig. 4.
Fig. 3.
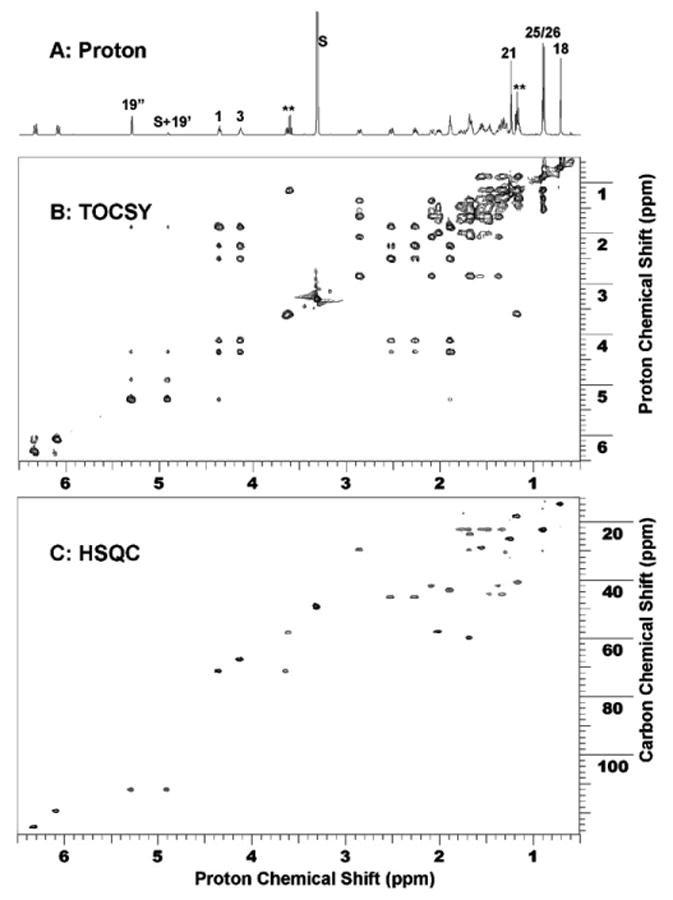
NMR identification of the major product as 1,20(OH)2 D3. (A) 1D proton NMR; (B) 2D proton–proton TOCSY NMR spectrum; and (C) 2D proton–carbon HSQC spectrum. In 1D proton NMR, 21-Me shifted downfield and became a singlet as a result of hydroxylation at position 20. S denotes solvent peaks from Methanol-D at 3.31 and 4.81 ppm. The solvent peak at 4.81 ppm is coincidently overlapped with one proton from 19-CH2. Solvent suppression of this solvent peak also reduced the intensity from this proton. ** denotes impurities.
Fig. 4.
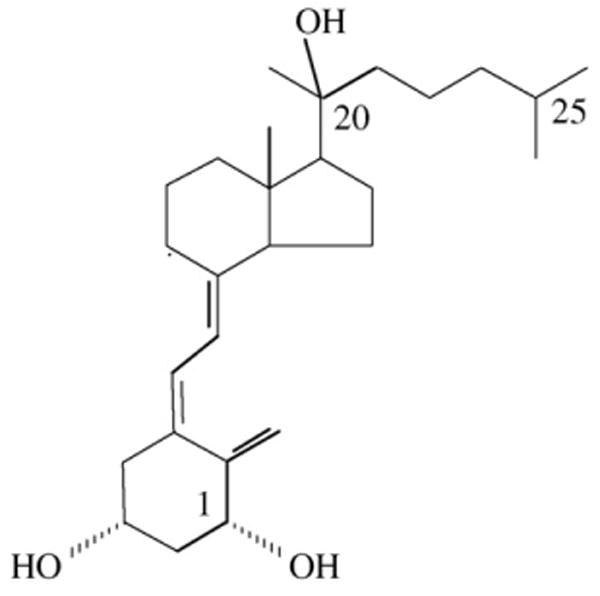
The structure of 1α,20-dihydroxyvitamin D3 (1,20(OH)2D3).
3.3. Further metabolism of 1(OH)D3 products by cytochrome P450scc
Incubation of 1,20(OH)2D3 with cytochrome P450scc resulted in it being converted to three major products, as shown in the time course experiment (Fig. 5). Two of the products (RT = 26 min and RT = 29 min) had identical retention times to the two trihydroxyvitamin D3 products produced directly from 1(OH)D3 (Fig. 1). The third product corresponded to the RT = 21 min product in Fig. 1 and exhibited a lag before appreciable product could be detected. The two trihydroxy products were purified and tested as substrates for P450scc but no metabolism of the RT = 29 min product was observed. The RT = 26 min derivative was converted to a single product with RT = 21 min (Fig. 6). The electrospray mass spectrum for this product had m/z = 471 (448 + Na+) which confirmed the product was tetrahydroxyvitamin D3 ((OH)4D3). We checked that the product in Fig. 1 labelled as RT = 21 min had an identical retention time to this product by HPLC analysis of a mixture of the two samples (not shown). Thus, the RT = 21 min product in Fig. 1 is assigned as (OH)4D3 and since it can be made from 1,20(OH)2D3, it must have hydroxyl groups at C1 and C20, plus two unknown positions.
Fig. 5.
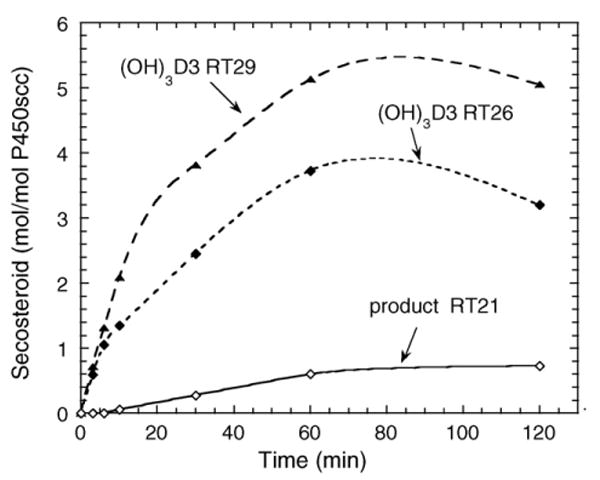
Time course for metabolism of 1,20(OH)2D3 in cyclodextrin. 1,20(OH)2D3 (50 μM) dissolved in cyclodextrin to a final concentration of 0.45%, was incubated with 2.0 μM P450scc. RT, retention time in minutes.
Fig. 6.
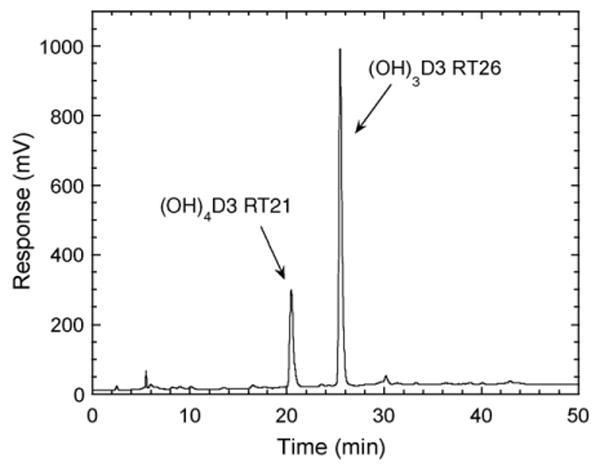
Chromatogram showing metabolism of trihydroxyvitamin D3 (RT = 26 min). The (OH)3D3 product of P450scc action on 1(OH)D3 with a retention time of 26 min in Fig. 1 was purified, incorporated into phospholipid vesicles at a molar ratio to phospholipid of 0.06, incubated with P450scc (1 μM) for 2 h and products analyzed by HPLC with gradient elution. RT, retention time in minutes.
The dihydroxyvitamin D3 product with RT = 32 min in Fig. 1 was also purified and tested as a substrate for P450scc but no further metabolism was observed.
3.4. Kinetics of metabolism of 1(OH)D3 in cyclodextrin and phospholipid vesicles
1(OH)D3 gave a kcat of 1.3 ± 0.1 mol/min/mol P450scc and a Km of 41 ± 6 μM when assays were done with substrate dissolved in 0.45% cyclodextrin (final concentration). This compares to values of 19.7 ± 0.9 mol/min/mol P450scc and 30 ± 2 μM for kcat and Km, respectively, for D3 in this system. It was not possible to incorporate enough 1(OH)D3 or D3 into the bilayer of phospholipid vesicles to saturate the P450scc with these substrates, so a large extrapolation was required to determine the kinetic parameters in this assay system. The kcat value for 1(OH)D3 in vesicles was 3.0 ± 0.5 mol/min/mol P450scc and for D3 was 20 ± 8 mol/min/mol P450scc. Km values were 1.4 ± 0.3 and 3.3 ± 1.5 mol substrate/mol phospholipid for 1(OH)D3 and vitamin D3, respectively.
3.5. 1,20(OH)2D3 inhibits keratinocyte proliferation
1,20(OH)2D3 suppressed DNA synthesis by keratinocytes in a concentration- and time-dependent manner compared to the control which contained the ethanol vehicle (Fig. 7). At 24 h, 1,20(OH)2D3 caused a 4-fold inhibition of DNA synthesis at concentrations of both 10 and 1000 nM, and increased to 6-fold inhibition at 48 h. Of note, a lower concentration of 1,20(OH)2D3 (0.1 nM) also demonstrated a statistically significant inhibitory effect (P < 0.05), but only at 48 h of culture.
Fig. 7.
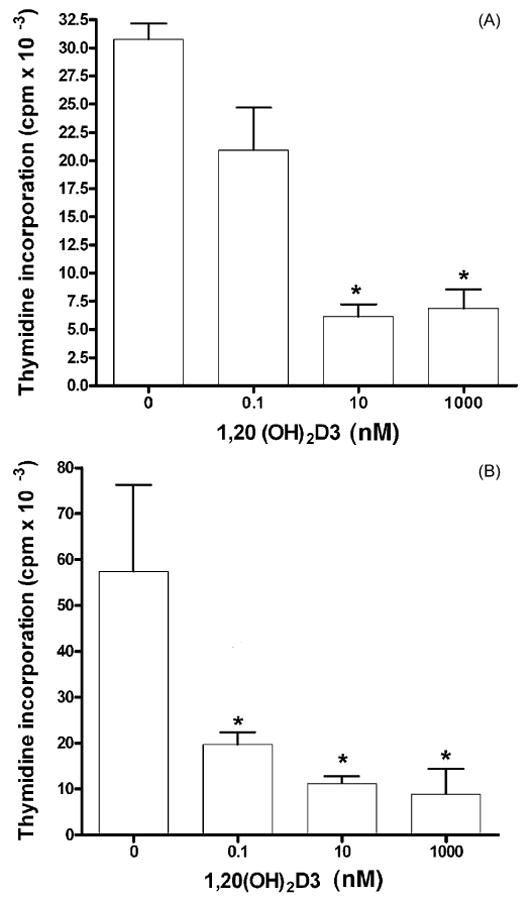
Suppression of [3H]thymidine incorporation into DNA by 1,20(OH)2D3. HaCaT keratinocytes were treated with 1,20(OH)2D3 for (A) 24 h or (B) 48 h. Data are presented as means ± SEM (n = 16). *P < 0.05 versus control.
The number of cells following treatment with 1,20(OH)2D3 relative to control cells treated with the ethanol vehicle, was determined using an assay which measures total biomass by staining cellular proteins with sulforhodamine B dye. As shown in Fig. 8, 1,20(OH)2D3 displayed a trend to suppress the relative number of viable cells in a dose-dependent manner, however the effect was statistically significant (P < 0.05) only at the highest concentration tested (1 μM). This very modest effect on cellular protein content is consistent with DNA synthesis inhibition (Fig. 7), indicating growth inhibition and not cytotoxicity. The sulforhodamine assay is commonly used to estimate drug cytotoxicity where more substantial effects are seen for cytotoxic compounds.
Fig. 8.
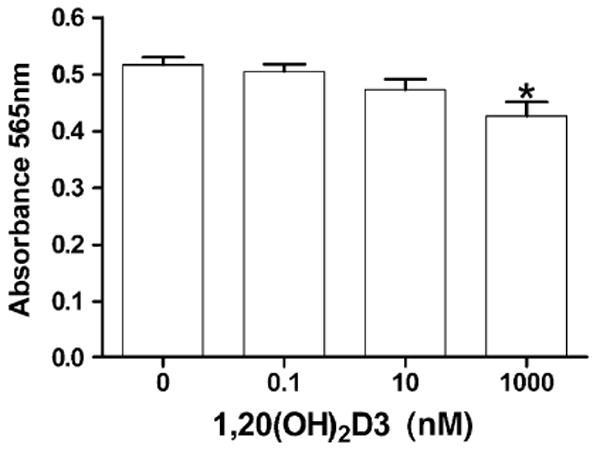
Relative cell number (protein concentration) following 1,20(OH)2D3 treatment. HaCaT keratinocytes were treated with 1,20(OH)2D3 for 48 h. Cellular protein concentration was measured by the sulforhodamine B assay. Data are presented as means ± SEM (n = 6). *P < 0.05 versus control.
3.6. 1,20(OH)2 D3 stimulates expression of the CYP24 gene
Since CYP24 is an important physiological target of 1,25(OH)2D3 in the kidney and peripheral tissues, including skin [28,29], we tested the action of 1,20(OH)2D3 on the CYP24 mRNA level in HaCaT keratinocytes. Fig. 9 shows that 1,20(OH)2D3 stimulates CYP24 mRNA levels in a time- and dose-dependent manner. At a concentration of 1.0 μM, 1,20(OH)2D3 markedly increased the CYP24 mRNA level; 200-fold and 1000-fold after 6 and 24 h, respectively. Only slight stimulation was seen with 0.1 μM 1,20(OH)2 D3 following 6 h of treatment and the effect disappeared at 24 h.
Fig. 9.
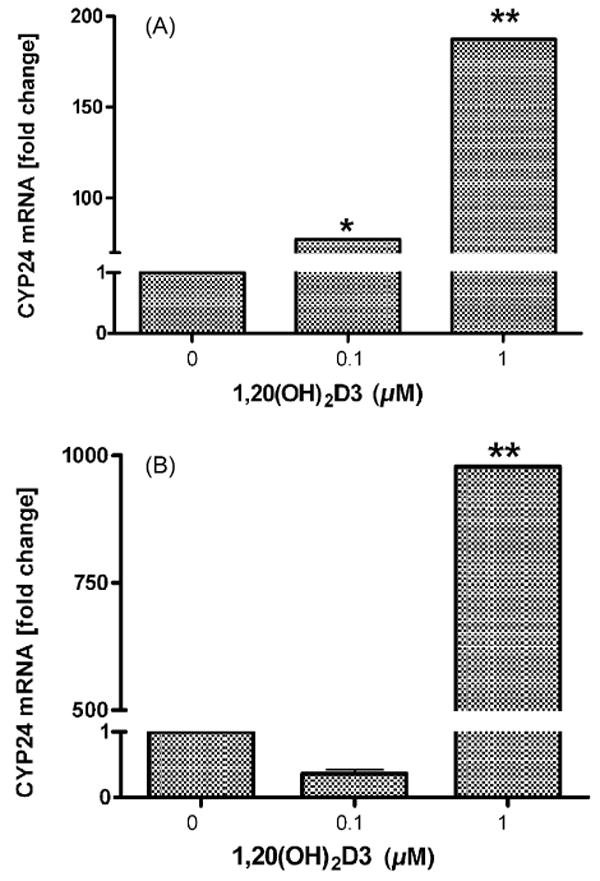
1,20(OH)2D3 increases CYP24 mRNA levels in HaCaT keratinocytes. HaCaT keratinocytes were treated with 0.1 μM or 1.0 μM 1,20(OH)2D3 for 6 h (A) or 24 h (B). Data are presented as means ± SEM (n = 3). *P < 0.05, **P < 0.001.
4. Discussion
We demonstrate that P450scc in an in vitro reconstituted system metabolizes 1(OH)D3 to two dihydroxyvitamin D3 products, of which the major one is further sequentially metabolized to two trihydroxyvitamin D3 products and one tetrahydroxyvitamin D3 product (Fig. 10). The major product was defined as 1,20(OH)2D3 by NMR. Time courses for metabolism of 1(OH)D3 and 1,20(OH)2D3 revealed that after hydroxylation at C20, subsequent metabolism of the resulting 1,20(OH)2D3 is slow. Two trihydroxyvitamin D3 products were produced, but not in sufficient quantities for NMR identification of the hydroxylation sites. One of these products was not further metabolized while the other was converted to a product with a shorter retention time, identified as (OH)4D3 (Fig. 10). Thus, there appears to be only one pathway for the production of (OH)4D3 from 1(OH)D3. The major pathway of D3 metabolism by P450scc ends with the formation of 17,20,23-trihydroxyvitamin D3 and involves sequential hydroxylation at C20, C23 then C17 [12]. If the same reaction sequence occurs with the 1-hydroxyl group present, then the (OH)3D3 intermediate (Fig. 10, RT = 26 min) and the final (OH)4D3 product (RT = 21 min) would be 1,20,23(OH)3D3 and 1,17,20,23(OH)4D3, respectively.
Fig. 10.
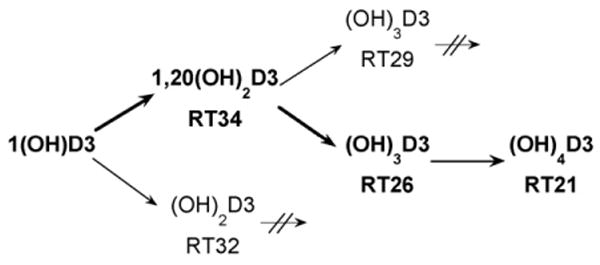
Pathways for metabolism of 1α-hydroxyvitamin D3 by P450scc. The major pathway leading to the production of tetrahydroxyvitamin D3 is shown in bold. Arrows with crossed lines indicate that these hydroxy-metabolites are not further hydroxylated by P450scc. RT, retention time in minutes (see Fig. 1).
The side chain cleavage of cholesterol by P450scc to produce pregnenolone involves initial hydroxylation at C22, which is followed by hydroxylation at C20, then cleavage of the side chain between C20 and C22 [6,30]. In contrast, it is now clear that C20 is the preferred initial site of hydroxylation of both D3 [7,10,12,20] and 1(OH)D3. The presence of the hydroxyl group at C1 does not therefore appreciably alter the orientation of the secosteroid side chain in the active site. The 1-hydroxyl group would appear to have minimal influence on binding to P450scc either, since it has little effect on the Km in cyclodextrin, and reduces Km by only 50% in vesicles. The 1-hydroxyl group does however markedly affect kcat, decreasing it by 15-fold and 6.7-fold in cyclodextrin and vesicles, respectively. Overall the 1-hydroxyl group decreases the catalytic efficiency (kcat/Km) of P450scc by 20-fold in cyclodextrin, but by only 3-fold in phospholipid vesicles.
Our preliminary studies on the biological activity 1,20(OH)2D3 using cultured HaCaT keratinocytes reveal that it inhibits keratinocyte replication in a time- and dose-dependent manner. Interestingly, the inhibition of DNA synthesis was seen at a concentration as low as 0.1 nM, which is similar to that reported by us for 20(OH)D3 [13] and for 1,25(OH)2D3 [31]. This suggests that 1,20(OH)2D3, 20(OH)D3 and 1,25(OH)2D3 exhibit similar potency in the regulation of DNA synthesis. In contrast, the concentration of 1,20(OH)2D3 required to significantly stimulate CYP24 mRNA levels (1 μM) is substantially higher than the 10 nM concentrations of 20(OH)D3 or 1,25(OH)2D3 that can achieve this [13,31]. Although additional in-depth phenotypic studies are needed, this difference suggests that these compounds act through overlapping yet distinct regulatory pathways. Comparatively low potency of 1,20(OH)2D3 towards CYP24 expression suggest that this compound can be used to exert biological effect at concentrations that do not induce CYP24, the enzyme responsible for 1,25(OH)2D3 inactivation and degradation [28].
Our study suggests that P450scc could play a role in the in vivo metabolism of 1(OH)D3, sometimes used in the treatment of osteoporosis, rickets and hypocalcemia [5]. 20-Hydroxylation by P450scc in the adrenal cortex, gonads or other tissues expressing P450scc such as brain or skin [6,8], may provide an alternative pathway to 25-hydroxylation in the liver for its activation.
In conclusion, this study shows that sufficient quantities of 1,20(OH)2D3 can be made enzymatically by the action of P450scc on 1(OH)D3, to permit testing of its biological activity. Initial testing shows that it is active on skin cells and might be useful as a form of vitamin D to use therapeutically.
Acknowledgments
This work was supported by NIH grant R01AR052190 to AS and RT and by the University of Western Australia. We thank Dr. Tony Reeder for recording mass spectra.
References
- 1.Seino Y, Tanaka H, Yamaoka K, Yabuuchi H. Circulating 1 alpha,25-dihydroxyvitamin D levels after a single dose of 1 alpha,25-dihydroxyvitamin D3 or 1 alpha-hydroxyvitamin D3 in normal men. Bone Miner. 1987;2:479–485. [PubMed] [Google Scholar]
- 2.Aiba I, Yamasaki T, Shinki T, Izumi S, Yamamoto K, Yamada S, Terato H, Ide H, Ohyama Y. Characterization of rat and human CYP2J enzymes as Vitamin D 25-hydroxylases. Steroids. 2006;71:849–856. doi: 10.1016/j.steroids.2006.04.009. [DOI] [PubMed] [Google Scholar]
- 3.Cheng JB, Motola DL, Mangelsdorf DJ, Russell DW. De-orphanization of cytochrome P450 2R1, a microsomal vitamin D 25-hydroxylase. J Biol Chem. 2003;278:38084–38093. doi: 10.1074/jbc.M307028200. [DOI] [PMC free article] [PubMed] [Google Scholar]
- 4.Gupta RP, Hollis BW, Patel SB, Patrick KS, Bell NH. CYP3A4 is a human microsomal vitamin D 25-hydroxylase. J Bone Miner Res. 2004;19:680–688. doi: 10.1359/JBMR.0301257. [DOI] [PubMed] [Google Scholar]
- 5.Shiraishi A, Higashi S, Ohkawa H, Kubodera N, Hirasawa T, Ezawa I, Ikeda K, Ogata E. The advantage of alfacalciferol over vitamin D in the treatment of osteoporosis. Calcif Tissue Int. 1999;65:311–316. doi: 10.1007/s002239900704. [DOI] [PubMed] [Google Scholar]
- 6.Tuckey RC. Progesterone synthesis by the human placenta. Placenta. 2005;26:273–281. doi: 10.1016/j.placenta.2004.06.012. [DOI] [PubMed] [Google Scholar]
- 7.Guryev O, Carvalho RA, Usanov S, Gilep A, Estabrook RW. A pathway for the metabolism of vitamin D3: unique hydroxylated metabolites formed during catalysis with cytochrome P450scc (CYP11A1) Proc Natl Acad Sci USA. 2003;100:14754–14759. doi: 10.1073/pnas.2336107100. [DOI] [PMC free article] [PubMed] [Google Scholar]
- 8.Slominski A, Zjawiony J, Wortsman J, Semak I, Stewart J, Pisarchik A, Sweatman T, Marcos J, Dunbar C, Tuckey RC. A novel pathway for sequential transformation of 7-dehydrocholesterol and expression of the P450scc system in mammalian skin. Eur J Biochem. 2004;271:4178–4188. doi: 10.1111/j.1432-1033.2004.04356.x. [DOI] [PMC free article] [PubMed] [Google Scholar]
- 9.Slominski A, Semak I, Zjawiony J, Wortsman J, Gandy MN, Li J, Zbytek B, Li W, Tuckey RC. Enzymatic metabolism of ergosterol by cytochrome P450scc to biologically active 17(,24-dihydroxyergosterol. Chem Biol. 2005;12:931–939. doi: 10.1016/j.chembiol.2005.06.010. [DOI] [PubMed] [Google Scholar]
- 10.Slominski A, Semak I, Zjawiony J, Wortsman J, Li W, Szczesniewski A, Tuckey RC. The cytochrome P450scc system opens an alternate pathway of vitamin D3 metabolism. FEBS J. 2005;272:4080–4090. doi: 10.1111/j.1742-4658.2005.04819.x. [DOI] [PMC free article] [PubMed] [Google Scholar]
- 11.Slominski A, Semak I, Wortsman J, Zjawiony J, Li W, Zbytek B, Tuckey RC. An alternative pathway of vitamin D2 metabolism. Cytochrome P450scc (CYP11A1)-mediated conversion to 20-hydroxyvitamin D2 and 17,20-dihydroxyvitamin D2. FEBS J. 2006;273:2891–2901. doi: 10.1111/j.1742-4658.2006.05302.x. [DOI] [PMC free article] [PubMed] [Google Scholar]
- 12.Tuckey RC, Li W, Zjawiony JK, Zmijewski MA, Nguyen MN, Sweatman T, Miller D, Slominski A. Pathways and products for the metabolism of vitamin D3 by cytochrome P450scc (CYP11A1) FEBS J. 2008;275:2585–2596. doi: 10.1111/j.1742-4658.2008.06406.x. [DOI] [PMC free article] [PubMed] [Google Scholar]
- 13.Zbytek B, Janjetovic Z, Tuckey RC, Zmijewski MA, Sweatman T, Jones E, Nguyen MN, Slominski A. 20-Hydroxyvitamin D3, a product of vitamin D3 hydroxylation by cytochrome P450sc, stimulates keratinocytes differentiation. J Invest Dermatol. 2008;128:2271–2280. doi: 10.1038/jid.2008.62. [DOI] [PMC free article] [PubMed] [Google Scholar]
- 14.Tuckey RC, Stevenson PM. Properties of ferredoxin reductase and ferredoxin from the bovine corpus luteum. Int J Biochem. 1984;16:489–495. doi: 10.1016/0020-711x(84)90165-4. [DOI] [PubMed] [Google Scholar]
- 15.Tuckey RC, Stevenson PM. Properties of bovine luteal cytochrome P-450scc incorporated into artificial phospholipid vesicles. Int J Biochem. 1984;16:497–503. doi: 10.1016/0020-711x(84)90166-6. [DOI] [PubMed] [Google Scholar]
- 16.Woods ST, Sadleir J, Downs T, Triantopoulos T, Headlam MJ, Tuckey RC. Expression of catalytically active human cytochrome P450scc in Escherichia coli and mutagenesis of isoleucine-462. Arch Biochem Biophys. 1998;353:109–115. doi: 10.1006/abbi.1998.0621. [DOI] [PubMed] [Google Scholar]
- 17.Tuckey RC, Kamin H. Kinetics of the incorporation of adrenal cytochrome P-450scc into phosphatidylcholine vesicles. J Biol Chem. 1982;257:2887–2893. [PubMed] [Google Scholar]
- 18.De Caprio J, Yun J, Javitt NB. Bile acid and sterol solubilization in 2-hydroxypropyl-(-cyclodextrin. J Lipid Res. 1992;33:441–443. [PubMed] [Google Scholar]
- 19.Lambeth JD, Kitchen SE, Farooqui AA, Tuckey R, Kamin H. Cytochrome P-450scc-substrate interactions. Studies of binding and catalytic activity using hydroxycholesterols. J Biol Chem. 1982;257:1876–1884. [PubMed] [Google Scholar]
- 20.Tuckey RC, Nguyen MN, Slominski A. Kinetics of vitamin D3 metabolism by cytochrome P450scc (CYP11A1) in phospholipid vesicles and cyclodextrin. Int J Biochem Cell Biol. 2008;40:2619–2626. doi: 10.1016/j.biocel.2008.05.006. [DOI] [PMC free article] [PubMed] [Google Scholar]
- 21.Hiwatashi A, Nishii Y, Ichikawa Y. Purification of cytochrome P-450D1α (25-hydroxyvitamin D3-1α-hydroxylase) of bovine kidney mitochondria. Biochem Biophys Res Commun. 1982;105:320–327. doi: 10.1016/s0006-291x(82)80047-8. [DOI] [PubMed] [Google Scholar]
- 22.Slominski A, Pisarchik A, Zbytek B, Tobin DJ, Kauser S, Wortsman J. Functional activity of serotoninergic and melatoninergic systems expressed in the skin. J Cell Physiol. 2003;196:144–153. doi: 10.1002/jcp.10287. [DOI] [PubMed] [Google Scholar]
- 23.Slominski A, Pruski D. Melatonin inhibits proliferation and melanogenesis in rodent melanoma cells. Exp Cell Res. 1993;206:189–194. doi: 10.1006/excr.1993.1137. [DOI] [PubMed] [Google Scholar]
- 24.Omura T, Sato R. The carbon monoxide binding pigment of liver microsomes. I. Evidence for its hemoprotein nature. J Biol Chem. 1964;239:2370–2378. [PubMed] [Google Scholar]
- 25.Headlam MJ, Wilce MCJ, Tuckey RC. The F-G loop region of cytochrome P450scc (CYP11A1) interacts with the phospholipid membrane. BBA-Biomembr. 2003;1617:97–108. doi: 10.1016/j.bbamem.2003.09.007. [DOI] [PubMed] [Google Scholar]
- 26.Kazanci N, Toyran N, Haris PI, Svercan F. Vitamin D2 at high and low concentrations exert opposing effects on molecular order and dynamics of dipalmitoyl phosphatidylcholine membranes. Spectroscopy. 2001;15:47–55. [Google Scholar]
- 27.Merz K, Sternberg B. Incorporation of vitamin D3-derivatives into liposomes of different lipid types. J Drug Target. 1994;2:411–417. doi: 10.3109/10611869408996817. [DOI] [PubMed] [Google Scholar]
- 28.Ebert R, Schutze N, Adamski J, Jakob F. Vitamin D signaling is modulated on multiple levels in health and disease. Mol Cell Endocrinol. 2006;248:149–159. doi: 10.1016/j.mce.2005.11.039. [DOI] [PubMed] [Google Scholar]
- 29.Holick MF. Resurrection of vitamin D deficiency and rickets. J Clin Invest. 2006;116:2062–2072. doi: 10.1172/JCI29449. [DOI] [PMC free article] [PubMed] [Google Scholar]
- 30.Tuckey RC, Cameron KJ. Human placental cholesterol side-chain cleavage: enzymatic synthesis of (22R)-20(,22-dihydroxycholesterol. Steroids. 1993;58:230–233. doi: 10.1016/0039-128x(93)90024-h. [DOI] [PubMed] [Google Scholar]
- 31.Bikle D, Teichert A, Hawker N, Xie Z, Oda Y. Sequential regulation of keratinocyte differentiation by 1,25(OH)2D3, VDR, and its coregulators. J Steroid Biochem Mol Biol. 2007;103:396–404. doi: 10.1016/j.jsbmb.2006.12.063. [DOI] [PubMed] [Google Scholar]


