Abstract
p-Anilinoaniline (pAA) is an aromatic amine that is widely used in hair dying applications. It is also a metabolite of metanil yellow, an azo dye that is commonly used as a food coloring agent. Concentrations of pAA between 10–25 μM were cytostatic to cultures of the normal human mammary epithelia cell line MCF10A. Concentrations ≥ 50 μM were cytotoxic. Cytostatic concentrations induced transient G1 and S cell cycle phase arrests; whereas cytotoxic concentrations induced protracted arrests. Cytotoxic concentrations of pAA caused DNA damage, as monitored by the alkaline single-cell gel electrophoresis (Comet) assay, and morphological changes consistent with cells undergoing apoptosis and/or autophagy. Enzymatic and western blot analyses, and binding analyses of fluorescent labeled VAD-FMK, suggested that caspase family members were activated by pAA. Western blot analyses documented the conversion of LC3-I to LC3-II, a post-translational modification involved in the development of the autophagosome. Suppression of autophagosome formation, via knockdown of ATG7 with shRNA, prevented pAA-induced vacuolization, enhanced the activation of pro-caspase-3, and increased susceptibility of ATG7-deficient cells to the cytostatic and cytotoxic activities of markedly lower concentrations of pAA. Cells stably transfected with a nonsense shRNA behaved like parental MCF10A cells. Collectively, these data suggest that MCF10A cultures undergo autophagy as a pro-survival response to concentrations of pAA sufficient to induce DNA damage.
Keywords: apoptosis, autophagy, ATG7, MCF10A, p-anilinoaniline
Introduction
Macroautophagy (hereafter referred to as autophagy) is an evolutionarily conserved catabolic process. During autophagy, regions of the cytosol and intracellular organelles are encompassed into double membrane vesicles called autophagosomes (Klionsky and Emr, 2000). In mammalian cells the latter ultimately fuse with lysosomes (Mizushima et al., 2002; Klionsky and Emr, 2000). Upon fusion, the contents of the autophagosome are degraded and subsequently recycled (Klionsky and Emr, 2000; Yorimitsu and Klionsky, 2005).
Autophagy plays a critical role in the maintenance of cellular homeostasis. Although initially defined as an adaptive response to nutrient and growth factor deprivation (Onodera and Ohsumi, 2005; Lum et al., 2005), it is now clear that numerous agents causing cellular stress and damage induce autophagy. Pharmacological and molecular approaches for suppressing autophagy indicate that it often functions as a pro-survival response to stressors. For example, damaged mitochondria undergo targeted removal by a process termed mitophagy (Lemasters, 2005; Kim et al., 2007), and portions of the endoplasmic reticulum (ER) are sequestered in autophagosomes (ER-phagy) as a consequence of ER stress and the development of the unfolded protein response (Bernales et al., 2006, 2007). However, a significant number of studies also suggest that some stressors/cytotoxicants, in some cell types, specifically kill by an autophagic process (Kanzawa et al., 2003; Kessel et al., 2007; Park et al., 2007). Furthermore, it has been generally noted that cytotoxic concentrations of pro-apoptotic agents often kill apoptosis-defective/resistant tumors via the induction of autophagy (Shimizu et al., 2004; Buytaert et al., 2006; Kessel et al., 2006). Death by autophagy is sufficiently common so as to be considered a second form (Type II) of programmed cell death (Kroemer et al., 2005).
Cells undergoing autophagy or apoptosis exhibit several distinguishing morphological and biochemical features. Whereas apoptotic cells generally shrink, bleb, and have shrunken nuclei, cells undergoing autophagy generally enlarge but do not form blebs, develop autophagosomal vessicles which often appear as vacuoles, and have enlarged/swollen nuclei (Bursch, 2001; Mizushima, 2004). Autophagosomes can vary markedly in size, and exhibit a characteristic double membrane wall that can be easily visualized by electron microscopy (Mizushima, 2004). In addition, during autophagy microtubule-associated protein light chain 3-I (LC3-I) undergoes post-translational conjugation to phosphatidylethanolamine, to yield LC3-II (Kabeya et al., 2000). The latter molecule is a component of the autophagosome membrane, and is commonly used to monitor the occurance of autophagy by western blot analysis (Kabeya et al., 2000; Mizushima and Yoshimori, 2007). Finally, in contrast to apoptosis, pro-caspase activation is not a component of the autophagic process (Bursch, 2001; Mizushima, 2004). It should be noted that following cytotoxicant treatment, cultured cells may exhibit a very heterogenous response, with some cells appearing either apoptotic or autophagic, or a combination of both (see Kessel and Reiners, 2007a,b)
p-Anilinoaniline (pAA, also known as p-aminodiphenylamine, N-phenyl-1,4-benzenediamine) is currently used in a variety of mens’ personal care hair-dye products. It is also a major metabolite of metanil yellow (Srivastava et al., 1982), an agent used in a variety of industrial applications (see Introduction of Mittal et al., 2007), and the coloring of food (Khanna et al., 1985). Although classified as a moderate acute toxic agent (Singh et al., 1986), the underlying mechanism of toxicity is not understood. In recent studies, as a consequence of an in silico screening of a database displaying three dimensional structures of commercially available compounds, Banerjee (2006) tentatively identified pAA as a putative inhibitor of an E2 ligase involved in protein ubiquitination (pAA identified as 05RB in paper). Initial studies with cultures of the normal human mammary epithelial cell line MCF10A revealed that cytotoxic concentrations of pAA induced morphological changes consistent with the occurrence of autophagy and apoptosis. The current studies were initiated to determine if autophagy represented a pro-survival or pro-death response to pAA in the MCF10A culture model. Our data clearly indicate that pAA induces DNA damage and cell cycle arrest, and that autophagy serves a pro-survival role.
Material and methods
Materials
Trypsin/EDTA, epidermal growth factor, penicillin/streptomycin solution, and horse serum were purchased from Invitrogen (Carlsbad, CA). p-Anilinoaniline (pAA) was from Sigma-Aldrich (Milwaukee, WI). Ac-DEVD-AMC was obtained from BD Pharmingen (San Jose, CA). The Carboxyfluorescein Multi-Caspase Activity Kit (AK-117) was purchased from BIOMOL (Plymouth Meeting, PA). The small molecule Bcl-2 inhibitor ethyl 2-amino-6-bromo-4-(1-cyano-2-ethoxy-2-oxoethyl)-4H-chromene-3-carboxylate (HA14-1) was obtained from Ryan Scientific Inc. (Isle of Palms, SC). E64d was obtained from Peptide Institute, Inc. (Louisville, KY). Acetyl pepstatin A was purchased from Bachem (King of Prussia, PA).
Cell culture
MCF10A human breast epithelial cells were obtained from the Cell Lines Resource, Karmanos Cancer Institute (Detroit, MI), and maintained as attached cultures in supplemented Dulbecco’s modified Eagles’s medium/Ham’s F-12 medium as described by Guo et al. (2001). Cells were maintained at 37°C in a humidified atmosphere consisting of 95% air and 5% CO2. Cells were seeded at densities that assured exponential growth for at least 5 days. Cultures were washed and refed the day after plating. DMSO or different concentrations of pAA (dissolved in DMSO) were added 2 days after plating, and maintained in the medium throughout the experiment. Solvent never exceeded 0.1%. For analyses of proliferation, cells were released from culture dishes with trypsin/EDTA and counted with a hemocytometer. The ability to exclude trypan blue was used to assess cell viability. Phase contrast pictures were taken with an Olympus 1X71 microscope equipped with an attached Olympus DP70 digital camera (Olympus Imaging America Inc., Center Valley, PA).
Western Blot Analyses
The conditions used for the preparation of cell extracts, separation of proteins on SDS-polyacrylamide gels, and transfer of separated proteins onto nitrocellulose membranes, have been described in detail (Guo et al., 2001). Nonspecific antibody binding to transferred proteins was blocked by pre-incubating membranes in PBS-T (20 mM Tris-HCl, 150 mM NaCl, and 0.1% Tween-20) supplemented with 5% non-fat dry milk proteins. The membranes were incubated overnight at 4°C with a rabbit polyclonal antibody made to a peptide mapping to COOH terminus of human ATG7 (ProSci, Poway, CA), or a rabbit polyclonal antibody raised to microtubule-associated protein light chain 3 (LC3; a gift from Dr. David Kessel, Wayne State University), or a rabbit polyclonal antibody raised against the full length precursor of caspase-3 of human origin (Santa Cruz Biotechnology, Santa Cruz, CA), or a mouse monoclonal antibody raised to the amino terminus of β-actin (Sigma, Saint Louis, MO), or a rabbit monoclonal antibody raised against human GAPDH (Cell Signaling Technology, Danvers, MA). After washing with PBS-T, membranes were incubated with the appropriate horseradish peroxidase secondary antibody for 1.5 h at room temperature. Antibody detection was performed with an enhanced chemiluminescence reaction kit (Amersham Pharmacia Biotech, Piscataway, NJ), and recorded on x-ray film.
Cell Cycle Analyses
Exponentially growing cultures were treated with nothing, DMSO, or different concentrations of pAA. At the time of harvest, culture media with non-attached cells was removed and saved. Attached cells were released with trypsin/EDTA, combined with culture media, pelleted, and subsequently washed twice with phosphate-buffered saline (PBS), pelleted, and resuspended in PBS, which was followed by an addition of an equal volume of ethanol. The resulting cell suspension was stored at 4°C before being processed for DNA analysis. The procedure for propidium iodide staining of DNA has been described in detail (Reiners et al., 1999). Stained cells were analyzed on a BD Biosciences FACScaliber instrument (BD Biosciences, San Jose, CA). Percentages of cells in G1, S, and G2/M stages of the cell cycle were determined with a DNA histogram-fitting program (MODFIT; Verity Software, Topsham, ME). A minimum of 2×10⁴ events/sample were collected for subsequent analyses.
Alkaline Comet Assay and Quantification of DNA damage
We used a modified version of the alkaline comet assay described by Olive et al. (2001). Briefly, 50 μL of non-treated or treated cells (~1 × 10⁴ cells) were mixed with 450 μL of 0.5% low-melting agarose at 37°C. A total of 100 μL of mixture was layered on each microscope slide that had been pre-coated with 1% normal melting agarose. After a brief incubation on ice to hasten solidification, a third layer of 0.5% low-melting agarose was placed on top of the cell culture/low-melting agarose layer and covered with a coverslip. The coverslips were removed after the third layer of agarose had completely solidified. Thereupon, the cells were lysed overnight at 4°C in freshly prepared 1x lysis buffer (2.5 M NaCl, 100 mM EDTA, 10 mM Tris-HCl, 1% Triton, pH 10). After cell lysis, the slides were placed in an alkali buffer (300 mM NaOH, 1 mM EDTA, pH >13) at 4°C for 20 min to allow DNA denaturing, unwinding, and exposure of the alkali-labile sites. To separate damaged DNA from nuclei, a constant electric current of 297 mA was applied for 30 min at 4°C. After electrophoresis, the slides were neutralized by washing 3 times for 5 min with 0.4 M Tris-HCl (pH 7.4), fixed in absolute ethanol, dried at room temperature, and then stored at 4°C until analysis. The slides were stained with propidium iodide, and analyzed by fluorescent microscopy. A computer-based image analysis system (Kinetic Imaging, Ltd., Bromborough, Wirral, U.K.) was used to measure the tail moment values. A total of 100 images (50 random nuclei from two duplicate slides) were scored. The mean olive tail moment value was used as the indicator of DNA damage.
DEVDase assay
The conditions used for preparation of cell lysates, and performance of the DEVDase assay, have been described in great detail (Joiakim et al., 2004). Caspase-3/7 dependent cleavage of Ac-DEVD-AMC to yield AMC was monitored in real time with a 96 well fluorescence plate reader. Changes in fluorescence over time were converted into picomoles of product by comparison to a standard curve made with AMC. DEVDase-specific activities are reported as nmoles of product per minute per milligram of protein. The bicinchoninic acid assay, using BSA as a standard, was used to estimate protein concentrations.
shRNA transfection
A retroviral vector encoding a short hairpin RNA (shRNA) construct against human ATG7 was obtained from Open Biosystems (catalog # RHS1764-97182209; Huntsville, AL). A scrambled non-silencing (nonsense) short hairpin RNA vector was also obtained from Open Biosystems. MCF10A cultures were plated in 35 mm dishes at a density to yield ~70% confluency by the next day. Cultures were transfected using Arrest-In™ (Open Biosystems, Huntsville, AL), according to the instructions provided by the manufacturer. Transfectants were selected by continuous growth for three weeks in media containing 1.5 μg/mL puromycin (concentration empirically determined as sufficient to kill all cells not carrying the resistance gene). ATG7 contents were analyzed by western blot analyses after 3 weeks of selective growth. Plates exhibiting the desired phenotype were individually expanded for subsequent freezing and storage. Cultures were not subjected to additional cloning. Hence, the shRNA transfected cells used in our studies represent heterogeneous populations, as opposed to clonal lines. shRNA stable lines were carried in the presence of puromycin. However, actual experiments were performed with media lacking the inhibitor.
FAM-VAD-FMK analysis
A 12-well plate was seeded with MCF10A cells. The next day, media was removed and replaced with 1.5 mL fresh media. Individual wells were treated 24, 48, or 72 h prior to harvest with 25 or 100 μM pAA. On harvest day, media was transferred to a microcentrifuge tube in order to collect any non-attached cells, and fresh media was added to the wells. Cells in the spent media were pelleted by low speed centrifugation, and resuspended in 600 μL of fresh media. Wells were subsequently aspirated dry, and covered with either the resuspended cells, or 600 μL of fresh media. The following steps were all performed under reduced light conditions, and used the materials supplied in the BioMol Carboxyfluorescein Multi-Caspase Activity Kit. Specifically, 0.8 μL of 150x FAM-VAD-FMK (final concentration in assay is 1 μM) was added to the appropriate wells, and incubated for 10 min in the dark, at 37°C in a 5% CO2 incubator. Media and subsequent PBS washes from individual wells were pooled and stored on ice. Adherent cells were released with trypsin/EDTA, and added to the cell suspensions, along with a PBS rinse of the plate. Cell suspensions were pelleted by centrifugation at low speed, at 4°C. Supernatant was discarded, and cells were gently resuspended in 2 mL PBS, and pelleted as before. Pellets were resuspended in 400 μL 1x wash buffer, to which was added 40 μL 10x fixative solution. After a 10 min incubation on ice, sample volumes were adjusted to ~1 mL with PBS, and immediately analyzed by FACS. Forward versus 90° side scatter analyses were used to set gates restricting subsequent data collection to cells, and not debris. Cell-associated FAM-VAD-FMK fluorescence was analyzed in the FL1-H channel. A minimum of 104 gated events/sample were collected for subsequent analyses. Meaningful and reproducible use of this assay required short incubation times, with low concentrations of the FMK inhibitor, and careful gating to avoid inclusion of debris.
Statistical Analysis
Statistical significance of differences was assessed by one-way ANOVA followed by Tukey’s multiple comparison test, using GraphPad Prism Version 4.02 for Windows (GraphPad Software, San Diego, CA); p < 0.05 was considered statistically significant.
Results
pAA effects on the cell cycle
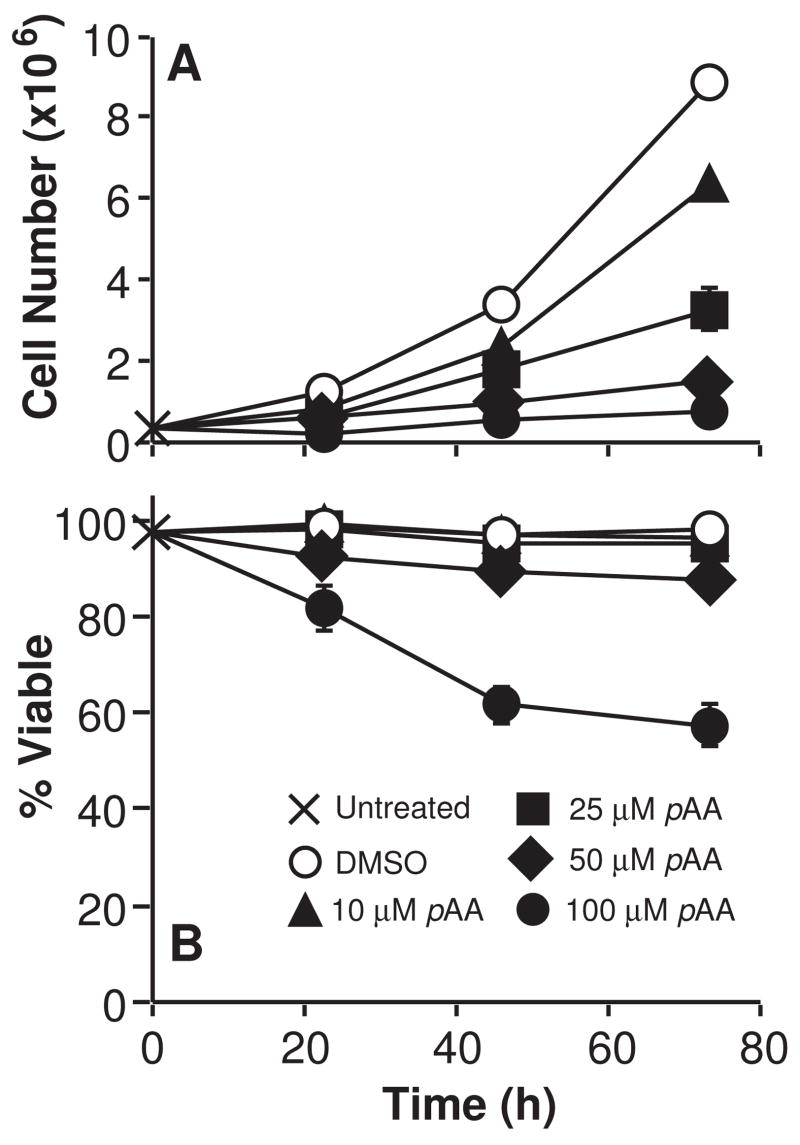
MCF10A cells were treated with varying concentrations of pAA (10 – 100 μM) over a three-day period. Figure 1A shows that pAA inhibited cell proliferation in a concentration dependent fashion at ≥ 10 μM. pAA was cytostatic at 10 – 25 μM, and cytotoxic at ≥ 50 μM (Fig. 1B).
Fig. 1.
Cytostatic and cytotoxic effects of pAA. Exponentially growing cultures of MCF10A cells were treated with nothing (X), DMSO (○), or different concentrations of pAA (▲10 μM, ■ 25 μM, ◆ 50 μM, ● 100 μM). Cultures were harvested at various times after treatment for analyses of cell number (A) and viability (B), as monitored by the ability to exclude trypan blue. Cell number and viability data represent the means ± SD of three plates. Similar data were obtained in two additional experiments.
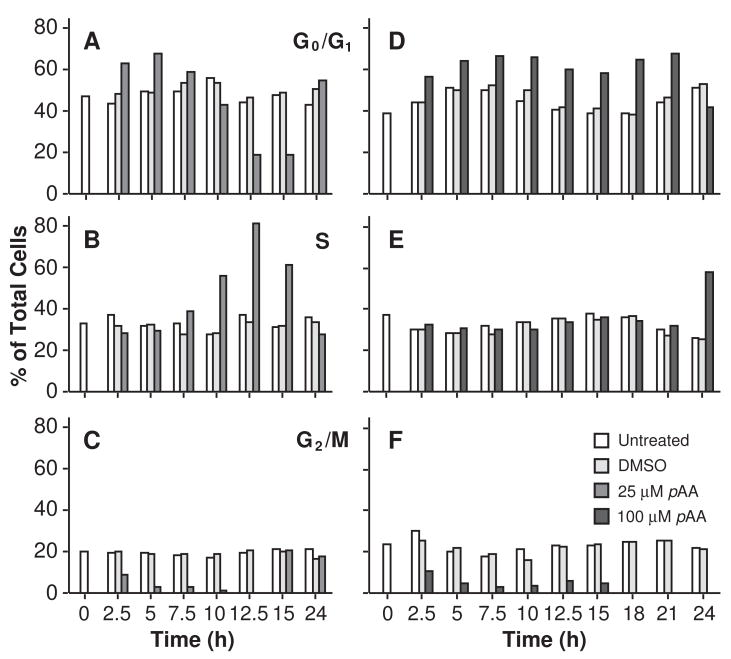
Flow cytometry was used to determine the effects of pAA on cell cycle distribution and progression. Exposure to DMSO had no effect on cell cycle parameters during the first 24 h (Fig. 2A–F), and the subsequent 42 h (data not presented). Exposure to 25 μM pAA caused transient accumulations of G1 phase cells within 2.5 – 5 h of treatment (Fig. 2A), and a sustained S phase arrest and loss of G2/M cells that lasted at least 12.5 h (Figs. 2B and C, respectively). By 15 h cells were cycling into G2/M, and by 24 h cell cycle distribution patterns had returned to near normal (Figs. 2A–C). Exposure to 100 μM pAA caused similar, but more protracted responses. Specifically, at the higher pAA concentration the G1 arrest lasted for ~21 h (Fig. 2D). The absence of G2/M phase cells (Fig. 2F) suggested that the S phase arrest was sustained for at least 24 h (Fig. 2E).
Fig. 2.
Effects of pAA on cell cycle progression. MCF10A cultures were either left untreated, or exposed to DMSO, or 25 μM (A,B,C) or 100 μM (D,E,F) pAA prior to being harvested. Cell cycle distribution was evaluated using propidium iodide staining of DNA, which was analyzed by flow cytometry. Data similar to that reported in the figure were obtained in a second independent experiment. Bars are defined in the figure.
pAA induced DNA damage
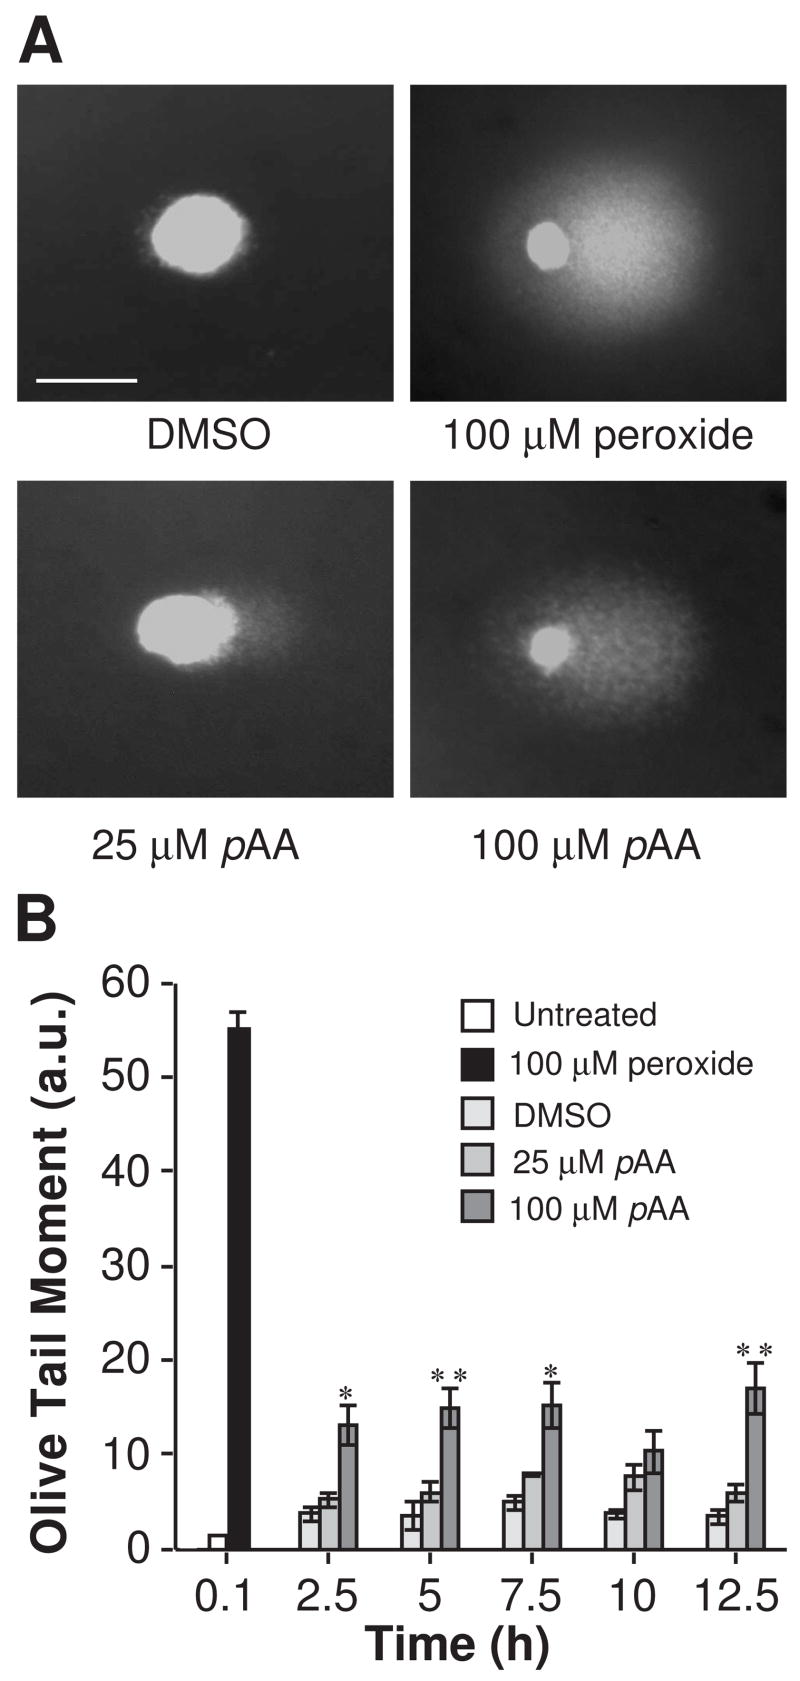
An S phase arrest is often indicative of DNA damage and potential problems with DNA replication. Although the data are controversial, and possibly test system dependent, some studies suggest that pAA may be genotoxic (see Scientific Committee on Consumer Products, 2006). The Comet assay is commonly used to screen for toxicant-induced DNA damage (Collins et al., 1997). In this assay cells with DNA damage exhibit a DNA staining pattern that resembles a comet. The length of the fluorescent tail correlates to the extent of DNA strand breaks. Figure 3A shows representative analyses of DNA staining patterns in the Comet assay. DMSO-treated cells did not form comets. In contrast, exposure of MCF10A cells to H2O2 (100 μM) promoted significant comet formation. The ability of H2O2 to induce DNA strand breaks in MCF10A cells is documented (Starcevic et al., 2003), and was used as a positive control. The mean olive tail moment value for cultures exposed to H2O2 was 55.2 ± 1.79 (Fig. 3B). Relative to the solvent control, 25 μM pAA caused insignificant increases in mean olive tail moments (Fig. 3B). In contrast, mean olive tail moments in 100 μM pAA treated cultures were 3–6 fold greater than those calculated for solvent controls (Fig. 3B). Interestingly, maximal damage was achieved within 2.5 h of treatment, and did not markedly change during the following 10 h.
Fig. 3.
Comet assay analysis of MCF10A cells following treatment with DMSO, H2O2 or pAA. (A) Representative staining patterns of cells exposed to H2O2 (100 μM, 5 min) or DMSO (2.5 h) or pAA (2.5 h). Cells appeared as comets with a bright fluorescent head and a tail, whose length and fluorescent intensity are indicative of the extent of DNA damage. The magnification bar equals 100 μm. (B) Quantitative analyses of DNA damage, as monitored by Olive Tail Moment in 100 cells. Data represent means ± SEM. Comparisons are to DMSO controls for each time point; * p < 0.05 and ** p < 0.001
Morphological features of pAA-treated cultures
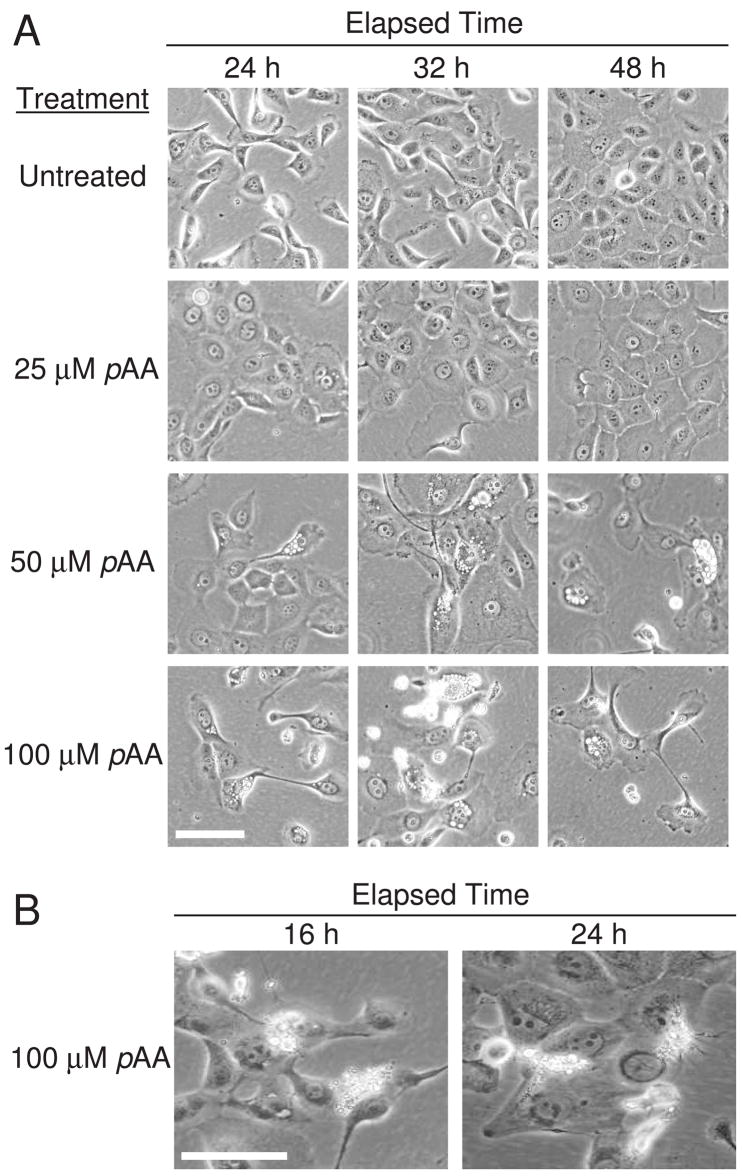
The overall morphology of MCF10A cultures exposed to a cytostatic concentration of pAA (25 μM) was comparable to control cultures (Fig. 4A). The only notable differences were that the pAA-treated cells had flattened, and were slightly larger. Cytotoxic concentrations of pAA induced the appearances of an attached population that was enlarged, flattened, and vacuolated (Fig. 4A), and a fairly predominant detached population having the morphological characteristics of apoptotic cells (e.g., blebbed and shrunken, shrunken nuclei, appearance of apoptotic bodies; Fig. 4A and enlargement in 4B). Vacuoles were observed within 8 h of treatment (Table 1), and appeared earlier in cultures treated with the higher cytotoxic concentration of pAA (Table 1). Repeated viewings of the same fields of cells by phase contrast microscopy, over a 48 h period, suggested that the apoptotic cells observed after 32–48 h of 100 μM pAA treatment were derived from attached, flattened, vacuolated cells (data not presented).
Fig. 4.
Morphology of MCF10A cells following exposure to pAA. (A) MCF10A cultures were left untreated, or exposed to different concentrations of pAA, for different lengths of time, prior to being photographed. (B) Enlargements of detached, refractive cells observed in panel A. Morphologies are consistent with cells undergoing apoptosis. Magnification bars in panels A and B equal 100 μm.
Table 1.
MCF10A vacuolization as a function of pAA concentration and length of exposure
| Time (h) | Phenotype | (Cells with phenotype/total cells) ×100 = % cells with phenotype
|
||
|---|---|---|---|---|
| DMSO | 50 μM pAA | 100 μM pAA | ||
| 8 | Dead | ND | 17/395 ×100 = 4.3 | 27/336 ×100 = 8.0 |
| 16 | Dead | 1/120 ×100 = 0.8 | 14/37 ×100 = 3.7 | 53/260 ×100 = 20.4 |
| 24 | Dead | 2/127 ×100 = 1.6 | 25/284 ×100 = 8.8 | 76/295 ×100 = 25.8 |
| 32 | Dead | 1/154 ×100 = 0.6 | 19/226 ×100 = 8.4 | 71/224 ×100 = 31.7 |
| 48 | Dead | 2/160 ×100 = 1.3 | 10/115 ×100 = 8.7 | 33/156 ×100 = 21.2 |
| 8 | Vacuolated | ND | 5/395 ×100 = 1.3 | 16/336 ×100 = 4.8 |
| 16 | Vacuolated | 0/120 ×100 = 0 | 9/434 ×100 = 2.1 | 30/260 ×100 = 11.5 |
| 24 | Vacuolated | 0/127 ×100 = 0 | 36/284 ×100 = 12.7 | 29/295 ×100 = 9.8 |
| 32 | Vacuolated | 0/154 ×100 = 0 | 18/226 ×100 = 8.0 | 18/224 ×100 = 8.0 |
| 48 | Vacuolated | 0/160 ×100 = 0 | 10/115 ×100 = 8.7 | 11/156 ×100 = 7.1 |
Phase contrast microscopy and a digital imaging system were used to photograph MCF10A cultures at various times after exposure to DMSO or 50 or 100 μM pAA. Hard copies of captured images were subsequently scored for total cell number, vacuolated cells, and dead cells. The latter cell population was possibly underestimated since only cells that were clearly apoptotic, and/or detached with intact membranes but coalesced contents, were scored as dead. Data are derived from analyses of 3–6 fields per time point, per treatment group. ND = not determined.
Pro-caspase activation
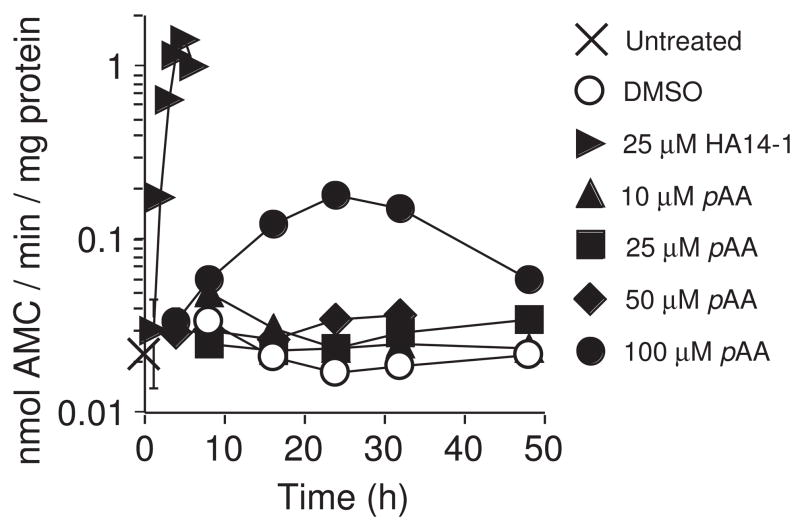
Given the appearance of cells with morphological features suggestive of apoptosis, we anticipated seeing an activation of pro-caspases-3/7 in pAA-treated cultures. DEVDase specific activities (a measure of active caspases-3/7) were elevated ~3-fold in cultures treated with 100 μM pAA (Fig. 5). Lower concentrations of pAA did not elevate DEVDase activities. MCF10A cultures are capable of much higher levels of activation. Indeed, exposure to a concentration of the small molecule Bcl-2 inhibitor HA14-1 (Wang et al., 2000), sufficient to induce apoptotic blebbing in >75% of the cells, elevated DEVDase activities ~30-fold within 3 h of treatment (Fig. 5).
Fig. 5.
DEVDase activities in pAA-treated cultures. MCF10A cultures were treated with DMSO, or HA14-1 (25 μM), or different concentrations of pAA (10, 25, 50 and 100 μM) for varying times before being harvested for DEVDase assays. Symbols are defined in the figure. Data represents the mean ± SD for three determinations made on the same sample. Similar results were obtained in a second independent experiment.
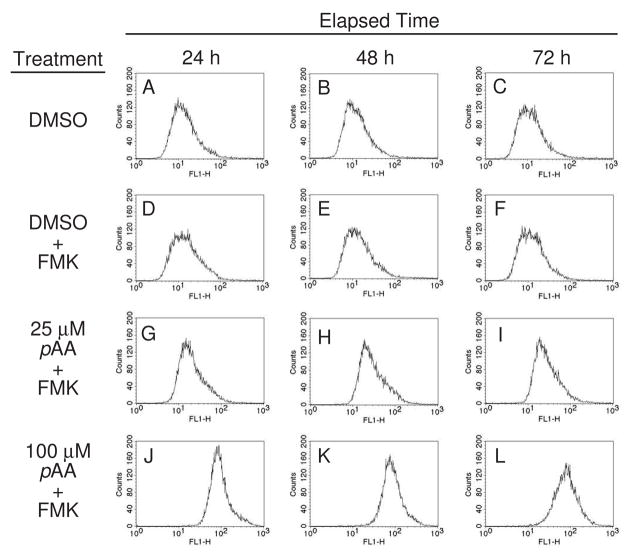
In subsequent studies we employed a carboxyfluorescein (FAM) derivative of valine-alanine-aspartic acid-fluoromethyl ketone (FAM-VAD-FMK) to monitor pro-caspase activation. This agent is a fluorescent pan-caspase inhibitor, and has been used for the in situ monitoring of pro-caspase activation in living cells (Bedner et al., 2000; Amstad et al., 2001). Cultures were exposed to either DMSO or pAA (25 or 100 μM) over a 72 h period prior to being labeled with FAM-VAD-FMK, and analyzed by flow cytometry. The profiles presented in Figs. 6A–C represent cultures not stained with FAM-VAD-FMK, and are the profiles to which comparisons should be made. Cultures treated with only DMSO, and subsequently stained, yielded profiles virtually identical to non-stained controls (compare Figs. 6A–C with D–F). Cultures treated with a non-cytotoxic concentration of pAA (25 μM) exhibited an ~2-fold increase in staining intensity (compare Figs. 6D–F with G–I). In contrast, staining intensities increased ~10-fold in cultures treated with 100 μM pAA (compare Figs. 6D–F with J–L).
Fig. 6.
Binding of a fluorescent pan-caspase inhibitor to pAA-exposed MCF10A cultures. Cultures were treated with DMSO or pAA (25 or 100 μM) for 24, 48 or 72 h prior to being exposed to FAM-VAD-FMK, and processed and analyzed as described in Materials and Methods. FACS was used to monitor cell-bound fluorescent caspase inhibitor. Data represent 104 scored events.
pAA-induction of autophagic markers
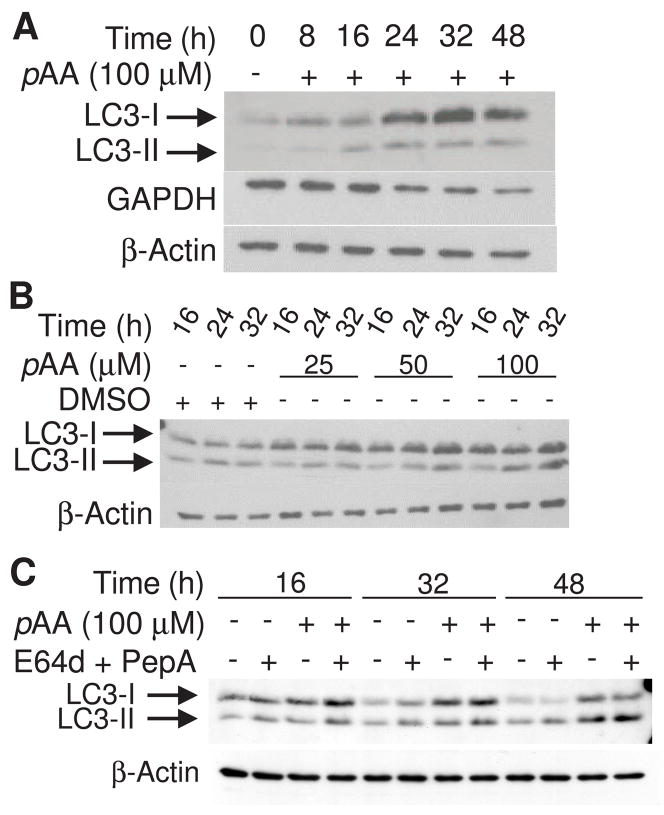
Microtubule associated protein LC3, the human homologue of the yeast gene Atg8, localizes to the autophagosome membrane during autophagy (Kabeya et al., 2000). Two forms of LC3 proteins exist in cells: the cytosolic LC3-I form, and the autophagosome membrane incorporated LC3-II form (Mizushima et al., 2001). LC3-II is derived from LC3-I by post-translational modification (Kabeya et al., 2000; Kabeya et al., 2004). The appearance of LC3-II is commonly used as a marker of autophagy (Mizushima and Yoshimori, 2007). Western blot analysis indicated that little LC3-II was present at the time of treatment with 100 μM pAA, but became detectable within 16 h (Fig. 7A). Thereafter, there was a marked increase in LC3-I contents, and a sustained accumulation of LC3-II. A less cytotoxic concentration of pAA (50 μM) also caused the accumulation of LC3-II (Fig. 7B). In contrast, a cytostatic, but non-cytotoxic concentration of pAA (25 μM) did not cause LC3-II accumulation (Fig. 7B).
Fig. 7.
pAA-induced LC3 processing. MCF10A cultures were treated with nothing or 100 μM pAA (A) or DMSO and 25, 50 or 100 μM pAA (B) for varying times prior to being harvested and assayed by western blot analysis for expression of LC3-I and -II, GAPDH or β-actin. (C) Cultures were treated with nothing, 100 μM pAA, and/or 10 μM E64d plus 1 μM acetyl pepstatin A. Cultures were harvested 16, 32 and 48 h after pAA addition. E64d and acetyl pepstatin A were added 30 min prior to the addition of pAA. Each lane contained 40 μg of protein.
Quantification of LC3-II is confounded by its degredation following fusion of autophagosomes with lysosomes. The cell permeable protease inhibitors E64d and acetyl pepstatin A are commonly added to cultures inorder to prevent LC3-II degradation by lysosomal cysteine and aspartate cathepsins (Mizushima and Yoshimori, 2007). Co-incubation of pAA-treated MCF10A cultures with the two protease inhibitors increased the amounts of LC3-II detected at 16, 32 and 48 h post treatment (Fig. 7C).
Macroautophagy is often accompanied by the activation of a second form of autophagy termed chaperone-mediated autophagy (CMA). The latter process differs from macroautophagy in that it involves the selective transport of a limited number of specific proteins to the lysosomes for degradation (Majeski and Dice, 2004; Cuervo, 2004). Glyceraldehye-3-phosphate dehydrogenase (GAPDH) is a target protein for CMA (Cuervo, 2004). GAPDH contents decreased in 100 μM pAA-treated cultures with kinetics that paralleled the activation of macroautophagy (Fig. 7A).
Effects of ATG7 knockdown
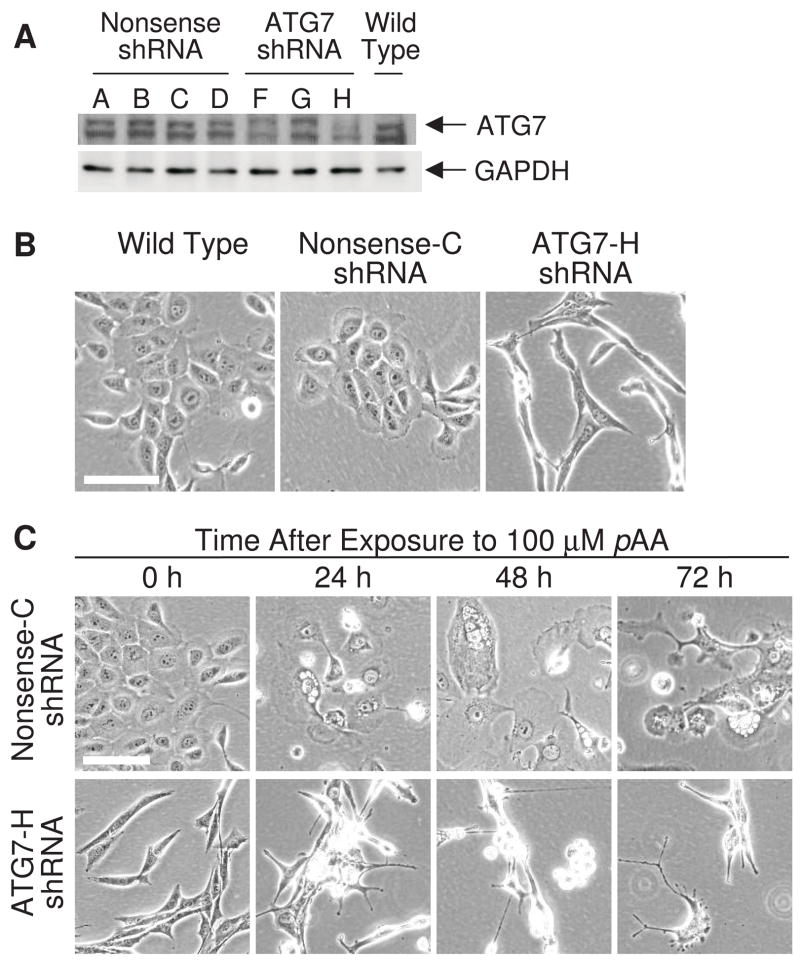
Recent studies suggest that autophagy can play either a pro-survival or pro-death role following toxicant exposure. The protein encoded by autophagy-related gene-7 (ATG7) catalyzes two conjugation reactions critical to the generation of the autophagosome (Tanida et al., 2001; Komatsu et al., 2005). Hence, comparisons of ATG7-containing and -deficient cells are commonly used to assess the role of autophagy in mediating cell survival or death responses to toxicant exposures. ATG7 protein contents were markedly decreased following transfection and selection of MCF10A cultures with short hairpin RNA (shRNA) against human ATG7 mRNA (Fig. 8A). ATG7 contents in the ATG7 shRNA F and H cell lines were reduced ≥ 75% relative to the parental line. ATG7 contents were not affected in cultures stably transfected with vectors expressing nonsense shRNA (Fig 8A). Cell lines designated Nonsense-C and ATG7-H were selected for further experiments. Non-treated Nonsense-C cells (as well as Nonsense-A,B and D cells) were morphologically similar to parental wild-type MCF10A cultures (Fig. 8B). In comparison, ATG7-H cultures (as well as ATG7-F) were elongated and appeared much more fibroblastic (Fig. 8B). Following exposure to 100 μM pAA the Nonsense-C line responded like the parental line. Many cells underwent apoptosis and others flattened and vacuolated (top row of Fig. 8C). In contrast, comparably treated ATG7-deficient cells ‘rounded-up’, and underwent morphological changes consistent with apoptosis, but exhibited no signs of vacuolation (bottom row of Fig. 8C).
Fig. 8.
Effects of ATG7 knockdown on cell morphology. (A) Western blot analyses of ATG7 in puromycin-resistant stable transfectants of nonsense shRNA (cell lines A,B,C,D) and ATG7 shRNA (cell lines F,G,H). (B) Phase contrast images of wild type MCF10A cells, and derivatives expressing either nonsense shRNA or ATG7 shRNA. (C) Phase contrast images of MCF10A derivatives expressing nonsense shRNA or ATG7 shRNA following 24, 48 and 72 h of exposure to 100 μM pAA. Magnification bars in panels B and C equal 100 μm.
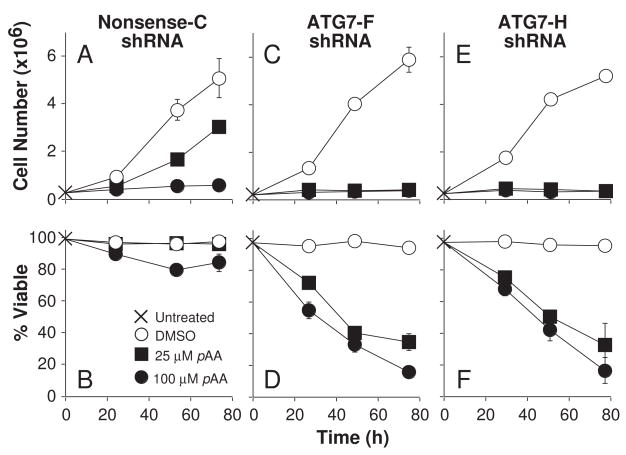
Cell proliferation and viability assays indicated that Nonsense-C shRNA cells and parental MCF10A cells were comparable in their sensitivities to the cytostatic and cytotoxic effects of pAA (compare Figs. 1 with 9A and B). The Nonsense-A and -B shRNA cell lines also exhibited sensitivities to pAA that were similar to parental MCF10A cells (data not presented). In contrast, the ATG7-deficient cell lines were more susceptible than their ATG7-containing counterparts to pAA-mediated killing (Fig. 9). Whereas 100 μM pAA was only modestly cytotoxic to the Nonsense-C shRNA cell line (Fig. 9B), it was very cytotoxic to two independent ATG7-deficient cell lines (Figs. 9D and F). Even more striking were the results obtained with 25 μM pAA. Whereas this concentration was not cytotoxic, and only partially cytostatic in the Nonsense-C cell line, it completely suppressed the proliferation of, and was highly cytotoxic to, the two ATG7-deficient cell lines (compare Figs. 9A with C and E, and Figs. 9B with D and F). Subsequent analyses indicated that ATG7-deficiency also enhanced the cytostatic effects of 10 μM, but not 5 μM pAA (data not presented).
Fig. 9.
Effects of ATG7 knockdown on pAA-induced cytotoxicity. MCF10A derivatives expressing nonsense shRNA (A,B) or ATG7 shRNA (C–F) were treated nothing (X), DMSO (○), 25 μM pAA (■), or 100 μM pAA (●) for indicated times before being harvested for analyses of cell number (A,C,E) and viability (B,D,F). Data represent means ± SD of three plates. Similar data were obtained in a second independent study.
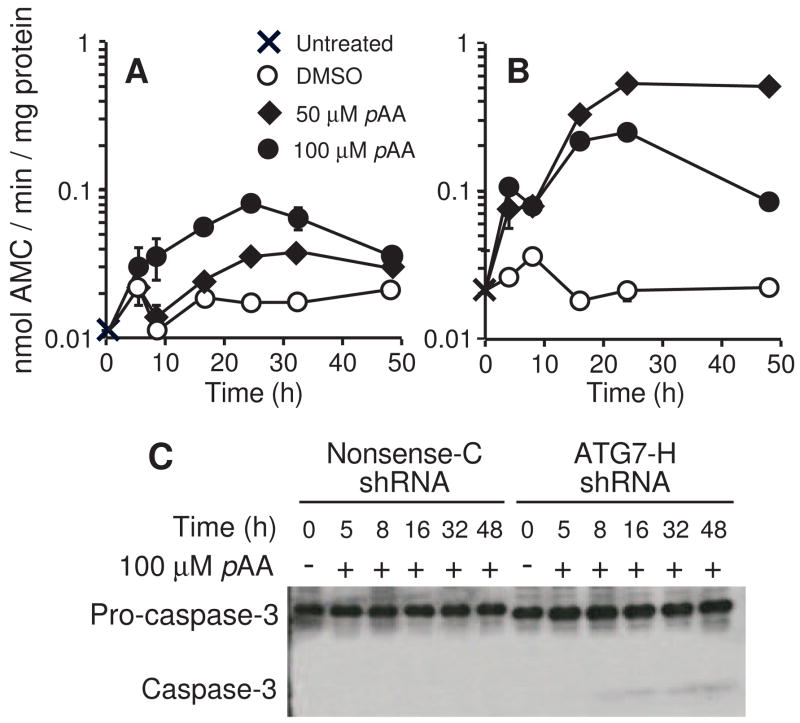
ATG7 deficiency markedly enhanced pAA-induced apoptosis, as monitored by measurements of DEVDase activities (Fig. 10). Whereas exposure to 100 μM pAA increased DEVDase activities ~4 fold in the ATG7-containing Nonsense-C cell line (Fig. 10A), increases of ~30-fold occurred in the ATG7-deficient ATG7-H cell line (Fig. 10B). Although we were unable to detect cleavage products of pro-caspase-3 in Nonsense-C cultures, a cleavage product was observed in lysates of the ATG7-H cell line (Fig. 10C).
Fig. 10.
Caspase activation in ATG7 knockdown cultures. Nonsense-C shRNA (A) and ATG7-H shRNA (B) cultures were treated with either nothing (X), DMSO (○), 50 μM (◆) or 100 μM (●) pAA for different lengths of time before being harvested for DEVDase analyses. Data represents means ± SD for three determinations made on a single sample. (C) Western blot analysis of pro-caspase-3 activation in Nonsense C and ATG7-H cultures following exposure to 100 μM pAA. Each lane contained 40 μg of protein. Similar results were obtained in a second experiment.
Discussion
pAA is extensively used in hair coloring products, and is a major metabolite of metanil yellow (Srivastava et al., 1982). The latter is extensively used in the paper, textile, and lacquer/stain industries (see Mittal et al., 2007). Although not approved for internal use, metanil yellow is also commonly used as a food coloring agent in India (Khanna et al., 1985). In vivo studies with rodents have identified several organs and physiological processes susceptible to pAA-induced toxicity (Raza et al., 1982; Singh et al., 1986). Although classified as a moderate acute toxic agent (Singh et al., 1986), the underlying mechanisms of toxicity are not understood, and are characterized by contradictory literature (see summary provided in: Scientific Committee on Consumer Products, 2006). In the current study, concentrations of pAA ≥ 10 μM were cytostatic, and concentrations ≥ 50 μM were cytotoxic to parental MCF10A cells. The anti-proliferative effects correlated with the induction of G1 and S phase arrests, with the durations of arrest being influenced by pAA concentration. Indeed, cytotoxic concentrations of pAA induced a protracted S phase arrest. This arrest may have been the consequence of pAA-induced DNA damage (as monitored by the Comet Assay). DNA-damaging agents commonly induce S phase arrest (Qin and Li, 2003; Kaufmann, 2007; Yao et al., 2007). However, the exact nature of the pAA-induced DNA damage in MCF10A cultures is unknown. The alkaline single cell Comet assay detects single and double strand DNA breaks, DNA cross links, and a variety of alkaline sensitive lesions (Collins et al., 1997). As utilized, the Comet assay did not distinguish amongst these possibilities.
Following DNA damage the damage sensors ATR/ATM detect DNA lesions, and activate CHK1 kinase by direct phosphorylation (see numerous references within Chen and Poon, 2008). Subsequently, activated CHK1 phosphorylates Cdc25A, which triggers the proteolytic destruction of the phosphatase (Mailan et al., 2000). Loss of Cdc25A can facilitate both G1 and S phase arrest via several mechanisms (Sancar et al., 2004; Chen and Poon, 2008). In preliminary studies we have found that 100 μM pAA induces an activating phosphorylation of CHK1 (serines 317 and 345) within 2.5 h of treatment, that is sustained for an additional 10 h (Reiners, unpublished data). In principle, this effect could explain the G1 and S phase arrests observed in pAA-treated MCF10A cultures. Activation of CHK1 often, but not always, leads to p53 stabilization and the synthesis of the cyclin-dependent kinase inhibitor p21 (Sancar et al., 2004; Chen and Poon, 2008). Interestingly, CHK1 phosphorylation in pAA-treated MCF10A cultures was not accompanied by increases in p21. This result was not due to a defect in the CHK1/p53/p21 axis. Treatment of MCF10A cultures with cisplatin induced both CHK1 phosphorylation and p21 expression (Reiners, unpublished data).
MCF10A cultures exposed to cytotoxic concentrations of pAA developed the characteristics of cells undergoing apoptosis or autophagy. At the morphological level, cells undergoing apoptosis appeared shrunken, underwent blebbing, and eventually formed multiple apoptotic bodies. In contrast, putative autophagic cells appeared flattened, enlarged, and developed vacuoles. Biochemical analyses confirmed the occurrence of both apoptosis (DEVDase activation and Z-VAD-FMAK binding) and autophagy (LC3-I to LC3-II conversion) in the cultures. The occurrence of autophagy in pAA-treated cultures was further suggested by two additional findings. First, pAA-induced vacuolization was suppressed in MCF10A variants deficient in ATG7, an enzyme critical for autophagosome formation (Komatsu, et al., 2005). Second, GAPDH levels decreased in pAA-exposed cultures, with kinetics paralleling the conversion of LC3-I to LC3-II. GAPDH is a substrate for chaperone-mediated autophagy (CMA), a form of autophagy that targets select cytosolic proteins to the lysosome for degradation (Majeski and Dice, 2004; Cuervo, 2004). CMA is generally activated in cells undergoing macroautophagy (Cuervo, 2004).
The role of autophagy as a pro-survival or pro-death pathway is controversial. Numerous studies utilizing molecular and pharmacological approaches to suppress autophagosome formation suggest diverse roles for autophagy in stressed cells. For example, the induction of autophagy in some cell types either delays cell death, or enhances overall cell survival, following growth factor deprivation (Lum et al., 2005; Onodera and Ohsumi, 2005), or exposures to a pore-forming bacterial toxin (Gutierrex et al., 2007), camptothecin (Abedin et al., 2007), etoposide and temozolomide (Katayama et al., 2007), tunicamycin and thapsigargin (Ogata et al., 2006), or low dose photodynamic therapy with an endoplasmic reticulum photosensitizer (Kessel and Reiners, 2007b). In contrast, autophagic processes appear totally or partially responsible for the death of L1210 leukemia cells caused by the quinoxaline antitumor agents XK469 and SH80 (Kessel et al., 2007), or after high dose PDT with an ER photosensitizer (Kessel and Reiners, 2007b). Similarily, an agonistic monoclonal antibody that targets TRAIL-R2/DR5 has been reported to induce autophagic death in several tumor cell lines (Park et al., 2007). In addition, it has been generally noted that cell lines unable to mount an apoptotic response often die by autophagic processes following exposure to pro-apoptotic agents (Buytaert et al., 2006; Kessel et al., 2006; Shimizu et al., 2004). The complexicity of the autophagy pro-survival/pro-death issue is emphasized by the observations that autophagy and apoptosis can sequentially or simultaneously occurr in the same cells following exposure to some toxicants (Kessel and Reiners, 2007a,b). The role that autophagy plays in such situations is equivocal unless detailed studies are performed to specifically address the role of autophagy. For example, in the case of photodynamic therapy protocols with ER and mitochondrial sensitizers, the degree of photoinduced damage dictates whether autophagy represents a pro-survival or pro-death pathway (Kessel and Reiners, 2007b).
In the current study, pAA-treated MCF10A cultures exhibited both apoptotic and autophagic features. However, which morphological features were expressed were pAA concentration dependent. Specifically, autophagic features predominated in cultures treated with 50 μM pAA; whereas, at 100 μM both autophagic and apoptotic cells were observed. Based upon repeated observations of the same fields of cells over a 48 h period, it appeared that apoptotic cells in the 100 μM pAA treatment group were derived from attached, flattened, and vacuolated cells. Presumably, at the higher concentration of pAA, the degree of cellular damage exceeded the pro-survival capacity of the induced autophagic response. Analyses with the ATG7 knockdown cell lines confirmed that autophagy was a pro-survival response. Specifically, ATG7-deficiency and the resultant inability to mount an autophagic response decreased the LD50 for pAA by greater than 4-fold (from > 100 μM to ≤ 25 μM), and enhanced the apoptotic response ~6-fold (as monitored by DEVDase activation). Potentiation of cytotoxicant-induced apoptosis by blocking autophagy has been previously reported (Boya et al., 2005; Apel et al., 2008). The current study, in conjunction with recent reports on camptothecin (Abedin et al., 2007), etoposide and temozolomide (Katayama et al., 2007), strongly support the concept that cells, in addition to initiating cell cycle arrest, also initiate autophagy as a pro-survival response to DNA-damaging agents.
The morphologies of the ATG7 knockdown cell lines and their nonsense shRNA counterparts were strikingly different. Whereas the latter ATG7-containing lines exhibited a typical epithelial morphology, the ATG7-deficient lines had an elongated, fibroblastic appearance. The basis for the noted phenotype is unclear. In vitro studies indicate that autophagy occurs constitutively, to varying degrees, in a variety of cell lines grown under nutrient-rich, optimal conditions (Tanida et al., 2005). At issue is whether ATG7 has an unrecognized function that directly affects processes that modulate cell morphology, or if the observed phenotype in ATG7-deficient MCF10A cultures is a consequence of cumulative changes occurring because of a suppressed capacity for constitutive autophagy. Alternatively, it is conceivable that the observed phenotype reflects an ‘off target’ effect of the employed shRNA. A BLAST search revealed five non-ATG7 transcripts with perfect homology to 15–17 nucleotides of the targeting sequence of the ATG7 shRNA. Whether these transcripts are actually produced in MCF10A cells, let alone affected by the shRNA, is not known. However, none of these transcripts encoded a protein that would be anticipated to modify morphology.
Acknowledgments
The project extensively used the P30 ES06639-supported Imaging and Cytometry Facility Core located at Wayne State University.
Footnotes
Conflict of Interest: None
Publisher's Disclaimer: This is a PDF file of an unedited manuscript that has been accepted for publication. As a service to our customers we are providing this early version of the manuscript. The manuscript will undergo copyediting, typesetting, and review of the resulting proof before it is published in its final citable form. Please note that during the production process errors may be discovered which could affect the content, and all legal disclaimers that apply to the journal pertain.
References
- Abedin MJ, Wang D, McDonnell MA, Lehmann U, Kelekar A. Autophagy delays apoptotic death in breast cancer cells following DNA damage. Cell Death Different. 2007;14:500–510. doi: 10.1038/sj.cdd.4402039. [DOI] [PubMed] [Google Scholar]
- Amstad PA, Yu G, Johnson GL, Lee BW, Dhawan S, Phelps DJ. Detection of caspase activation in situ by fluorochrome-labeled caspase inhibitors. BioTechniques. 2001;31:608–616. doi: 10.2144/01313pf01. [DOI] [PubMed] [Google Scholar]
- Apel A, Herr I, Schwarz H, Rodemann HP, Mayer A. Blocked autophagy sensitizes resistant carconoma cells to radiation therapy. Cancer Res. 2008;68:1485–1493. doi: 10.1158/0008-5472.CAN-07-0562. [DOI] [PubMed] [Google Scholar]
- Banerjee A. Novel targets in drug design: enzymes in the protein ubiquitylation pathway Exp. Opin Drug Disc. 2006;1:151–160. doi: 10.1517/17460441.1.2.151. [DOI] [PubMed] [Google Scholar]
- Bedner E, Smolewski P, Amstad P, Darzynkiewicz Z. Activation of caspases measured in situ by binding of fluorochrome-labeled inhibitors of caspases (FLICA): Correlation with DNA fragmentation. Exp Cell Res. 2000;259:308–313. doi: 10.1006/excr.2000.4955. [DOI] [PubMed] [Google Scholar]
- Bernales S, Schuck S, Walter P. Autophagy counterbalances endoplasmic reticulum expansion during the unfolded protein response. PLOS Biol. 2006;4:2311–2324. doi: 10.1371/journal.pbio.0040423. [DOI] [PMC free article] [PubMed] [Google Scholar]
- Bernales S, Schuck S, Walter P. ER-phagy: selective autophagy of the endoplasmic reticulum. Autophagy. 2007;3:285–287. doi: 10.4161/auto.3930. [DOI] [PubMed] [Google Scholar]
- Boya P, Gonzalez-Polo RA, Casares N, Perfettini JL, Dessen P, Larochette N, Metivier D, Meley D, Souquere S, Yoshimori T, Pierron G, Codogno P, Kroemer G. Inhibition of macroautophagy triggers apoptosis. Mol Cell Biol. 2005;25:1025–1040. doi: 10.1128/MCB.25.3.1025-1040.2005. [DOI] [PMC free article] [PubMed] [Google Scholar]
- Bursch W. The autophagosomal-lysosomal component in programmed cell death. Cell Death Different. 2001;8:569–581. doi: 10.1038/sj.cdd.4400852. [DOI] [PubMed] [Google Scholar]
- Buytaert E, Callewaert G, Hendrickx N, Scorrano L, Hartmann D, Missiaen L, Vandenheede JR, Heirman I, Grooton J, Agostinis P. Role of endoplasmic reticulum depletion and multidomain proapoptotic BAX and BAL proteins in shaping cell death after hypericin-mediated photodynamic therapy. FASEB J. 2006;20:756–758. doi: 10.1096/fj.05-4305fje. [DOI] [PubMed] [Google Scholar]
- Chen Y, Poon RYC. The multiple checkpoint functions of CHK1 and CHK2 in maintenance of genome stability. Front Bioscience May. 2008;1:5016–5029. doi: 10.2741/3060. [DOI] [PubMed] [Google Scholar]
- Collins AR, Dobson VL, Dusinska M, Kennedy G, Stetina R. The comet assay: what can it really tell us? Mut Res. 1997;375:183–193. doi: 10.1016/s0027-5107(97)00013-4. [DOI] [PubMed] [Google Scholar]
- Cuervo AM. Autophagy: Many paths to the same end. Mol Cell Biochem. 2004;263:55–72. doi: 10.1023/B:MCBI.0000041848.57020.57. [DOI] [PubMed] [Google Scholar]
- Guo M, Joiakim A, Dudley DT, Reiners JJ., Jr Suppression of 2,3,7,8-tetrachlorodibenzo-p-dioxin (TCDD)-mediated CYP1A1 and CYP1B1 induction by 12-O-tetradecanoylphorbol-13-acetate: role of transforming growth factor β and mitogen-activated protein kinases. Biochem Pharmacol. 2001;62:1449–1457. doi: 10.1016/s0006-2952(01)00801-2. [DOI] [PubMed] [Google Scholar]
- Gutierrez MG, Saka HA, Chinen I, Zoppino FC, Yoshimori T, Bocco JL, Colombo MI. Protective role of autophagy against Vibrio cholerae cytolysin, a pore-forming toxin from V. cholerae. Proc Natl Acad Sci USA. 2007;104:1829–1834. doi: 10.1073/pnas.0601437104. [DOI] [PMC free article] [PubMed] [Google Scholar]
- Joiakim A, Mathieu PA, Elliott AA, Reiners JJ., Jr Superinduction of CYP1A1 in MCF10A cultures by cycloheximide, anisomycin and puromycin: A process independent of effects on protein translation and unrelated to suppression of aryl hydrocarbon receptor proteolysis by the proteasome. Mol Pharmacol. 2004;66:936–947. doi: 10.1124/mol.66.4.. [DOI] [PubMed] [Google Scholar]
- Kabeya Y, Mizushima N, Ueno T, Yamamoto A, Kirisako T, Noda T, Kominami E, Ohsumi Y, Yoshimori T. LC3, a mammalian homologue of yeast Atg8p, is localized in autophagosome membranes after processing. EMBO J. 2000;19:5720–5728. doi: 10.1093/emboj/19.21.5720. [DOI] [PMC free article] [PubMed] [Google Scholar]
- Kabeya Y, Mizushima N, Yamamoto A, Oshitani-Okamoto S, Ohsumi Y, Yoshimori T. LC3, GABARAP and GATE16 localize to autophagosomal membrane depending on form-II formation. J Cell Sci. 2004;117:2805–2812. doi: 10.1242/jcs.01131. [DOI] [PubMed] [Google Scholar]
- Kadowaki M, Razaul Karim M, Carpi A, Miotto G. Nutrient control of macroautophagy in mammalian cells. Mol Aspects Med. 2006;27:426–443. doi: 10.1016/j.mam.2006.08.010. [DOI] [PubMed] [Google Scholar]
- Kanzawa T, Kondo Y, Ito H, Kondo S, Germano I. Induction of autophagic cell death in malignant glioma cells by arsenic trioxide. Cancer Res. 2003;63:2103–2108. [PubMed] [Google Scholar]
- Katayama M, Kawaguchi T, Berger MS, Pieper RO. DNA damaging agent-induced autophagy produces a cytoprotective adenosine triphosphate surge in malignant glioma cells. Cell Death Different. 2007;14:548–558. doi: 10.1038/sj.cdd.4402030. [DOI] [PubMed] [Google Scholar]
- Kaufmann WK. Initiating the uninitiated: replication of damaged DNA and carcinogenesis. Cell Cycle. 2007;6:1460–1467. [PubMed] [Google Scholar]
- Kessel D, Reiners JJ., Jr Apoptosis and autophagy after mitochondrial photodamage. Photochem Photobiol. 2006;83:1024–1028. doi: 10.1111/j.1751-1097.2007.00088.x. [DOI] [PMC free article] [PubMed] [Google Scholar]
- Kessel D, Reiners JJ., Jr Initiation of apoptosis and autophagy by the Bcl-2 antagonist HA14-1. Cancer Lett. 2007a;249:294–299. doi: 10.1016/j.canlet.2006.09.009. [DOI] [PMC free article] [PubMed] [Google Scholar]
- Kessel D, Reiners JJ., Jr Apoptosis and autophagy after mitochondrial or endoplasmic reticulum photodamage. Photchem Photobiol. 2007b;83:1–5. doi: 10.1111/j.1751-1097.2007.00088.x. [DOI] [PMC free article] [PubMed] [Google Scholar]
- Kessel D, Reiners JJ, Jr, Hazeldine ST, Polin L, Horwitz JP. The role of autophagy in the death of L1210 leukemia cells initiated by the new antitumor agents, XK469 and SH80. Mol Cancer Ther. 2007;6:370–379. doi: 10.1158/1535-7163.MCT-05-0386. [DOI] [PMC free article] [PubMed] [Google Scholar]
- Kessel D, Vicente GH, Reiners JJ., Jr Initiation of apoptosis and autophagy by photodynamic therapy. Lasers Surg Med. 2006;38:482–488. doi: 10.1002/lsm.20334. [DOI] [PMC free article] [PubMed] [Google Scholar]
- Khanna SK, Singh GB, Dixit AK. Use of synthetic dyes in eatables of rural area. J Food Sci Technol. 1985;22:269–273. [Google Scholar]
- Kim I, Rodriguez-Enriquez S, Lemasters JJ. Selective degradation of mitochondria by mitophagy. Arch Bioch Biophy. 2007;462:245–253. doi: 10.1016/j.abb.2007.03.034. [DOI] [PMC free article] [PubMed] [Google Scholar]
- Klionsky DJ, Emr SD. Autophagy as a regulated pathway of cellular degradation. Science. 2000;290:1717–1721. doi: 10.1126/science.290.5497.1717. [DOI] [PMC free article] [PubMed] [Google Scholar]
- Komatsu M, Waguri S, Ueno T, Iwata J, Murata S, Tanida I, Ezaki J, Mizushima N, Ohsumi Y, Uchiyama Y, Kominami E, Tanaka K, Chiba T. Impairment of starvation-induced and constitutive autophagy in Atg7-deficient mice. J Cell Biol. 2005;169:425–434. doi: 10.1083/jcb.200412022. [DOI] [PMC free article] [PubMed] [Google Scholar]
- Kroemer G, El-Deiry WS, Golstein P, Peter ME, Vaux D, Vandenabeele P, Zhivotovsky B, Blagosklonny MV, Malorni W, Knight RA, Piacentini M, Nagata S, Melino G. Classification of cell death: Recommendations of the nomenclature committee on cell death. Cell Death Differ. 2005;12(Supl 2):1463–1467. doi: 10.1038/sj.cdd.4401724. [DOI] [PubMed] [Google Scholar]
- Lemasters JJ. Selective mitochondrial autophagy, or mitophagy, as a targeted defense against oxidative stress, mitochondrial dysfunction, and aging. Rejuvenation Res. 2005;8:3–5. doi: 10.1089/rej.2005.8.3. [DOI] [PubMed] [Google Scholar]
- Lum JJ, Bauer DE, Kong M, Harris MH, Li C, Lindsten T, Thompson CB. Growth factor regulation of autophagy and cell survival in the absence of apoptosis. Cell. 2005;120:237–248. doi: 10.1016/j.cell.2004.11.046. [DOI] [PubMed] [Google Scholar]
- Majeski AE, Dice JF. Mechanisms of chaperone-mediated autophagy. Internat J Biochem Cell Biol. 2004;36:2435–2444. doi: 10.1016/j.biocel.2004.02.013. [DOI] [PubMed] [Google Scholar]
- Mailand N, Falck J, Lukas C, Syljuasen RG, Welcker M, Bartek J, Lukas J. Rapid destruction of human Cdc25A in response to DNA damage. Science. 2000;288:1425–1429. doi: 10.1126/science.288.5470.1425. [DOI] [PubMed] [Google Scholar]
- Mittal A, Gupta VK, Malviya A, Mittal J. Process development for the batch and bulk removal and recovery of a hazardous, water-soluble azo dye (Metanil Yellow) by adsorption over waste materials (Bottom Ash and De-oiled Soya) J Hazard Mater. 2007 doi: 10.1016/j.jhazmat.2007.06.059. in press. [DOI] [PubMed] [Google Scholar]
- Mizushima N. Methods for monitoring autophagy. Int J Biochem Cell Biol. 2004;36:2491–2502. doi: 10.1016/j.biocel.2004.02.005. [DOI] [PubMed] [Google Scholar]
- Mizushima N, Ohsumi Y, Yoshimori T. Autophagosome formation in mammalian cells. Cell Struct Funct. 2002;27:421–429. doi: 10.1247/csf.27.421. [DOI] [PubMed] [Google Scholar]
- Mizushima N, Yoshimori T. How to interpret LC3 immunoblotting. Autophagy. 2007;3:542–545. doi: 10.4161/auto.4600. [DOI] [PubMed] [Google Scholar]
- Mizushima N, Yamamoto A, Hatano M, Kobayashi Y, Kabeya Y, Suzuki K, Tokuhisa T, Ohsumi Y, Yoshimori T. Dissection of autophagosome formation using Apg5-deficient mouse embryonic stem cells. J Cell Biol. 2001;152:657–668. doi: 10.1083/jcb.152.4.657. [DOI] [PMC free article] [PubMed] [Google Scholar]
- Ogata M, Hino S, Saito A, Morikawa K, Kondo S, Kanemoto S, Murakami T, Taniguchi M, Tanii I, Yoshinaga K, Shiosaka S, Hammarback JA, Urano F, Imaizumi K. Autophagy is activated for cell survival after endoplasmic reticulum stress. Mol Cell Biol. 2006;26:9220–9231. doi: 10.1128/MCB.01453-06. [DOI] [PMC free article] [PubMed] [Google Scholar]
- Olive PL, Durand RE, Banath JP, Johnston PJ. Analysis of DNA damage in individual cells. Meth Cell Biol. 2001;64:235–249. doi: 10.1016/s0091-679x(01)64016-0. [DOI] [PubMed] [Google Scholar]
- Onodera J, Ohsumi Y. Autophagy is required for maintenance of amino acid levels and protein synthesis under nitrogen starvation. J Biol Chem. 2005;280:31582–31586. doi: 10.1074/jbc.M506736200. [DOI] [PubMed] [Google Scholar]
- Park KJ, Lee SH, Kim T-I, Lee H-W, Lee C-H, Kim E-H, Jang J-Y, Choi KS, Kwon M-H, Kim YS. The human scFv antibody against TRAIL receptor 2 induces autophagic cell death in both TRAIL-sensitive and TRAIL-resistant cancer cells. Cancer Res. 2007;67:7327–7334. doi: 10.1158/0008-5472.CAN-06-4766. [DOI] [PubMed] [Google Scholar]
- Qin J, Li L. Molecular anatomy of the DNA damage and replication checkpoints. Rad Res. 2003;159:139–148. doi: 10.1667/0033-7587(2003)159[0139:maotdd]2.0.co;2. [DOI] [PubMed] [Google Scholar]
- Raza H, Khanna SK, Singh GB, Krishnamurti CR. Interaction of p-aminodiphenylamine with rat gut mucosal epithelium. Ind J Exp Biol. 1982;22:773–775. [PubMed] [Google Scholar]
- Reiners JJ, Jr, Clift R, Mathieu P. Suppression of cell cycle progression by flavonoids: Dependence on the aryl hydrocarbon receptor. Carcinogenesis. 1999;2:1561–1566. doi: 10.1093/carcin/20.8.1561. [DOI] [PubMed] [Google Scholar]
- Sancar A, Lindsey-Boltz LA, Unsal-Kacmaz K, Linn S. Molecular mechanisms of mammalian DNA repair and the DNA damage checkpoints. Annu Rev Biochem. 2004;73:39–85. doi: 10.1146/annurev.biochem.73.011303.073723. [DOI] [PubMed] [Google Scholar]
- Scientific Committee on Consumer Products (SCCP), 19 December 2006, Opinion on N-Phenyl-p-phenylenediamine COLIPA N° A9.
- Shimizu S, Kanaseki T, Mizushima N, Mizuta T, Arakwa-Kobayashi S, Thompson CB, Tsujimoto Y. Role of Bcl-2 family proteins in a non-apoptotic programmed cell death dependent on autophagy genes. Nat Cell Biol. 2004;6:1221–1228. doi: 10.1038/ncb1192. [DOI] [PubMed] [Google Scholar]
- Singh RL, Khanna SK, Shanker R, Singh GB. Acute and short-term toxicity studies on p-aminodiphenylamine. Vet Hum Toxicol. 1986;28:219–223. [PubMed] [Google Scholar]
- Srivastava LP, Khanna SK, Singh GB, Krishnamurti CR. In vitro studies on the biotransformaion of metanil yellow. Environ Res. 1982;27:185–189. doi: 10.1016/0013-9351(82)90069-x. [DOI] [PubMed] [Google Scholar]
- Starcevic SL, Diotte NM, Zukowski KL, Cameron MJ, Novak RF. Oxidative DNA damage and repair in a cell lineage model of human proliferative breast disease (PBD) Toxicol Sci. 2003;75:74–81. doi: 10.1093/toxsci/kfg154. [DOI] [PubMed] [Google Scholar]
- Tanida I, Minematsu-Ikeguchi N, Ueno T, Kominami E. Lysosomal turnover, but not a cellular level, of endogenous LC3 is a marker for autophagy. Autophagy. 2005;1:84–91. doi: 10.4161/auto.1.2.1697. [DOI] [PubMed] [Google Scholar]
- Wang JL, Liu D, Zhang ZJ, Shan S, Han X, Srinivasula SM, Croce CM. Structure-based discovery of a organic compound that binds Bcl-2 protein and induces apoptosis of tumor cells. Proc Natl Acad Sci USA. 2000;97:7124–7129. doi: 10.1073/pnas.97.13.7124. [DOI] [PMC free article] [PubMed] [Google Scholar]
- Yao B, Fu J, Hu E, Oi Y, Zhou Z. The Cdc25A is involved in S-phase checkpoint induced by benzo(a)pyrene. Toxicology. 2007;237:210–217. doi: 10.1016/j.tox.2007.05.015. [DOI] [PubMed] [Google Scholar]
- Yorimitsu T, Klionsky DJ. Autophagy: molecular machinery for self-eating. Cell Death Different. 2005;12:1542–1552. doi: 10.1038/sj.cdd.4401765. [DOI] [PMC free article] [PubMed] [Google Scholar]


