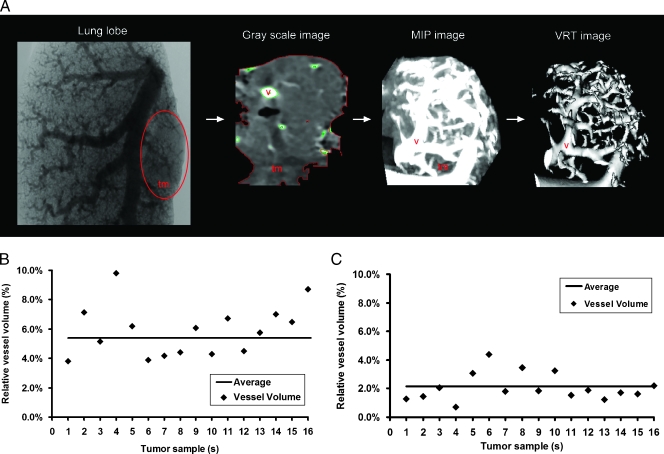
Figure 2.
Quantitative volumetric measurements of extracted tumors and tumor angiogenesis after in vivo or ex vivo vessel filling. (A) A section of a Microfil-injected lung lobe: grayscale image of an extracted tumor from a Microfil-injected lung, MIP image showing a lung tumor, and a VRT image illustrating the tumor vasculature in a sequential order. Quantitative scatter graphs showing the percentage of filled vessels in tumors after in vivo (B) or ex vivo (C) Microfil application. tm indicates tumor mass; v, vessels (n = 16 tumors were taken for this analysis from 12 mice).

