Abstract
To understand how boreal forest carbon (C) dynamics might respond to anticipated climatic changes, we must consider two important processes. First, projected climatic changes are expected to increase the frequency of fire and other natural disturbances that would change the forest age-class structure and reduce forest C stocks at the landscape level. Second, global change may result in increased net primary production (NPP). Could higher NPP offset anticipated C losses resulting from increased disturbances? We used the Carbon Budget Model of the Canadian Forest Sector to simulate rate changes in disturbance, growth and decomposition on a hypothetical boreal forest landscape and to explore the impacts of these changes on landscape-level forest C budgets. We found that significant increases in net ecosystem production (NEP) would be required to balance C losses from increased natural disturbance rates. Moreover, increases in NEP would have to be sustained over several decades and be widespread across the landscape. Increased NEP can only be realized when NPP is enhanced relative to heterotrophic respiration. This study indicates that boreal forest C stocks may decline as a result of climate change because it would be difficult for enhanced growth to offset C losses resulting from anticipated increases in disturbances.
Keywords: Canada, fire, CBM-CFS3, global change
1. Introduction
A significant but declining portion of anthropogenic carbon dioxide (CO2) emissions is sequestered by the world's oceans and terrestrial ecosystems (Canadell et al. 2007a; Denman et al. 2007). Without these land and ocean sinks, atmospheric greenhouse gas (GHG) concentrations would grow much faster than presently observed. Mid- and high-latitude ecosystems in the Northern Hemisphere appear to be responsible for the largest portion of the net terrestrial carbon (C) sink (Myneni et al. 2001; Goodale et al. 2002; Dargaville et al. 2006). High-latitude ecosystems are, however, also likely to be among the most affected by projected climatic changes. This could result in a reduction in their contribution to the sink or contribute to potentially serious climate feedbacks if these systems were to become net sources. The average global terrestrial uptake was 1.0±0.6 Gt C yr−1 in the 1990s and 0.9±0.6 Gt C yr−1 during 2000 to 2005 (Denman et al. 2007), and some models predict that this sink could become a source by the middle of the twenty-first century (Cox et al. 2000). If the sink currently contributed by high-latitude terrestrial ecosystems reverts to a source, the rate of increases in future atmospheric GHG concentrations will increase, even if anthropogenic GHG emissions were reduced.
Global change has the potential to have both negative and positive consequences for net biome production (NBP) of the world's high-latitude terrestrial ecosystems. It remains unclear, however, whether the combined (net) effect of all factors will push these ecosystems towards sink or source. The circumpolar boreal forest is one of the most important high-latitude ecosystems, covering an area of 13.7 Mkm2 and containing a large fraction of the planet's terrestrial C (471 Gt C in soils and 88 Gt C in vegetation, or 23 and 19% of the estimated global totals, respectively; IPCC 2000). Significant changes in both forest productivity and forest disturbance regimes are being projected for boreal forest ecosystems (Flannigan et al. 2005a,b; Euskirchen et al. 2006).
An increase in severe summer fire weather conditions is projected for most of the North American boreal biome, and this is expected to lead to a sharp increase in the area burned by wildfire (Flannigan et al. 2005a). Flannigan et al. (2005b) project that, under a 3×CO2 scenario, the area annually burned could increase by 74–118% by the end of the current century. Earlier projections based on a more modest 2×CO2 scenario also suggested large increases in area burned annually (Flannigan & van Wagner 1991; Price & Rind 1994). Large increases in the area burned by wildfire will increase direct GHG emissions, but will also increase residual emissions from the decomposition of dead organic matter, including the biomass killed by fire. Increases in the area annually burned would also have a strong impact on future forest succession (de Groot et al. 2003) and age-class distributions (Kurz et al. 1998; Kurz & Apps 1999), thereby influencing the capacity of the forest landscape to sequester and store C (Thornley & Cannell 2004). Already in the latter half of the twentieth century, the area burned annually by wildfire in Canada has increased (Stocks et al. 2002), with consequent negative implications for C dynamics (Kurz & Apps 1999; Kang et al. 2006).
In addition to increased fire disturbance rates, changes in insect disturbance regimes are also anticipated, including range expansions and intensification of outbreaks (Kurz et al. 1995; Logan et al. 2003; Carroll et al. 2004). Recent observations suggest that such changes are already taking place (e.g. Berg et al. 2006; Carroll et al. 2006). Changes in disturbance regimes will have important implications for future boreal forest C dynamics (Kurz & Apps 1995; Kurz et al. 1995).
On the positive side, several global change-related processes could lead to significantly enhanced forest productivity. Chief among these are: (i) elevated atmospheric CO2 concentrations, (ii) increased atmospheric N deposition, and (iii) longer growing seasons. The combined effect of these processes on the longer-term net C balance remains a topic of scientific discussion (Angert et al. 2005; de Vries et al. 2006; Euskirchen et al. 2006), but remote sensing data suggest that these factors could be driving substantial increases in photosynthetic activity (Myneni et al. 1997; Slayback et al. 2003). Estimates suggest that net primary production (NPP) has increased by 6% globally during the 1980s and 1990s (Nemani et al. 2003), and atmospheric inversion studies suggest that C storage in the boreal forest has been increasing since the early 1980s (Dargaville et al. 2006). On the other hand, there is also evidence of a decline in NPP for boreal regions since 2000 (Bunn et al. 2007). Even if there is increased NPP as a result of global change in boreal forest regions, this will not necessarily result in a C sink, even in the absence of disturbance. Longer growing seasons and other projected climatic changes will also increase dead organic matter decomposition rates, and the ultimate outcome for net ecosystem production (NEP) may not always be positive (Euskirchen et al. 2006; Thompson et al. 2006; Canadell et al. 2007b). Even so, Chen et al. (2006) did find that boreal ecosystems can sequester more C during warmer years.
If NEP were enhanced on average across the boreal forest biome, what magnitude of enhancement would be required to offset C losses associated with increased disturbance rates? In this paper, we report the results of a series of numerical simulation modelling experiments aimed at defining, for a hypothetical boreal forest landscape, the response surface of net C stock changes as affected by changes in productivity and disturbance rates. We specifically seek to identify the break-even domain in which the total amount of C stored remains unaffected because changes in disturbance rates are balanced by changes in productivity.
2. Material and methods
Numerical simulation modelling experiments were conducted for this study using the Carbon Budget Model of the Canadian Forest Sector (CBM-CFS3; Kurz et al. 1992; Kurz & Apps 1999; Kull et al. 2006). The CBM-CFS3 is a stand- and landscape-level forest C dynamics computer simulation model. Rates of tree growth are defined in the model by yield curves that describe the rates of merchantable wood volume accumulation over time, referenced to stand age. Merchantable wood volume increments are converted into above- and below-ground biomass C increments inside the CBM-CFS3 using a system of stand-level volume-to-biomass conversion models developed for Canadian forest ecosystems (Boudewyn et al. 2007), and by assuming a C content of 0.5 t C t−1 biomass. Merchantable volumes are used as starting points for biomass C dynamics simulation in the CBM-CFS3 because a vast body of information on merchantable wood growth has been compiled by forest industry and forest management agencies across Canada, whereas information on total volume or biomass is limited.
NPP is calculated in the CBM-CFS3 as the sum of annual net biomass increment plus the annual production of detritus, including foliage and fine root turnover, and any other biomass components that are added to dead organic matter. In the CBM-CFS3, estimates of NPP do not include non-tree (i.e. shrub, herbaceous or bryophyte) production. NEP is calculated as NPP minus all losses from heterotrophic respiration (Rh; i.e. all decomposition losses). Finally, net biome production (NBP) is calculated as NEP minus all losses from disturbances and forest management activities. NBP is the net C flux between the forest landscape and the atmosphere, accounting for all stand and landscape processes. There is no need to make assumptions about the fate of harvested biomass C because we do not simulate harvest in this experiment.
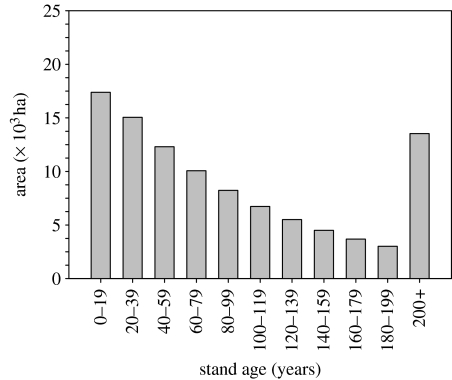
A forest inventory was constructed for a 100 000 ha hypothetical boreal forest landscape consisting entirely of even-aged stands. Biomass dynamics for all stands in this hypothetical landscape were characterized by a single yield curve. The starting landscape-level age-class structure for all scenario analyses was a negative exponential age-class distribution (figure 1) generated by simulating a constant 100-year fire return interval (i.e. 1% of the area is burned per year with random selection of areas to burn; van Wagner 1978). The model initialization procedure used to produce this initial age-class distribution was also used to produce the initial dead organic matter and soil C stocks. In this initialization procedure, the constant 100-year fire return interval disturbance regime was simulated over centuries to obtain a landscape in steady-state conditions. At the end of the model initialization phase, the age-class structure was stable (i.e. unchanging), as were the C stocks in biomass, dead organic matter and the soil. In this condition, annual growth and C uptake in the landscape was balanced by the annual direct emissions from fires and the C release from decomposition (Kurz et al. 1998).
Figure 1.
Initial age-class distribution of the 100 000 ha hypothetical boreal forest landscape for all scenario analyses.
To quantify the response surface of changes in C stocks in response to changes in fire regime, growth rates and decomposition rates, we constructed two sets of 81 scenarios. Each set of 81 scenarios was generated by combining one out of nine growth rate assumptions with one out of nine disturbance rate assumptions. The nine growth rate assumptions included the base growth rate plus eight assumptions of changed growth rates ranging from −20% to +20% in 5% increments. Similarly, disturbance rates ranged from −20% to +20% of the base assumption, in 5% increments. In the first set of 81 scenarios, we held decomposition rates at their base levels and, in the second set, we increased decomposition rates by the same amount as the growth rates (proportionally) and maintained these changed decomposition rates throughout the model simulations. For the second set of 81 scenarios, we simulated only key points on the surface (corners and central axes) and interpolated the results of the remaining scenarios.
The 81 scenarios were not designed to represent changes in growth and disturbance rates brought about by global change per se, but to allow us to construct a response surface in order to evaluate how C dynamics in our hypothetical boreal landscape respond to different combinations of changes in growth and disturbance rates. This response surface can then help us quantify which combinations of changes in growth and disturbance rates will push the system towards net C sink or source.
(a) Growth rate scenarios
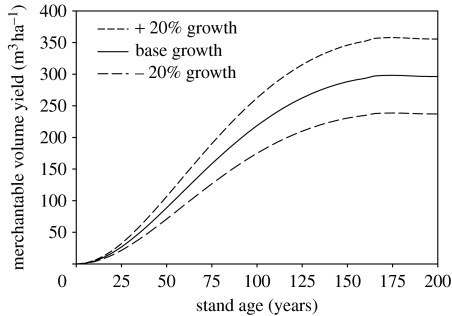
The CBM-CFS3 uses empirical yield curves rather than process simulation. Thus, it cannot be used to predict climate change impacts on forest growth through simulation of ecosystem processes. Growth rates can be modified, however, and applied in scenario analyses to explore the impacts on forest C dynamics. In this study, the base yield curve used to drive biomass C dynamics for all stands in our hypothetical landscape was scaled upwards or downwards to simulate changes in productivity (figure 2). The base yield curve describes the growth of typical, fully stocked Picea glauca (white spruce) stands growing on high-quality western Canadian boreal sites. Although this type of stand is more productive than Picea mariana (black spruce) ecosystems that are characteristic of higher latitude or more eastern North American boreal forests, it is representative of the productive regions of Canada's western boreal that is also subject to frequent fire disturbances. We simulated nine different growth scenarios, ranging from +20% growth to −20% growth. All scenarios started from the same initial condition, which was developed using the base growth curve. The change to the new yield curves occurred as a step function at the start of the scenario simulations. In each scenario, the entire landscape was simulated for 200 years using the new yield curve.
Figure 2.
Yield curves used to define biomass C dynamics in the scenario analyses.
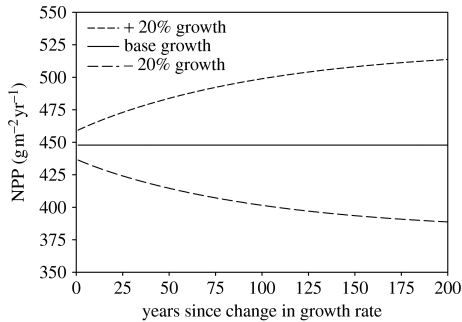
Although our growth scenarios implement the shift from base to new growth rates as a step function, it is important to note that the NPP increase across the entire landscape is more gradual. Figure 3 shows that changes in growth rates initially resulted in relatively small changes in NPP, and that NPP increased over time. In the +20% growth scenario, NPP increased by 8% after 50 years at the new growth rate, but by 200 years NPP had been elevated by 15% relative to base NPP. There are two reasons for this delayed response of NPP. First, NPP is calculated in the CBM-CFS3 as the sum of annual net biomass increments plus the annual production of detritus. Above-ground litterfall and biomass turnover are parametrized as fixed proportions per annum for each biomass C pool, so detritus production only increases as biomass C stocks increase, which takes time. Second, in our hypothetical landscape, some stands have matured to the point where the growth curve indicates zero net growth and do not exhibit any change in productivity as a result of the change in growth scenario. Following stand-replacing disturbance, the stands will resume growth at the rates defined for each scenario.
Figure 3.
NPP response to an immediate change in merchantable volume yield in the 100 000 ha hypothetical boreal forest landscape shows a time lag. Average NPP over the landscape is still in the process of responding to the merchantable volume yield change, even after 200 years.
Detrital production is parametrized in the CBM-CFS3 as fixed annual turnover proportions for each biomass pool (Kurz & Apps 1999). Under different growth scenarios, detrital production therefore increases or decreases in proportion to changes in biomass stocks. This is a simplistic representation of detrital production and does not take into account any changes in litterfall rates or stem mortality rates that might accompany changes in growth rates brought about by global change factors.
(b) Decomposition rate scenarios
Decomposition rates were adjusted only in the second set of scenarios. These rates were modified by adjusting the decay rate parameters for each of the dead organic matter and soil organic C pools in the CBM-CFS3. Dead organic matter C and soil organic C are represented in the CBM-CFS3 by pools with different turnover rates and receiving input from different biomass C pools (Kurz et al. 1992; Kurz & Apps 1999; Kull et al. 2006). Decomposition rate scenarios were simulated in the same manner as growth rate scenarios. In any scenario, the same multipliers were applied to both growth and decomposition rates, i.e. a 5% increase in growth rates was accompanied by a 5% increase in decomposition rates. Decomposition rates were adjusted as a step function after model initialization but prior to the start of the scenario simulations.
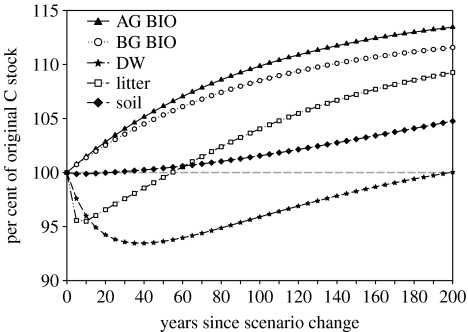
The impact on Rh of changing decomposition rate parameters in the CBM-CFS3 is highly time dependent. Labile pools in the model respond quickly to decomposition rate parameter changes while more stable pools respond more slowly and over longer time periods. For example, figure 4 shows C stock responses in the scenario of +20% increases in growth and decomposition rates. Litter C stocks are drawn down very quickly following the increase in decomposition rates, with dead wood and soil organic C responding more slowly. The stocks then gradually begin to recover as increased growth rates lead to larger biomass C stocks over time and consequently higher annual detritus production.
Figure 4.
Carbon stock changes over time following change from base growth and decomposition rates to +20% growth and decomposition rates. Litter and dead wood (DW) quickly lose C following a 20% increase in decomposition rates, but gradually recover C as above-ground biomass (AG BIO) and below-ground biomass (BG BIO) C stocks become elevated by the accompanying 20% increase in growth rates, resulting in an increase in detritus production. Soil organic C stocks respond more slowly to the changes in growth and decomposition rates.
(c) Disturbance rate scenarios
The base disturbance scenario was set up to disturb 1% yr−1 of the landscape area with wildfire, burning stands randomly selected from the landscape. This is equivalent to a 100-year fire return interval, common for many regions in the Canadian boreal forest (Stocks et al. 2002). This base disturbance rate was used during model initialization for all scenarios. The base disturbance rate was modified upwards or downwards to simulate changes in disturbance regimes brought about by climate change. For example, in the +20% disturbance scenario, we targeted 1.2% of the landscape for wildfire each year. We did not change disturbance intensity or stand selection algorithms in any of our disturbance scenarios. During both model initialization and scenario runs, we assumed immediate regeneration to the appropriate growth curve.
3. Results
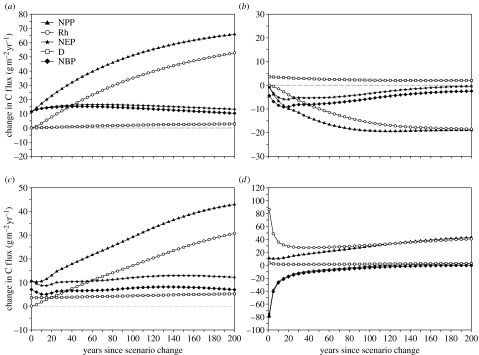
Simulated ecosystem responses at the landscape scale to changes in growth, disturbance and decomposition rates for our hypothetical landscape are shown in figure 5. Figure 5a–d shows clear temporal trends, indicating that even single, stepwise changes in growth, decomposition and/or disturbance rates produce ecosystem responses with strong temporal dynamics. In all cases, the landscape takes centuries to approach equilibrium under new conditions. In this paper, we focus our attention on the 50-year responses of our hypothetical landscape to changes in growth, decomposition and/or disturbance rates. The analysis of longer-term responses would be clouded by increased uncertainty about the longer-term impacts of global change on boreal ecosystems and the potential for unpredictable outcomes due to successional changes or ecological thresholds (Steffen et al. 2004) not accounted for in our model simulations.
Figure 5.
Landscape C flux responses to changes in: (a) +20% growth rates, (b) +20% disturbance rates, (c) +20% growth and disturbance rates and (d) +20% growth, decomposition and disturbance rates for a 100 000 ha hypothetical boreal forest landscape, showing a change in NPP, Rh, NEP, direct disturbance losses (D) and NBP relative to before scenario change.
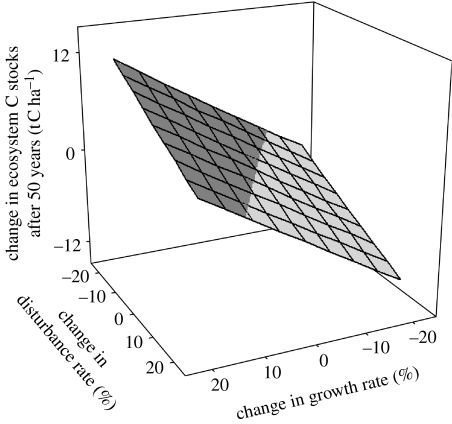
The first set of 81 scenarios explores ecosystem C stocks change in response to various combinations of changes in both growth and disturbance rates, with decomposition rates held at base levels. Cumulative changes in total ecosystem C stocks after 50 years with new growth and/or disturbance rates show the sensitivity of C stocks to changes in scenario assumptions (figure 6). A 20% increase in growth rates, with no change in decomposition rates, would be sufficient to offset the C losses associated with a 20% increase in disturbance rates (front left-hand corner of the response surface). The break-even line on the surface (shown as the line between light and dark grey) indicates the combinations of changes in disturbance and growth rates that result in no changes in total ecosystem C after 50 years. Recall that we have simulated changes in growth rates by modifying merchantable volume yields, and that the impacts of these modifications on NPP involve a considerable time delay, such that a 20% change in growth rates does not equate to a 20% change in NPP after 50 years (figure 5).
Figure 6.
Response surface showing a change in ecosystem C stocks after 50 years in scenarios with growth/disturbance rate changes and decomposition rates at base levels. Each intersection of lines on the surface represents the outcome of 1 out of the 81 scenarios that were simulated. The dark grey portion of the surface has a positive change in ecosystem C stocks after 50 years (C sink). At the centre of the surface is the base scenario, which is C neutral (i.e. no change in C stocks). The front left-hand corner of the surface shows the outcome of the +20% growth with +20% disturbances scenario to be positive (C sink) after 50 years. The best possible outcome (greatest C sink) is realized with the +20% growth with −20% disturbances scenario.
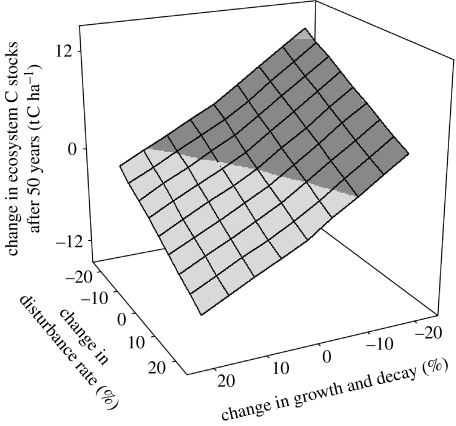
Figure 7 shows the change in total ecosystem C stocks for our hypothetical landscape after 50 years for the second set of scenarios, where decomposition rates were adjusted in proportion to growth rates. This surface shows that an increase in growth and decomposition rates, combined with increased disturbance rates, results in C loss from the ecosystem. In fact, the biggest C stock reduction was observed in the scenario with the highest increases in growth and decomposition rates. This observation is partly a function of the point in time since change that we have chosen to analyse (i.e. 50 years after change, rather than 100 or 200 years after change; figure 5). Nevertheless, these modelling experiments suggest that an ecosystem in which growth rates increased as a result of global change can only be expected to act as a C sink if decomposition rates are unaffected or increase far less than growth rates.
Figure 7.
Response surface showing a change in ecosystem C stocks after 50 years in new growth/disturbance rate scenarios, with decomposition rates adjusted in concert with growth rates. At the centre of the surface is the base scenario, which is C neutral. The bottom corner of the surface shows the outcome of the +20% growth and decomposition with +20% disturbances scenario to be negative (C source) after 50 years. In contrast to figure 6, the best possible outcome (greatest C sink) is now realized with the −20% growth and decomposition with −20% disturbances scenario.
4. Discussion
The results of the first set of 81 scenarios suggest that enhanced C sequestration brought about by a positive change in growth rates could compensate for the C losses resulting from an increase in disturbance rates of proportionally equal magnitude. For example, where only growth is adjusted (no corresponding change in decomposition rates), a 12% increase in growth rates would suffice to offset the C losses associated with a 20% increase in disturbance rates over 50 years. The results of the second set of scenarios suggest, however, that this compensation does not take place if decomposition rates increase in proportion to growth rate increases.
The scenario results are time sensitive, in particular for the second set of scenarios. The reason that the 50-year outcome differs from the longer-term outcomes in the second set of scenarios is that dead organic matter and soil C changes exhibit considerable time delays, even though we simulated sustained changes in decomposition rates. Rh is initially much higher in elevated decomposition rate scenarios, but stabilizes at levels more modestly elevated relative to base levels once the most dynamic dead organic matter C pools have reached their new levels (as illustrated in figures 4 and 5d).
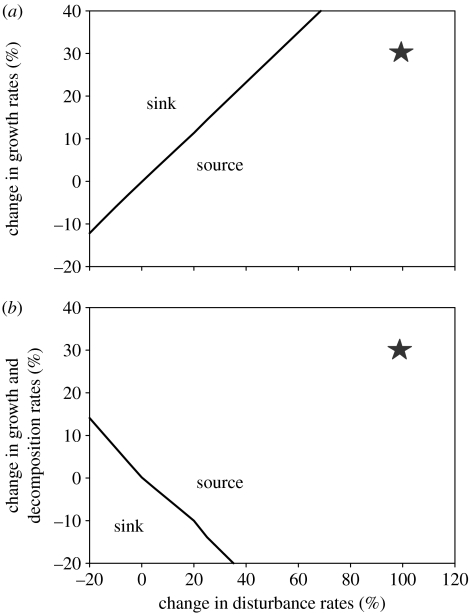
Figure 8a,b shows the break-even domains for the two sets of scenarios. In figure 8a, the area above the break-even line represents C sinks and the area below the break-even line represents C sources. This configuration is reversed in figure 8b. These break-even lines can be thought of as ‘slices’ through the response surfaces shown in figures 6 and 7, respectively. The opposite configuration of the sink and source regions relative to the break-even lines in figure 8a,b is a reflection of the different orientations of the response surfaces shown in figures 6 and 7. In the first set of scenarios, where decomposition rates remained unchanged, increased growth rates tended to push the ecosystem towards C sink. In the second set of scenarios, where growth and decomposition rates were changed together, increased growth and decomposition rates tended to push the ecosystem towards C source because the impacts on Rh were greater than the impacts on NPP in the first 50 years.
Figure 8.
Break-even domains extrapolated from the two sets of scenarios. The diagonal lines represent: (a) the change in growth or (b) growth and decomposition rates that are required to compensate for the C losses associated with the change in disturbance rates, such that the forest landscape is C neutral after 50 years under the new conditions. The star symbols show one estimate of where global change impacts may fall in these parameter spaces.
Global change is projected to have greater impacts on disturbances and growth rates than we have simulated in any of our scenarios. For example, Chen et al. (2000) suggest that an increase in NPP of the order of 30% could be anticipated in Canada's boreal forests, while Flannigan et al. (2005b) project a doubling in the area burned annually by wildfire in Canada. Even if a 30% increase in NPP were to translate into a 30% increase in NEP, the star symbols in figure 8a,b indicate that this would not be sufficient to offset the anticipated increases in fire disturbance rates. The response surfaces from the simulation experiments indicate that our hypothetical boreal landscape would be a net C source (figure 8). The source is smaller when decomposition rates are held constant (figure 8a) and is larger when decomposition rates are adjusted with growth rates (figure 8b). Moreover, a doubling of fire disturbance rates may bring about other complex changes that are not addressed here. For example, regeneration failures following fires in young stands with inadequate seed sources and other changes in successional dynamics would also have to be considered.
As described earlier, a +30% growth scenario simulated in the CBM-CFS3 would not equate to a 30% enhancement of NPP at the landscape scale. All stands in our hypothetical landscape are grown using the growth curve shown in figure 2, and changes in growth rates are simulated by scaling the curve upwards or downwards. The CBM-CFS3 uses growth increments derived from the growth curve to drive biomass C dynamics. Thus, in all of the growth scenarios simulated here, stands older than 175 years (17% of the area in the landscape at the start of the simulations) experience no impact from growth rate changes and no change in NPP. A net growth increment of zero increased by 20% is still a net growth increment of zero. Mature stands with no positive net growth still have high NPP in the CBM-CFS3 because the model simulates enough gross growth to balance biomass turnover in order to maintain zero net growth, when this is prescribed by the growth curve. However, a change in growth rates will have no impact on NPP of these stands until they are disturbed. In our experiments, old stands will be able to accumulate more C if they were established during enhanced growth scenarios. When an enhanced growth scenario is applied, only actively growing stands (positive net growth) experience growth enhancement in the model simulations, and only that portion of the landscape has enhanced NPP. This is consistent with the findings indicating that older stands do not necessarily exhibit enhanced C accumulation as a result of non-disturbance global change factors (Goulden et al. 1998). In order for an entire landscape to have 30% increase in NPP, certain stands on that landscape would have to have much greater increase in NPP, which we did not simulate in our scenarios. Sustained increases in NPP of this magnitude over an entire forest landscape would not be consistent with observations that ecosystems often exhibit saturation behaviour under enriched CO2 and often are challenged by increased variability in weather conditions that result in reduced productivity (Canadell et al. 2007b).
The dynamic (time-dependent) nature of NPP responses to changes in growth and disturbance scenarios in our model prevents us from rendering a response surface against an axis showing a change in NPP as one of the independent variables. In our modelling environment, NPP is not an independent variable—it is calculated and is sensitive to both changes in growth and disturbance rates (Li et al. 2003). For example, an increase in disturbance rates results in a decrease in landscape-level NPP because larger areas of productive stands are killed, reducing the area of actively productive stands on the landscape. If it were possible to show response surfaces of the change in ecosystem C stocks after 50 years as a function of the change in NPP (and Rh in the case of the second surface) on the one axis and change in disturbance rates on the other, we might expect the result to appear less dramatic, but the essence of the findings would not change.
It is clear from figure 8a,b that very high increases in growth, sustained across the entire landscape, would be required to offset the increases in disturbance rates that are being projected for the North American boreal forest. Moreover, C losses associated with increased disturbance rates can only be offset if changes in NPP result in corresponding changes in NEP. Ecosystem responses to climate change will be complex and will probably not play out over short periods of time. If a simple, hypothetical landscape such as the one used in our simulations requires centuries to approach new equilibrium C stocks following one-time, stepwise ecological parameter changes, then we can certainly expect that real-world system responses to global change perturbations will involve long periods of adjustment with strong, temporally sensitive and synergistic behaviours.
5. Conclusions
Current projections suggest major increases in the average area burned annually by wildfire in Canada. It is also projected that non-disturbance global change factors such as increased atmospheric CO2 concentrations, increased N deposition and longer growing seasons could lead to significantly enhanced forest productivity. The combined outcome of these changes for boreal forest C dynamics will depend on the relative magnitudes of these changes. The model simulation experiments conducted here suggest that increases in growth rates can only offset the C losses from increased disturbance rates if these increases are not accompanied by corresponding increases in decomposition rates. For our hypothetical landscape, a 12% increase in growth rates was required to offset the C losses associated with a 20% increase in area burned annually, but only when the increased growth is not accompanied by a corresponding increase in decomposition rates. Furthermore, our enhanced growth scenarios were simulated as sustained growth enhancements across the entire landscape. It is not likely that all boreal forests will exhibit enhanced growth as an outcome of global change. Much of boreal North America is projected to have significantly lower summer precipitation (Ruosteenoja et al. 2003), and summer moisture deficits could cancel out much of the positive impacts of other global change factors, such as warmer springs or elevated atmospheric CO2 (Peng & Apps 1999; Barber et al. 2000; Angert et al. 2005; Kang et al. 2006).
The boreal forest biome is a large and diverse biome and will not be uniformly affected by global change. It is likely that some ecosystems will act as C sinks while others will act as C sources. The NBP of the larger landscape, however, will be driven by the combined impacts of both disturbances and changes in NEP. Even when NPP is enhanced, NEP may (Chen et al. 2006) or may not (Canadell et al. 2007b) be enhanced. Even when NEP is enhanced, changes in disturbance regimes will affect NBP. Myneni et al. (2001) observed C losses over much of Canada's boreal forests during the 1980s and 1990s despite the fact that increased photosynthetic activity had been observed during this same time period (Myneni et al. 1997; Slayback et al. 2003). These losses were brought about by increased disturbances (Kurz & Apps 1999). Zhuang et al. (2006) project that northern high-latitude ecosystems will probably act as net C sources during this century because the combined impacts of increased disturbance rates and increased soil respiration rates will result in more release of C than can be compensated by growth enhancement brought about by CO2 fertilization, unless there is extremely high accumulation of CO2 in the atmosphere (i.e. above 1100 ppm by 2100). Our results demonstrate that the magnitude of growth enhancements required to offset the impacts of projected increases in disturbance rates is so large as to be highly unlikely, and that we should therefore anticipate that the boreal forest biome will act as a net source of C to the atmosphere if climate change brings about the projected increases in disturbance rates.
Acknowledgments
This work was made possible in part through Government of Canada's climate change research funding. The CBM-CFS3 was developed with funding from the Federal Panel on Energy Research and Development (PERD), the Canadian Model Forest Network, and Natural Resources Canada, Canadian Forest Service. We also thank Caren Dymond, Hugh Barclay, Alan Thomson, Steve Glover and two anonymous reviewers for their constructive comments on earlier versions of this manuscript.
Footnotes
One contribution of 12 to a Theme Issue ‘The boreal forest and global change’.
References
- Angert A, Biraud S, Bonfils C, Henning C.C, Buermann W, Pinzon J, Tucker C.J, Fung I. Drier summers cancel out the CO2 uptake enhancement induced by warmer springs. Proc. Natl Acad. Sci. USA. 2005;102:10 823–10 827. doi: 10.1073/pnas.0501647102. [DOI] [PMC free article] [PubMed] [Google Scholar]
- Barber V.A, Juday G.P, Finney B.P. Reduced growth of Alaskan white spruce in the twentieth century from temperature-induced drought stress. Nature. 2000;405:668–673. doi: 10.1038/35015049. [DOI] [PubMed] [Google Scholar]
- Berg E.E, Henry J.D, Fastie C.L, De Volder A.D, Matsuoka S.M. Spruce beetle outbreaks on the Kenai Peninsula, Alaska, and Kluane National Park and Reserve, Yukon Territory: relationship to summer temperatures and regional differences in disturbance regimes. Forest Ecol. Manage. 2006;227:219–232. doi: 10.1016/j.foreco.2006.02.038. [DOI] [Google Scholar]
- Boudewyn, P., Song, X., Magnussen, S. & Gillis, M. D. 2007 Model based, volume-to-biomass conversion for forested and vegetated land in Canada. Information Report BC-X-411. Natural Resources Canada, Canadian Forest Service Victoria.
- Bunn A.G, Goetz S.J, Kimball J.S, Zhang K. Northern high-latitude ecosystems respond to climate change. Eos. 2007;88:333–340. [Google Scholar]
- Canadell J.G, et al. Contributions to accelerating atmospheric CO2 growth from economic activity, carbon intensity, and efficiency of natural sinks. Proc. Natl Acad. Sci. USA. 2007a;104:18 866–18 870. doi: 10.1073/pnas.0702737104. [DOI] [PMC free article] [PubMed] [Google Scholar]
- Canadell, J. G., Pataki, D. E., Gifford, R., Houghton, R. A., Luo, Y., Raupack, M. R., Smith, P. & Steffen, W. 2007b Saturation of the terrestrial carbon sink. In Terrestrial ecosystems in a changing world (eds J. G. Canadell, D. E. Pataki & L. F. Pitelka), pp. 59–78. The IGBP Series. Berlin, Germany: Springer.
- Carroll, A. L., Taylor, S. W., Régnière, J. & Safranyik, L. 2004 Effects of climate change on range expansion by the mountain pine beetle in British Columbia. In Mountain pine beetle symposium: challenges and solutions (eds T. L. Shore, J. E. Brooks & J. E. Stone), pp. 223–232. Information Report BC-X-399. Victoria, Canada: Natural Resources Canada.
- Carroll, A. L., Régnière, J., Logan, J. A., Taylor, S. W., Bentz, B. J. & Powell, J. A. 2006 Impacts of climate change on range expansion by the mountain pine beetle. Mountain pine beetle initiative working paper 2006-14. Victoria, Canada: Natural Resources Canada.
- Chen J, Chen W.J, Liu J, Cihlar J, Gray S. Annual carbon balance of Canada's forests during 1895–1996. Global Biogeochem. Cy. 2000;14:839–849. doi: 10.1029/1999GB001207. [DOI] [Google Scholar]
- Chen J.M, Chen B, Higuchi K, Liu J, Chan D, Worthy D, Tans P, Black A. Boreal ecosystems sequester more carbon in warmer years. Geophys. Res. Lett. 2006;33:L10803. doi: 10.1029/2006GL025919. [DOI] [Google Scholar]
- Cox P.M, Betts R.A, Jones C.D, Spall S.A, Totterdell I.J. Acceleration of global warming due to carbon-cycle feedbacks in a coupled climate model. Nature. 2000;408:184–187. doi: 10.1038/35041539. [DOI] [PubMed] [Google Scholar]
- Dargaville R, Baker D, Rödenbeck C, Rayner P, Ciais P. Estimating high latitude carbon fluxes with inversions of atmospheric CO2. Mitig. Adapt. Strat. Glob. Change. 2006;11:769–782. doi: 10.1007/s11027-005-9018-1. [DOI] [Google Scholar]
- de Groot W.J, Bothwell P.M, Carlsson D.H, Logan K.A. Simulating the effects of future fire regimes on western Canadian boreal forests. J. Veg. Sci. 2003;14:355–364. doi: 10.1658/1100-9233(2003)014[0355:STEOFF]2.0.CO;2. [DOI] [Google Scholar]
- Denman K.L, et al. Couplings between changes in the climate system and biogeochemistry. In: Solomon S, Qin D, Manning M, Chen Z, Marquis M, Averyt K.B, Tignor M, Miller H.L, editors. Climate change 2007: The physical science basis. Contribution of working group I to the fourth assessment report of the intergovernmental panel on climate change. Cambridge University Press; Cambridge, UK; New York, NY: 2007. pp. 499–587. [Google Scholar]
- de Vries W, Reinds G.J, Gundersen P, Sterba H. The impact of nitrogen deposition on carbon sequestration in European forests and forest soils. Global Change Biol. 2006;12:1151–1173. doi: 10.1111/j.1365-2486.2006.01151.x. [DOI] [Google Scholar]
- Euskirchen E.S, et al. Importance of recent shifts in soil thermal dynamics on growing season length, productivity, and carbon sequestration in terrestrial high-latitude ecosystems. Global Change Biol. 2006;12:731–750. doi: 10.1111/j.1365-2486.2006.01113.x. [DOI] [Google Scholar]
- Flannigan M.D, van Wagner C.E. Climate change and wildfire in Canada. Can. J. Forest Res. 1991;21:66–72. doi: 10.1139/x91-010. [DOI] [Google Scholar]
- Flannigan M.D, Amiro B.D, Logan K.A, Stocks B.J, Wotton B.M. Forest fires and climate change in the 21st century. Mitig. Adapt. Strat. Glob. Change. 2005a;11:847–859. doi: 10.1007/s11027-005-9020-7. [DOI] [Google Scholar]
- Flannigan M.D, Logan K.A, Amiro B.D, Skinner W.R, Stocks B.J. Future area burned in Canada. Clim. Change. 2005b;72:1–16. doi: 10.1007/s10584-005-5935-y. [DOI] [Google Scholar]
- Goodale C.L, et al. Forest carbon sinks in the Northern Hemisphere. Ecol. Appl. 2002;12:891–899. doi: 10.1890/1051-0761(2002)012[0891:FCSITN]2.0.CO;2. [DOI] [Google Scholar]
- Goulden M.L, et al. Sensitivity of boreal forest carbon balance to soil thaw. Science. 1998;279:214–217. doi: 10.1126/science.279.5348.214. [DOI] [PubMed] [Google Scholar]
- IPCC 2000 Land use, land-use change, and forestry. A special report of the Intergovernmental Panel on Climate Change (eds R. T. Watson, I. R. Noble, B. Bolin, N. H. Ravindranath, D. J. Verardo & D. J. Dokken). Cambridge, UK; New York, NY: Cambridge University Press.
- Kang S, Kimball J.S, Running S.W. Simulating effects of fire disturbance and climate change on boreal forest productivity and evapotranspiration. Sci. Total Environ. 2006;362:85–102. doi: 10.1016/j.scitotenv.2005.11.014. [DOI] [PubMed] [Google Scholar]
- Kull, S. J., Kurz, W. A., Rampley, G. J., Banfield, G. E., Schivatcheva, R. K. & Apps, M. J. 2006 Operational-scale carbon budget model of the Canadian forest sector (CBM-CFS3) version 1.0: user's guide. Edmonton, Canada: Natural Resources Canada.
- Kurz W.A, Apps M.J. An analysis of future carbon budgets of Canadian boreal forests. Water Air Soil Poll. 1995;82:321–331. doi: 10.1007/BF01182844. [DOI] [Google Scholar]
- Kurz W.A, Apps M.J. A 70-year retrospective analysis of carbon fluxes in the Canadian forest sector. Ecol. Appl. 1999;9:526–547. doi: 10.1890/1051-0761(1999)009[0526:AYRAOC]2.0.CO;2. [DOI] [Google Scholar]
- Kurz, W. A., Apps, M. J. Webb, T. M. & McNamee, P. J. 1992 The carbon budget of the Canadian forest sector: phase I. Information Report NOR-X-326. Forestry Canada, Edmonton.
- Kurz W.A, Apps M.J, Stocks B.J, Volney W.J.A. Global climatic change: disturbance regimes and biospheric feedbacks of temperate and boreal forests. In: Woodwell G.F, Mackenzie F, editors. Biospheric feedbacks in the global climate system: will the warming feed the warming? Oxford University Press; New York, NY: 1995. pp. 119–133. [Google Scholar]
- Kurz W.A, Beukema S.J, Apps M.J. Carbon budget implications of the transition from natural to managed disturbance regimes in forest landscapes. Mitig. Adapt. Strat. Glob. Change. 1998;2:405–421. [Google Scholar]
- Li Z, Apps M.J, Kurz W.A, Banfield E. Temporal changes of forest NPP and NEP in west central Canada associated with natural and anthropogenic disturbances. Can. J. Forest Res. 2003;33:2340–2351. doi: 10.1139/x03-168. [DOI] [Google Scholar]
- Logan J.A, Régnière J, Powell J.A. Assessing the impacts of global warming on forest pest dynamics. Front. Ecol. Environ. 2003;1:130–137. [Google Scholar]
- Myneni R.B, Keeling C.D, Tucker C.J, Asrar G, Nemani R.R. Increased plant growth in the northern high latitudes from 1981 to 1991. Nature. 1997;386:698–702. doi: 10.1038/386698a0. [DOI] [Google Scholar]
- Myneni R.B, Dong J, Tucker C.J, Kaufmann R.K, Kauppi P.E, Liski J, Zhou L, Alexeyev V, Hughes M.K. A large carbon sink in the woody biomass of northern forests. Proc. Natl Acad. Sci. USA. 2001;98:14 784–14 789. doi: 10.1073/pnas.261555198. [DOI] [PMC free article] [PubMed] [Google Scholar]
- Nemani R.R, Keeling C.D, Hashimoto H, Jolly W.M, Piper S.C, Tucker C.J, Myneni R.B, Running S.W. Climate-driven increases in global terrestrial net primary production from 1982 to 1999. Science. 2003;300:1560–1563. doi: 10.1126/science.1082750. [DOI] [PubMed] [Google Scholar]
- Peng C.H, Apps M.J. Modelling the response of net primary productivity (NPP) of boreal forest ecosystems to changes in climate and fire disturbance regimes. Ecol. Model. 1999;122:175–193. doi: 10.1016/S0304-3800(99)00137-4. [DOI] [Google Scholar]
- Price C, Rind D. The impact of a 2×CO2 climate on lightning-caused fires. J. Clim. 1994;7:1484–1494. doi: 10.1175/1520-0442(1994)007<1484:TIOACC>2.0.CO;2. [DOI] [Google Scholar]
- Ruosteenoja K, Carter T.R, Jylhä K, Tuomenvirta H. Edita Publishing Ltd; Helsinki, Finland: 2003. Future climate in world regions: an intercomparison of model-based projections for the new IPCC emissions scenarios. The Finnish Environment 644. [Google Scholar]
- Slayback D.A, Pinzon J.E, Los S.O, Tucker C.J. Northern Hemisphere photosynthetic trends 1982–99. Global Change Biol. 2003;9:1–15. doi: 10.1046/j.1365-2486.2003.00507.x. [DOI] [Google Scholar]
- Steffen W, et al. Springer; Heidelberg, Germany: 2004. Global change and the Earth system: a planet under pressure. [Google Scholar]
- Stocks B.J, et al. Large forest fires in Canada, 1959–1997. J. Geophys. Res. Atmos. 2002;108:FFR5.1–FFR5.12. doi: 10.1029/2001JD000484. [DOI] [Google Scholar]
- Thompson C.D, McGuire A.D, Clein J.S, Chapin F.S, III, Beringer J. Net carbon exchange across the arctic tundra–boreal forest transition in Alaska 1981–2000. Mitig. Adapt. Strat. Glob. Change. 2006;11:805–827. doi: 10.1007/s11027-005-9016-3. [DOI] [Google Scholar]
- Thornley J.H.M, Cannell M.G.R. Long-term effects of fire frequency on carbon storage and productivity of boreal forests: a modeling study. Tree Physiol. 2004;24:765–773. doi: 10.1093/treephys/24.7.765. [DOI] [PubMed] [Google Scholar]
- van Wagner C.E. Age-class distribution and the forest fire cycle. Can. J. Forest Res. 1978;8:220–227. [Google Scholar]
- Zhuang Q, et al. CO2 and CH4 exchanges between land ecosystems and the atmosphere in northern high latitudes over the 21st century. Geophys. Res. Lett. 2006;33:L17403. doi: 10.1029/2006GL026972. [DOI] [Google Scholar]


