Abstract
This paper describes variability in trends of annual tree growth at several locations in the high latitudes of Eurasia, providing a wide regional comparison over a 2000-year period. The study focuses on the nature of local and widespread tree-growth responses to recent warming seen in instrumental observations, available in northern regions for periods ranging from decades to a century. Instrumental temperature data demonstrate differences in seasonal scale of Eurasian warming and the complexity and spatial diversity of tree-growing-season trends in recent decades. A set of long tree-ring chronologies provides empirical evidence of association between inter-annual tree growth and local, primarily summer, temperature variability at each location. These data show no evidence of a recent breakdown in this association as has been found at other high-latitude Northern Hemisphere locations. Using Kendall's concordance, we quantify the time-dependent relationship between growth trends of the long chronologies as a group. This provides strong evidence that the extent of recent widespread warming across northwest Eurasia, with respect to 100- to 200-year trends, is unprecedented in the last 2000 years. An equivalent analysis of simulated temperatures using the HadCM3 model fails to show a similar increase in concordance expected as a consequence of anthropogenic forcing.
Keywords: climate change, Eurasia, tree-ring chronology, temperature
1. Introduction
Recent general circulation model (GCM) experiments, run to provide scenarios of possible future climates that might arise as a consequence of increasing atmospheric greenhouse gas (GHG) concentrations, display a clear general agreement regarding the likelihood of greater magnitude warming occurring at high northern latitudes compared with other areas of the world. Multi-model ensemble simulation maps for a range of possible emission scenarios display maximum warming in the Arctic by the end of this century, with strong warming indicated over high northern land masses (e.g. fig. SPM-5, IPCC 2007). Regionally averaged annual mean instrumental temperature observations spanning the last 150 years show the Arctic land areas to have warmed by an amount double that for the rest of the globe, with the post-1980 warming particularly strong and observed more in winter than summer (Trenberth et al. 2007). This apparent amplification in the observed warming of Arctic regions compared with other areas of the globe might arguably be considered consistent with the pattern of expected warming indicated by different GCMs (Serreze & Francis 2006). However, the strong multi-decadal component of temperature variability in the observational temperature records and the relative scarcity of data coverage severely hamper the identification of a clear amplified Arctic warming (Polyakov et al. 2002).
2. Northern Eurasian instrumental temperature patterns
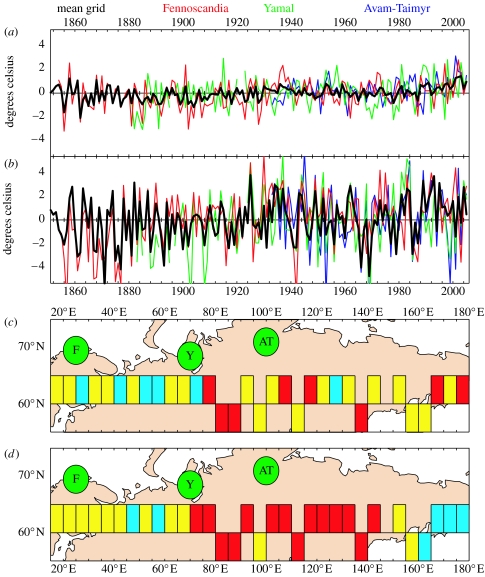
Figure 1a,b illustrates the evolution of summer and winter temperature changes, respectively, observed over northern Eurasia. These data are based on gridded station records, expressed as anomalies from the mean values for 1961–1990 (Brohan et al. 2006). The bold curves show mean June to August and December to February values averaged over thirty-five 5°×5° grid boxes (taken from CRUTEM3 dataset; see appendix A). Besides the large difference in the variance of the winter compared with the summer time-series data, there is also a notable difference in the relative magnitude of the apparent seasonal warming trends. The recent (post-1980) warming is pronounced in summer, exceeding the summer warmth of the 1930s, whereas this is not true for the winter season, when the warmth of the 1930s is clear and of a level equivalent to, or exceeding, that seen during the last 20 years. Selected regional temperature series, corresponding to three areas from which long tree-ring records are available (in Fennoscandia, Yamal and Avam–Taimyr; shown as red, green and blue lines) show the 1930s summer warming to be located in the west, adjacent to the North Atlantic, which also showed particular warmth at this time (Trenberth et al. 2007).
Figure 1.
High-latitude Eurasian instrumental seasonal temperature series for: (a) summer, the mean of June to August and (b) winter, the mean of December to February. The thick black line indicates the average of monthly land air temperature data for the thirty-five 5°×5° grid boxes (Brohan et al. 2006) listed in appendix A. The data are anomalies from the 1961 to 1990 period mean. Individual grid box data representing Fennoscandia (62.5° N, 22.5° E), Yamal (62.5° N, 67.5° E) and Avam–Taimyr (62.5° N, 102.5° E) are also shown. Temperature trends for (c) summer and (d) winter for the period 1950–1994 (calculated from standardized instrumental anomaly data) for individual 5°×5° average grid box series listed in appendix A. The sign and magnitude of the trends are indicated by colour coding. The only significant trends (p>0.05) are positive (i.e. greater than 0.015 as per the scale of figure 2). The green circles show the approximate source regions of tree-ring chronology data (table 1) described in this paper: F, Fennoscandia; Y, Yamal; AT, Avam–Taimyr.
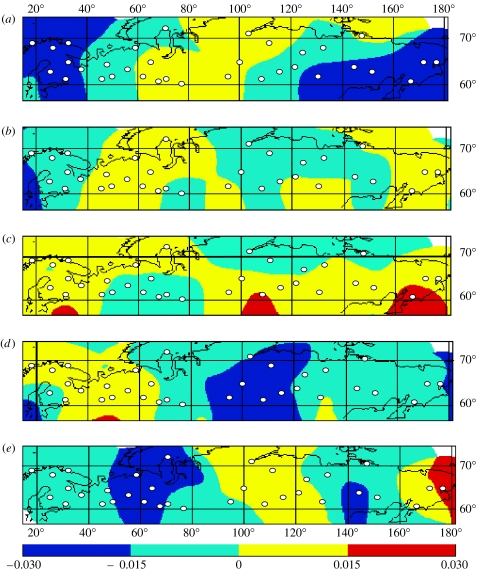
Figure 1c,d is a simple representation of the magnitude of recent trends (calculated over 1950–1994 to be comparable with available daily data results described later) within individual grid boxes (again from the CRUTEM3 dataset) for the standard summer (June to August) and winter (December to February) seasons reaching across northern Eurasia. This shows that the only significant trends over this period are in areas of central (in winter) and eastern (in summer) Siberia. To further illustrate the complexity of temperature changes across Eurasia, with specific reference to the character of the vegetation ‘growing season’, we also show a number of simple maps (figure 2), each representing the spatial distribution of trends in a particular temperature-related parameter calculated over the period 1950–1994. This period is common to 34 station records for which daily temperature data were available (appendix A), and which provide even coverage of data across Fennoscandia and Russia, between 55° N and 65° N.
Figure 2.
The spatial distribution of trends in a number of growing-season-related temperature parameters: (a) the start of the growing season; (b) the end of the growing season; (c) the growing degree day sum greater than 5°C within the growing season; (d) the number of frost days in the growing season and (e) the timing of maximum temperature. All data refer to the period 1950–1994 and are based on the 34 meteorological station records (shown as white dots: see appendix A for details) distributed across northern Eurasia. The trend data are normalized and colour coded so that dark blue and red indicate trends that are significant at the 95% level.
Different vegetation growing season parameters were calculated from these data. These include: the start and end day of the vegetation growing season; the growing degree day (greater than 5°C) sum; the number of frost days during the growing season; and the date when the maximum temperature during the growing season was attained. The annual time series for each of the first two parameters were calculated and smoothed to suppress variability at time scales less than 13 days, and the smoothed data were used to define the actual start and end of the growing season in each year, using a threshold of 5°C. The numbers of degrees above 5°C were summed across all days, using the unsmoothed daily data, during the previously defined growing season. Frost days were defined as the number of days with a minimum temperature of 2°C or lower. The timing of maximum warmth was based on the smoothed daily mean data. For each parameter, the variance of the time series at each station has been standardized, by subtracting the mean and dividing by the standard deviation, and a simple linear trend line fitted to the 45-year series. The trend coefficients at the 34 stations were then used as the basis for an inverse distance weighted contouring (Nogenkova et al. 2000; Shishov et al. 2002; Vjsotskaya et al. 2002) and the resulting maps plotted to show areas of positive and negative trends, with areas of significant (random p<0.05) trend shown as dark blue (negative) or red (positive).
It is immediately apparent that the patterns of growing season trends are complex. The start of the growing season has advanced significantly during this period in Fennoscandia and eastern Siberia (figure 2a) with no significant trends apparent between longitudes 40° and 120° E. As for the end of the growing season (figure 2b), no significant trends are apparent across the whole of northern Eurasia. Except for three stations in the northernmost areas east of Taimyr and a group of seven stations in the south of our network (between 50° and 80° E), increases in growing degree day sums are apparent across the whole extent of northern Eurasia (figure 2c). However, like the stations showing reduced growing season warmth, virtually none show trends that are statistically significant. Only for two stations (Erbogachen and Korf) in the south of this network, at 108° and 166° E, have growing seasons become significantly warmer, consistent with the summer trends for grid boxes at these longitudes shown in figure 1c, but not consistent with the significant warming near 80° E, seen in the figure 1c summer gridded data, not apparent in figure 2c. In much of central and eastern Siberia, the incidence of growing season frost days has declined but to a statistically significant extent only in central northern Siberia (figure 2d). This contrasts with evidence for a slight and insignificant increase in growing season frost days in the west, perhaps associated with the increasingly early start of the growing season in this region. Figure 2e shows that, across much of northern Eurasia, between 10° and 90° E, and between 130° and 160° E, the peak of summer warmth is also experienced earlier, but significantly so mostly in western Siberia, between 30° and 70° E. There is also some suggestion, as with growing degree day sum trends, that there is a contrasting trend in the extreme east, where the peak summer warmth has moved significantly later. Hence, the character of temperature trends (at least up to the end of these data in 1994) is seen to be spatially very heterogeneous and the rates and observed magnitude of growing season changes vary in a way that is very dependent on location.
3. Selected Eurasian tree-ring chronologies
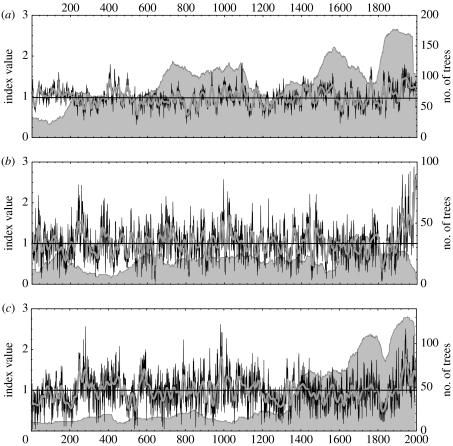
Ring-width measurements from the AD portions of selected long chronologies comprising data from a mixture of living and sub-fossil trees (described in table 1) were reprocessed and used to create three regional chronologies. Figure 1c shows their approximate locations and figure 3 shows the three regional chronologies and their constituent tree counts changing over time. The Swedish Torneträsk data (Grudd et al. 2002) and Finnish–Lapland data (Eronen et al. 2002; Helama et al. 2002), for pine (Pinus sylvestris), were combined to create a single Fennoscandia regional chronology. Siberian larch (Larix sibirica) data from the area immediately east of the northern Ural Mountains, previously used by Hantemirov & Shiyatov (2002), were used as the Yamal regional chronology, and larch (Larix gmelinii) data from Bol'shoi Avan (Sidorova et al. 2007) and Taimyr (Naurzbaev et al. 2002) were combined to form the Avam–Taimyr regional chronology. For each of these three regional sample collections, a statistical model was derived expressing expected ring-width in that area as a function of tree age for that region and tree species. This is achieved empirically by aligning and averaging measured ring widths from all available samples by relative tree age (assuming in this case that the first sample ring represented the first year of the tree's lifespan, and making no allowance for assumed difference from the true germination year) and using an age-related smoothing of these data (Melvin et al. 2007) to provide a practical reference curve. Each sample ring-width series can then be expressed as a series of deviations from this curve by dividing measured by expected values for the appropriate ring age of tree, in effect producing a series of relative indices that are then averaged, with respect to correct calendar age, to produce a dimensionless time series or chronology. This so-called regional curve standardized (RCS) chronology preserves short- and long-term variability of tree growth but mitigates against spurious changes in the mean chronology arising from the temporal coincidence of young-tree (relative wide rings) and old-tree (narrow rings) samples (Briffa et al. 1992 and earlier references therein).
Table 1.
Tree sampling sites, the latitude and longitude (degrees and minutes) of their location, start and end date of the period spanned by the measured ring widths contributing to the chronologies, the total number of samples, the mean between-sample correlation (RBar) at inter-annual (high frequency) and multi-decadal (low frequency) time scales, tree species (PISY is Pinus sylvestris, LASI is Larix sibirica and LAGM is Larix gmelinii), and a reference to the source of data. Italics indicate regional average chronologies.
| site name | north | east | start | end | samples | RBar | species | references | |
|---|---|---|---|---|---|---|---|---|---|
|
| |||||||||
| high | low | ||||||||
| Torneträsk | 68° 14 | 19° 40 | −38 | 1997 | 587 | 0.37 | 0.25 | PISY | Grudd et al. (2002) |
| Finnish–Lapland | 69° 50 | 28° 00 | −289 | 1999 | 430 | 0.38 | 0.27 | PISY | Helama et al. (2002) |
| Fennoscandia | −289 | 1999 | 1017 | 0.33 | 0.22 | PISY | |||
| Yamal | 67° 30 | 70° 00 | −200 | 1996 | 611 | 0.54 | 0.24 | LASI | Hantemirov & Shiyatov (2002) |
| Yamal | −200 | 1996 | 611 | 0.54 | 0.24 | LASI | |||
| Bol'shoi Avam | 70° 30 | 93° 01 | 851 | 2003 | 178 | 0.50 | 0.24 | LAGM | Sidorova et al. (2007) |
| Taimyr | 72° 00 | 101° 00 | −207 | 2000 | 152 | 0.52 | 0.23 | LAGM | Naurzbaev et al. (2002) |
| Avam–Taimyr | −207 | 2003 | 330 | 0.46 | 0.21 | LAGM | |||
| Northwest Eurasia | −289 | 2003 | 1599 | 0.18 | 0.15 | ||||
Figure 3.
Regional curve standardized (RCS) chronologies (thin lines) and smoothed chronologies, the sum of the first three components of singular spectrum analysis of each RCS chronology (thick lines), for the regions: (a) Fennoscandia, (b) Yamal and (c) Avam–Taimyr. The grey shading represents the changing number of samples that go to make up the chronology through time.
Combining different site data to form regional chronologies is generally only valid if there is an inherent common signal representing the expression of an underlying common forcing in the regional data. The assumption here is that each regional aggregation of data, and hence the variability of ring-width indices from year to year and on longer time scales, represents the expression of common climatic forcing. Table 1 also shows values of the mean inter-series correlation (RBar; Briffa & Jones 1990) calculated separately for shorter (high frequency) and longer (low frequency) time-scale tree-growth variability. The high-frequency regional RBar values, representing correlations between 30-year high-pass filtered tree-ring indices (with minimum overlap of 30 years) vary from 0.33 for the Fennoscandia regional pine data to 0.54 for the more localized data at Yamal. The high-frequency component of common growth forcing is significantly greater for larch than for western pine. There is very low common high-frequency signal across the three regions, as shown by the overall dataset RBar of 0.18. The strength of the low-frequency common signal (RBar calculated for 30-year smoothed RCS indices) is lower within each region in comparison with the high-frequency data, but the RBar values at longer time scales are much more consistent between regions and species, ranging from 0.22 to 0.24. The wider inter-regional low-frequency signal, 0.15, is again lower than that within any region, but the differences are notably less than differences in the intra- and inter-regional high-frequency signals. If the large-scale high- and low-frequency signals are calculated by averaging correlations calculated between series of RCS indices only in different regions (i.e. by excluding any comparisons of series within the same region), the high-frequency RBar is virtually zero (0.03), indicative of no common signal. However, the low-frequency value remains the same as that shown in table 1, 0.15, indicating the presence of a genuine, though very weak, large-scale underlying common forcing signal at decadal and longer time scales.
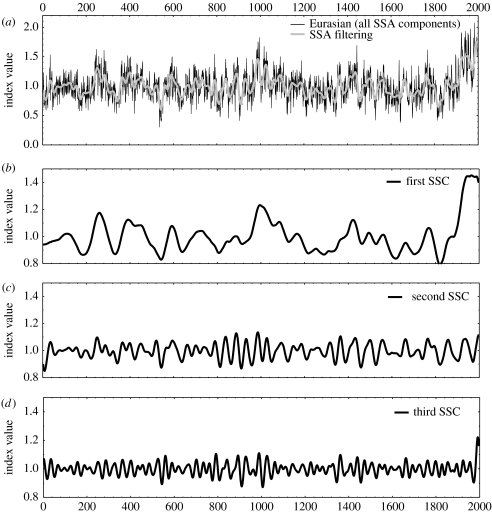
To provide an objective picture of the long time-scale variations in these data, the three regional RCS chronologies were also filtered using singular spectrum analysis (SSA) filtering (Elsner & Tsonis 1996; Cook et al. 2006). The first three SSA components (SSCs) of each series were averaged to create SSA-defined low-frequency chronologies (figure 4). These SSA chronologies explain 64% of the initial total variance for Fennoscandia, 44% of the variance for Yamal and 38% of the variance for Avam–Taimyr, reflecting the proportionately higher inter-annual versus century time-scale variability inherent in the larch, as compared with the pine, chronologies. A single Northwest Eurasian RCS chronology was also created as the arithmetic mean of the Fennoscandia, Yamal and Avam–Taimyr RCS chronologies. The northwest Eurasian chronology and its first three SSC series, accounting for 35, 17 and 13% of the original series, respectively, are shown in figure 4. Unlike the individual regional chronologies, this subcontinental-scale chronology average is not expected to represent a common or homogeneous underlying forcing, but rather the average of potentially disparate regional trends. However, high values in northwest Eurasian series, particularly the unusual magnitude of the first SSC in the twentieth century, could be interpreted as evidence of increased common forcing of tree growth at a continental scale.
Figure 4.
(a) The RCS northwest Eurasian chronology (thin lines) and the same chronology smoothed (thick lines), by adding the total variance explained by the (b) first, (c) second and (d) third singular spectrum component time series.
4. Changing patterns in tree growth
The first point to stress about the regional series is the clear evidence they provide for significant tree-growth variability at inter-annual, decadal and centennial time scales. As has been shown to varying degrees in previous analyses of these data (Briffa 2000; Grudd et al. 2002; Hantemirov & Shiyatov 2002; Helama et al. 2002; Naurzbaev et al. 2002; Sidorova et al. 2007), there is clear evidence of relatively high growth rates and, hence, evidence for a prevalence of inferred relatively warm summers during the twentieth century in each of these regions and, as a consequence, in the average northwest Eurasian series. There are periods of earlier coincident warmth apparent between various chronologies: in Fennoscandia and Yamal (in the early fifteenth and nineteenth centuries); in Fennoscandia and Avam–Taimyr (approx. AD 400 and in the early eighteenth century); and in both Yamal and Avam–Taimyr (in the early third, late fourth and late eighteenth centuries). However, prior to the twentieth century, only one period stands out as warm in all regions, a period several decades either side of AD 1000. This is shown prominently in the northwest Eurasian series, but it is clearly punctuated by a brief cold episode, largely related to the short cool interval in the Yamal series (see also Briffa 2000). Hence, there is clear evidence for an interval of widespread enhanced medieval tree growth at high latitudes. While locally, this is apparently equivalent in scale to the recent growth levels in Avam–Taimyr and to early twentieth century growth levels in Yamal, when viewed over northwest Eurasia as a whole, the medieval high tree-growth phase seems not to be as strong or as persistent as growth levels observed after 1920.
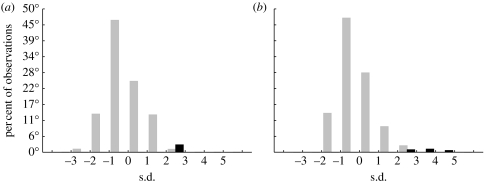
In order to assess the changing nature of large-scale average tree-growth variability over the last two millennia, two parameters were calculated for all consecutive 101-year moving time windows: firstly, the trend (the slope coefficient of a least-squares fitted regression line) and, secondly, the arithmetic mean, both obtained from the SSA-filtered northwest Eurasian chronology. Values were assigned to the centre year of the moving window (i.e. the 1946 values refer to the window 1896–1996). The standardized distributions of the results are shown in figure 5, with values for windows centred between AD 51–1849 and 1900–1946 shown separately. The modern trends and mean values are clearly anomalously high (as they are in each individual region, not shown here).
Figure 5.
Distributions of the standardized 101-year moving (a) trend parameters and (b) means, calculated from the SSA-filtered Northwest Eurasian chronology. Note that the results are not substantially different if based on unfiltered data and are shown for separate analysis periods with windows centred on years between AD 51–1849 (grey bars) and 1900–1946 (black bars).
5. Relationships between tree growth and climate
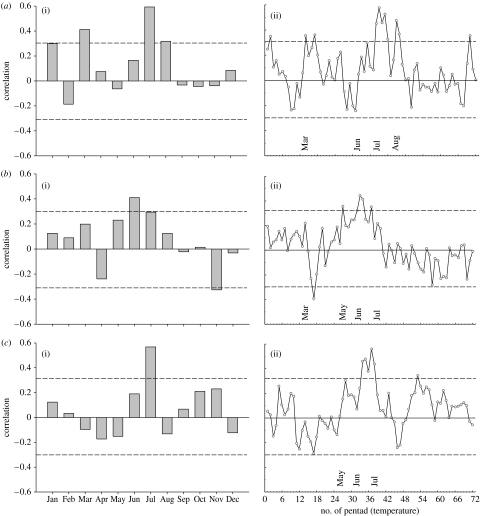
A simple correlation analysis comparing annual tree-ring growth in the three regions and monthly precipitation shows no significant relationships and is consistent with previous results for sites that are at or near the northern Eurasian tree line (Briffa et al. 1990, 1992, 1998a; Vaganov et al. 1996, 2000; Kirchhefer 2001; Grudd et al. 2002). In northern Eurasia, up to 70% of the variance in indices of timberline ring-width variations can be associated with summer temperature changes (Jacoby et al. 2000; Naurzbaev & Vaganov 2000; Vaganov et al. 2000; Briffa et al. 2001, 2002). The results of a simple correlation analysis between annual tree-growth indices for each region and mean monthly temperatures from the station local to the tree-growth for the period 1950–1993 are shown in figure 6.
Figure 6.
Correlation plots (1950–1994) between regional RSC chronologies and (i) local monthly mean temperatures and (ii) pentad data of (a) Fennoscandia, (b) Yamal and (c) Avam–Taimyr. The dashed horizontal lines indicate thresholds for correlations significant at the 95% level. See the legend of figure 8 and appendix A for details of the temperature data.
The predominant influence of warm-season temperature on tree growth is clear in each region but the precise timing of the maximum correlations differs. While noting the probable sensitivity of the results to the particular analysis period (Esper et al. 2005), it is still apparent that the optimum sensitivity in Fennoscandia, is to July and August temperatures. In Yamal, the season is somewhat earlier, in June and July, whereas in Avam–Taimyr, only warm July temperatures exert a clear positive growth influence. These results are generally consistent with the results of previous work cited above. In order to refine the timing of the optimum temperature influence on growth, beyond that possible using relatively crude monthly mean temperatures, figure 6 also shows the results of a similar correlation exercise but one that uses pentad mean temperatures calculated from available daily temperature series (Abisko, Hoseda-Hard and Hatanga; appendix A). Pentads are defined here as the mean of five consecutive daily mean measurements, numbered from the 1st, including the first 5 days of January, to the 73rd, including the last 5 days of December.
Again allowing for sampling error, these results imply that the more precise timing of the statistically significant temperature influences on tree growth encompasses late June, July and early August in Fennoscandia, late May, June and early July in Yamal, and the second half of June and the first half of July at Avam–Taimyr, the latter also consistent with the results of previous work (Kirdyanov et al. 2003). These results also imply that, while early spring warmth in March is likely to enhance ring-width growth in Fennoscandia (figure 6a), it is detrimental in Yamal (figure 6b) and Avam–Taimyr (figure 6c).
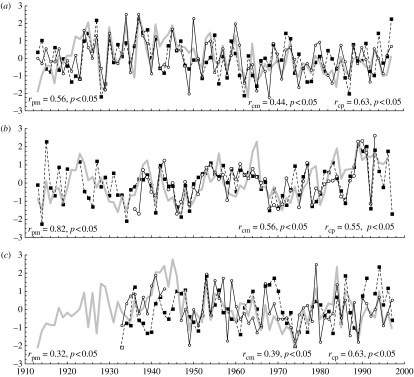
Figure 7 provides a visual comparison of the common variability between local temperatures and tree growth as represented by the most recent sections of the three regional chronologies. The correspondence between inter-annual and multi-decadal changes in growing season temperatures is consistent and highly significant in each region. Summing the appropriate local pentad totals (pentads 38–42 for Fennoscandia, 27–37 for Yamal and 34–38 for Avam–Taimyr; figure 6), it is clear that the temperature/tree-growth relationship is strong and stable through time. As expected, in each region the simple correlations between the single series of cumulative pentad data and the chronology covary strongly with values varying from 0.63 in Fennoscandia; 0.55 in Yamal and 0.63 in Avam–Taimyr. The equivalent correlations based on mean monthly grid box data (July and August in Fennoscandia, June and July in Yamal and July in Avam–Taimyr) are 0.44, 0.56 and 0.39, respectively which, except for Yamal, are notably lower than for the more temporally refined pentad data. In the Yamal region, the response ‘window’ based on pentad data corresponds more closely with the timing of the mean monthly window data (figure 6), as is indicated by the high correlation between the monthly mean and pentad series for this region (0.82 compared with 0.56 and 0.32 for Fennoscandia and Avan-Taimyr, respectively). It should also be noted, in considering figure 7, that there is no evidence in these series for any recent divergence between instrumentally measured temperatures and tree-growth trends, as has been observed for some high-latitude chronologies and discussed in the recent literature (Jacoby & D'Arrigo 1995; Briffa et al. 1998b; Vaganov et al. 1999; Jacoby et al. 2000; D'Arrigo et al. 2004; Wilmking et al. 2004).
Figure 7.
Variability of local cumulative pentad temperature data (black solid line), monthly mean grid box temperature data (black dashed line) and RCS tree-ring indices (thick grey line) for different regions: (a) Fennoscandia (temperature data are either the sum of Abisko consecutive pentads from number 38 to 46 or monthly means of July and August); (b) Yamal (Hoseda-Hard pentads from 27 to 37 and monthly mean for June and July) and (c) Avam–Taimyr (Hatanga pentads from 34 to 38 and monthly mean for July). All data were standardized by subtraction of the mean and division by the standard deviation over the period common to both temperature and tree-ring indices. Simple correlations between chronology and monthly mean temperatures (rcm) and between chronology and cumulative pentad temperatures (rcp), along with their significance levels are shown in the lower right of each box. Correlations between the monthly mean and cumulative pentad data (rpm) are given in the lower left. All correlations are significant at the 95% level.
6. Large regional-scale concordance in tree growth
In order to quantify the degree of correspondence in tree-growth trend changes on time scales ranging from multi-decadal to centennial, we have compared the temporal growth patterns across all RCS chronologies using the Kendall's (1975) concordance coefficient, applied over different moving time windows (appendix B). In effect, this is similar to calculating a moving Spearman rank correlation coefficient but enables more than two series to be compared at once (Siegel & Castellan 1988; Zar 1999). Unlike the more frequently applied Pearson correlation coefficient, with a range of −1 to +1, the concordance coefficient varies from 0 to 1, with 0 indicating no common signal between the time series being compared and a value of 1 indicating perfect parallel ordering of the elements being compared. Here, the concordance coefficient was used because previous work using simulated data (Shishov & Ivanovsky 2006) had shown that it reveals measures of the similarity in variability between series even in the presence of significant levels of white and even red noise. Similarly, the concordance coefficient is less sensitive to the length of the analysis period (or moving window) when this is short (Shishov & Ivanovsky 2006), in comparison with average Pearson correlations (sliding RBar).
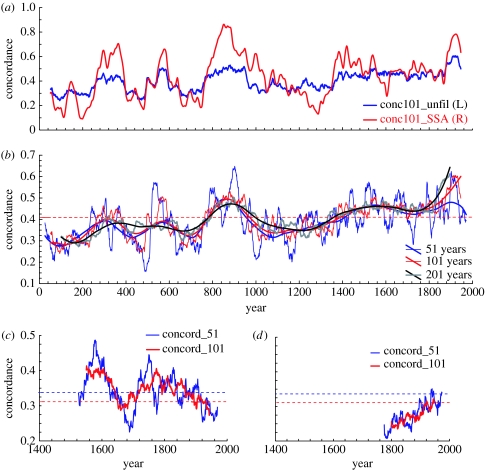
Figure 8a shows the results of alternative applications of the concordance coefficient for comparing 101-year growth trends across the three regional RCS chronologies: first, using the year-to-year data and second, using the SSA smoothed chronology data in each region (figure 3). In the smoothed data, high values of concordance are achieved for the comparison of the most recent section of the chronologies (for windows centred between approx. 1890 and 1930, corresponding to a range of comparisons spanning approx. 1840–1980), though they have since fallen slightly, probably associated with the extreme growth increase in Yamal that is not matched in Fennoscandia or Avam–Taimyr. However, even higher concordance values are found in the smoothed data between 840 and 880 (comparisons spanning 790–930), but these are associated with a series of oscillations following a widespread cool period approximately 800 (figures 3 and 4) and not with the warm period approximately 1000. In the unsmoothed data, relatively high concordance is apparent again in medieval times, but the highest values in 2000 years are recorded for windows spanning the most recent century or so. In figure 8b, concordance is calculated for different length windows using the raw RCS indices, but the results for each window length are smoothed (using the negative exponential least-squares method; Mclain 1974), which is roughly equivalent to using a 200-year spline. In the unsmoothed concordance series, except for the shortest (51 years) window results which clearly show high concordance approximately 900, there is evidence of rising and unprecedented similarity in tree growth across northwest Eurasia in the most recent century. This is accentuated in the smoothed series for 101- and 201-year window lengths.
Figure 8.
(a) Kendall's concordance coefficients calculated for overlapping 101-year windows using the RCS chronologies of Fennoscandia, Yamal and Avam–Taimyr, as SSA-filtered data (red line) and unfiltered data (blue line); (b) concordance coefficients for the unfiltered RCS chronologies calculated for moving windows of 51, 101 and 201 years, and the same data smoothed using the negative-exponential weighted least-squares method; (c) concordance coefficients for windows of 51 and 101 years comparing the mean of June and July mean monthly temperatures for three regions (equivalent to the sources of the three chronologies) as simulated by HadCM3 for 500 years under ‘natural’ forcings and (d) the equivalent concordance values using the same regional temperatures extracted from a 250-year experiment under combined natural and anthropogenic forcing (the ‘all forcings’ experiment). Significance levels (p=0.05) shown as dashed lines on (b–d).
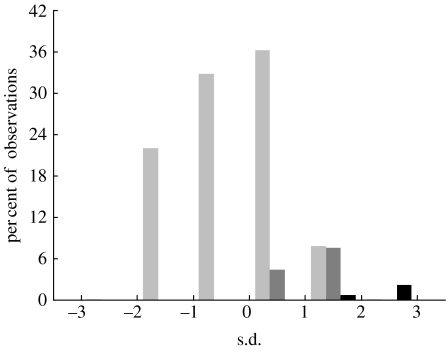
Figure 9 shows the standardized distribution of 1846 concordance coefficients (plotted within one standard deviation classes) calculated between the three RCS regional curves for overlapping 101-year windows (the thin red line in figure 8b; data have a mean concordance of 0.4 with a standard deviation of 0.08). The values are distinguished according to whether they derive from one of three periods: moving windows centred between 764 and 960 (n=197), and so roughly incorporating the medieval period; modern values, including windows centred between 1900 and 1946 (n=47); and the values for the remaining windows (n=1602). The medieval values generally lie between 0 and 2 standard deviations of the mean, but the recent values all lie between 1 and 3 standard deviations, most between 2 and 3 standard deviations. This is strongly indicative of an unprecedented level of agreement in centennial tree-growth trends across the whole of northwest Eurasia in a context of at least 2000 years. This is suggestive of very unusual, near continental scale, common forcing of northern tree growth and probably the result of an increasingly widespread similarity in summer warming.
Figure 9.
Distribution of (standardized) concordance coefficients (mean=0.40, s.d.=0.08) between the RCS chronologies of Fennoscandia, Yamal and Avam–Taimyr (derived for 101-year moving windows) and separated into three time periods with windows centred on AD 51–1899 (light grey bars) excluding 764–960 (dark grey bars) shown separately and 1900–1946 (black bars).
As a final comparison, we investigated the changes in the concordance coefficient of summer temperatures at locations equivalent to those of the three chronology regions that are the focus of this paper, but using simulated rather than observed or inferred temperature data. Mean summer temperature data were extracted from two simulations made with the UK Hadley Centre fully coupled atmosphere/ocean GCM (HadCM3, see Tett et al. 2007). These simulations were run as part of the European project SO&P (http://www.cru.uea.ac.uk/cru/projects/soap/). One of these simulations, run for the last 500 years (AD 1500–2000), uses only ‘natural’ forcings (a combination of orbital, land use and estimated irradiance changes and volcanic activity). The other, run only for the period 1750–2000, uses the same natural forcings but includes the additional influence of increasing atmospheric GHG concentrations (the so-called ‘all forcings’ run). Changing concordance values for these simulations are also shown plotted, for overlapping 51- and 101-year periods, in figure 8c,d.
The concordance values clearly increase steadily throughout the duration of the all forcings simulation, but the magnitude of the values is low, even by the end of the experiment. Indeed even the maximum concordance values calculated for the series 101-year windows reach only just above 0.3, barely significant, while values approaching 0.4 occur in the naturally forced experiment. These results imply either that an interpretation of strong external forcing of recent widespread high warmth over northern Eurasia, perhaps the consequence of increased atmospheric GHGs, cannot be supported or, alternatively, that this particular GCM simulation of the last 250 years is not consistent with the observational temperature and dendroclimatically implied evidence of unusual warming that has been experienced in the real world.
7. Conclusions
The spatial coverage represented by our individual regional chronology data represents only a limited part of the northern high-latitude land masses. However, these particular chronologies are constructed in a way that probably represents short and multi-decadal to centennial trends in tree growth with reasonable fidelity. The empirically demonstrated link between this growth variability and local measured instrumental temperature data is patently strong and apparently stable, at least over the last 70–90 years for which station records are available. This supports the interpretation of the 2000-year chronologies in terms of evidence of changing summer temperature variability, and simple analyses of the timing and coincidence of relative warm and cool periods over this time support the conclusion that the twentieth century was unusually warm in each individual region as well as over northwest Eurasia as a whole. Medieval warmth was real in these regions, particularly in Avam–Taimyr. The warmth was widespread but restricted to a relatively narrow period just prior to AD 1000. Assuming that tree growth is driven predominantly by summer temperature changes; these results indicate that the magnitude of medieval warmth in northwest Eurasia did not match that from recent times. Analyses of growth concordance involving data from all of these regions suggest an increasingly high, even unprecedented, agreement in century time-scale warming trends in recent times. These results are superficially consistent with the expected patterns of increasing high-latitude warming suggested by GCM simulations of possible future climates under enhanced atmospheric GHG emissions. However, a simple analysis of one such experiment, under natural and GHG forcing for the last 250 years, while showing consistently increasing concordance between simulated temperatures in the regions of our chronologies, failed to produce results that could be distinguished from the results of a similar experiment driven only with natural (i.e. non-anthropogenic) forcings.
Acknowledgments
K.R.B. and T.M.M. acknowledge support from NERC (NER/T/S/2002/00440) under the Rapid Climate Change Programme. V.V.S. was supported by the Royal Society (UK; Royal Society no. R14577), Russian Foundation for Basic Research (no. 06-05-64095) and a travel grant from the British Council (Moscow, Russia). R.M.H. acknowledges support from the Russian Foundation for Basic Research (no. 07-05-00989). The collection and analysis of the B. Avam data were supported by US National Science Foundation grant no. ATM - 0308525 to Professor Malcolm K. Hughes, University of Arizona. We thank two anonymous reviewers for their helpful comments.
Appendix A. Meteorological data description
Details of the selected meteorological stations for which daily instrumental measurements are available and were used to construct figures 2, 6 and 7. These data were obtained from the Russian Meteorological Service (http://meteo.ru/data_temperat_precipitation/), except for Sodankyla and Jyvaskyla, obtained from the Finnish Meteorological Institute (http://www.fmi.fi), and Abisko obtained from the Swedish Meteorological and Hydrological Institute (http://www.smhi.se). The right-hand columns show the locations of gridded mean monthly temperatures from the CRUTEM3 dataset (Brohan et al. 2006) used to produce figures 1, 6 and 7, obtainable from the Climatic Research Unit (http://www.cru.uea.ac.uk/cru/data/temperature/) (table 2).
Appendix A. Table 2.
| grid box centre | |||||||
|---|---|---|---|---|---|---|---|
|
|
|||||||
| name of station | latitude (° N) | longitude (° E) | start year | end year | (° N) | (° E) | |
| 1 | Abisko | 68.35 | 18.77 | 1913 | 2001 | 57.5 | 2.5 |
| 2 | Jyvaskyla | 62.40 | 25.68 | 1883 | 1998 | 62.5 | 7.5 |
| 3 | Sodankyla | 67.37 | 26.65 | 1908 | 1999 | 62.5 | 12.5 |
| 4 | Murmansk | 69.00 | 33.01 | 1936 | 1992 | 62.5 | 17.5 |
| 5 | Petrozavodsk | 61.06 | 34.04 | 1936 | 1995 | 62.5 | 22.5 |
| 6 | Kem-Port | 65.00 | 34.08 | 1917 | 1993 | 62.5 | 27.5 |
| 7 | Onega | 63.09 | 38.01 | 1936 | 1993 | 62.5 | 32.5 |
| 8 | Kotlas | 61.02 | 46.06 | 1936 | 1993 | 62.5 | 37.5 |
| 9 | Koinas | 64.08 | 47.07 | 1913 | 1992 | 62.5 | 42.5 |
| 10 | Syktyvkar | 61.67 | 50.85 | 1889 | 1993 | 62.5 | 47.5 |
| 11 | Troisko-Priisk | 62.70 | 56.20 | 1914 | 1993 | 62.5 | 52.5 |
| 12 | Hoseda-Hard | 67.08 | 59.38 | 1936 | 1993 | 62.5 | 57.5 |
| 13 | Njayksimvol | 62.43 | 60.87 | 1936 | 1994 | 62.5 | 62.5 |
| 14 | Berezovo | 63.93 | 65.05 | 1936 | 1994 | 62.5 | 67.5 |
| 15 | Hantj-Mansijsk | 60.97 | 69.07 | 1897 | 1994 | 62.5 | 72.5 |
| 16 | Surgut | 61.25 | 73.50 | 1934 | 1983 | 62.5 | 77.5 |
| 17 | Mjs Kammennji | 68.47 | 73.60 | 1951 | 1993 | 57.5 | 82.5 |
| 18 | Alexandrovsk | 60.43 | 77.87 | 1936 | 1994 | 57.5 | 87.5 |
| 19 | Baykjt | 61.67 | 96.37 | 1936 | 1994 | 62.5 | 92.5 |
| 20 | Tura | 64.17 | 100.07 | 1929 | 1994 | 57.5 | 97.5 |
| 21 | Hatanga | 71.98 | 102.47 | 1933 | 1998 | 62.5 | 102.5 |
| 22 | Erbogachen | 61.27 | 108.02 | 1939 | 1994 | 62.5 | 107.5 |
| 23 | Olenek | 68.50 | 112.43 | 1936 | 1994 | 57.5 | 112.5 |
| 24 | Suntar | 62.15 | 117.65 | 1937 | 1994 | 62.5 | 117.5 |
| 25 | Vilujsk | 63.77 | 121.62 | 1899 | 1994 | 62.5 | 122.5 |
| 26 | Zigansk | 66.77 | 123.40 | 1937 | 1994 | 62.5 | 127.5 |
| 27 | Jakutsk | 62.08 | 129.75 | 1895 | 1994 | 62.5 | 132.5 |
| 28 | Verhoyansk | 67.55 | 133.38 | 1900 | 1994 | 57.5 | 137.5 |
| 39 | Ojmyakon | 63.27 | 143.15 | 1943 | 1991 | 62.5 | 142.5 |
| 30 | Chokurdah | 70.62 | 147.88 | 1944 | 1999 | 62.5 | 152.5 |
| 31 | Sejmchan | 62.92 | 152.42 | 1937 | 1994 | 57.5 | 157.5 |
| 32 | Korf | 60.35 | 166.00 | 1930 | 1994 | 57.5 | 162.5 |
| 33 | Markovo | 64.68 | 170.42 | 1895 | 1993 | 62.5 | 167.5 |
| 34 | Anadyr | 64.78 | 177.57 | 1916 | 1994 | 62.5 | 172.5 |
| 35 | 62.5 | 177.5 | |||||
Appendix B. Calculation of Kendall's concordance coefficient
Here we describe the algorithm used to calculate Kendall's (1975) concordance coefficient, modified for use with moving windows. If we have m time series x (xi, where i=1, …, m) each covering a common time period of length t1 to tn years and within this period a window of length W=2k+1 (t−k to t+k centred at time t), these can be represented as follows:
Within the window, it is necessary to replace the values of all time series (the xi) by their rank (ni) where the ranking is the sequence number (nth largest with the range of 1 to 2k+1) and then to calculate the sum of ranks (the n(t) for years from t−k to t+k) for each time period:
Then, it is necessary to calculate S, the sum of squared deviations of the rank sums, the n(t), from the mean of rank sums
Finally, the concordance coefficient, C(t, W), is calculated from
For small window lengths of less than 7 years, a correction is needed where the same values occur in a window, that is, values that have the same rank (Kendall 1975). For a window length greater than 7, the concordance coefficient can be converted to a variable with a Χ2 distribution with W−1 d.f. using the formula =m(W−1)C (Kendall 1975), which then allows for the significance of the calculated value to be estimated.
Footnotes
One contribution of 12 to a Theme Issue ‘The boreal forest and global change’.
References
- Briffa K.R. Annual climate variability in the Holocene: interpreting the message of ancient trees. Quatern. Sci. Rev. 2000;19:87–105. doi: 10.1016/S0277-3791(99)00056-6. [DOI] [Google Scholar]
- Briffa K.R, Jones P.D. Basic chronology statistics and assessment. In: Cook E.R, Kairiukstis L.A, editors. Methods of dendrochronology. Kluwer Academic Publishers; Dordrecht, The Netherlands: 1990. pp. 137–152. [Google Scholar]
- Briffa K.R, Bartholin T.S, Eckstein D, Jones P.D, Karlen W, Schweingruber F.H, Zetterberg P. A 1,400-year tree-ring record of summer temperatures in Fennoscandia. Nature. 1990;346:434–439. doi: 10.1038/346434a0. [DOI] [Google Scholar]
- Briffa K.R, Jones P.D, Bartholin T.S, Eckstein D, Schweingruber F.H, Karlen W, Zetterberg P, Eronen M. Fennoscandian summers from AD-500—temperature-changes on short and long timescales. Clim. Dynam. 1992;7:111–119. [Google Scholar]
- Briffa K.R, Jones P.D, Schweingruber F.H, Osborn T.J. Influence of volcanic eruptions on Northern Hemisphere summer temperature over the past 600 years. Nature. 1998a;393:450–455. doi: 10.1038/30943. [DOI] [Google Scholar]
- Briffa K.R, Schweingruber F.H, Jones P.D, Osborn T.J, Shiyatov S.G, Vaganov E.A. Reduced sensitivity of recent tree-growth to temperature at high northern latitudes. Nature. 1998b;391:678–682. doi: 10.1038/35596. [DOI] [Google Scholar]
- Briffa K.R, Osborn T.J, Schweingruber F.H, Harris I.C, Jones P.D, Shiyatov S.G, Vaganov E.A. Low-frequency temperature variations from a northern tree ring density network. J. Geophys. Res. Atmos. 2001;106:2929–2941. doi: 10.1029/2000JD900617. [DOI] [Google Scholar]
- Briffa K.R, Osborn T.J, Schweingruber F.H, Jones P.D, Shiyatov S.G, Vaganov E.A. Tree-ring width and density data around the Northern Hemisphere: part 2, spatio-temporal variability and associated climate patterns. Holocene. 2002;12:759–789. doi: 10.1191/0959683602hl588rp. [DOI] [Google Scholar]
- Brohan P, Kennedy J.J, Harris I, Tett S.F.B, Jones P.D. Uncertainty estimates in regional and global observed temperature changes: a new data set from 1850. J. Geophys. Res. Atmos. 2006;111:D12106. doi: 10.1029/2005JD006548. [DOI] [Google Scholar]
- Cook E.R, Buckley B.M, Palmer J.G, Fenwick P, Peterson M.J, Boswijk G, Fowler A. Millennia-long tree-ring records from Tasmania and New Zealand: a basis for modelling climate variability and forcing, past, present and future. J. Quatern. Sci. 2006;21:689–699. doi: 10.1002/jqs.1071. [DOI] [Google Scholar]
- D'Arrigo R.D, Kaufmann R.K, Davi N, Jacoby G.C, Laskowski C, Myneni R.B, Cherubini P. Thresholds for warming-induced growth decline at elevational tree line in the Yukon Territory, Canada. Glob. Biogeochem. Cycles. 2004;18:GB3021. doi: 10.1029/2004GB002249. [DOI] [Google Scholar]
- Elsner J.B, Tsonis A.A. Plenum Publishing Corporation; New York, NY: 1996. Singular spectrum analysis: a new tool in time series analysis (language of science) [Google Scholar]
- Eronen M, Zetterberg P, Briffa K.R, Lindholm M, Meriläinen J, Timonen M. The supra-long scots pine tree-ring record for Finnish Lapland: part 1, chronology construction and initial inferences. Holocene. 2002;12:673–680. doi: 10.1191/0959683602hl580rp. [DOI] [Google Scholar]
- Esper J, Frank D.C, Wilson R.J.S, Briffa K.R. Effect of scaling and regression on reconstructed temperature amplitude for the past millennium. Geophys. Res. Lett. 2005;32:L07711. doi: 10.1029/2004GL021236. [DOI] [Google Scholar]
- Grudd H, Briffa K.R, Karlen W, Bartholin T.S, Jones P.D, Kromer B. A 7400-year tree-ring chronology in northern Swedish Lapland: natural climatic variability expressed on annual to millennial timescales. Holocene. 2002;12:657–665. doi: 10.1191/0959683602hl578rp. [DOI] [Google Scholar]
- Hantemirov R.M, Shiyatov S.G. A continuous multimillennial ring-width chronology in Yamal, northwestern Siberia. Holocene. 2002;12:717–726. doi: 10.1191/0959683602hl585rp. [DOI] [Google Scholar]
- Helama S, Lindholm M, Timonen M, Meriläinen J, Eronen M. The supra-long Scots pine tree-ring record for Finnish Lapland: part 2, interannual to centennial variability in summer temperatures for 7500 years. Holocene. 2002;12:681–687. doi: 10.1191/0959683602hl581rp. [DOI] [Google Scholar]
- IPCC 2007 Climate change 2007: the physical science basis. Summary for policymakers. Contribution of working group I to the fourth assessment report of the Intergovernmental Panel on Climate Change. See http://ipcc-wg1.ucar.edu/.
- Jacoby G.C, D'Arrigo R.D. Tree-ring width and density evidence of climatic and potential forest change in Alaska. Glob. Biogeochem. Cycles. 1995;9:227–234. doi: 10.1029/95GB00321. [DOI] [Google Scholar]
- Jacoby G.C, Lovelius N.V, Shumilov O.I, Raspopov O.M, Karbainov J.M, Frank D.C. Long-term temperature trends and tree growth in the Taimyr region of northern Siberia. Quatern. Res. 2000;53:312–318. doi: 10.1006/qres.2000.2130. [DOI] [Google Scholar]
- Kendall M. Griffin; London, UK: 1975. Rank correlation methods. [Google Scholar]
- Kirchhefer A.J. Reconstruction of summer temperatures from tree rings of Scots pine, Pinus silvestris L., in coastal Norway. Holocene. 2001;11:41–52. doi: 10.1191/095968301670181592. [DOI] [Google Scholar]
- Kirdyanov A, Hughes M, Vaganov E, Schweingruber F, Silkin P. The importance of early summer temperature and date of snow melt for tree growth in the Siberian Subarctic. Trees—Struct. Funct. 2003;17:61–69. [Google Scholar]
- Mclain D.H. Drawing contours from arbitrary data points. Comput. J. 1974;17:318–324. [Google Scholar]
- Melvin T.M, Briffa K.R, Nicolussi K, Grabner M. Time-varying-response smoothing. Dendrochronologia. 2007;25:65–69. doi: 10.1016/j.dendro.2007.01.004. [DOI] [Google Scholar]
- Naurzbaev M.M, Vaganov E.A. Variation of early summer and annual temperature in east Taimyr and Putoran (Siberia) over the last two millennia inferred from tree rings. J. Geophys. Res.—Atmos. 2000;105:7317–7326. doi: 10.1029/1999JD901059. [DOI] [Google Scholar]
- Naurzbaev M.M, Vaganov E.A, Sidorova O.V, Schweingruber F.H. Summer temperatures in eastern Taimyr inferred from a 2427-year Late-Holocene tree-ring chronology and earlier floating series. Holocene. 2002;12:727–736. doi: 10.1191/0959683602hl586rp. [DOI] [Google Scholar]
- Nogenkova, L. F., Dmitriev, A. I., Isaev, S. V. & Karev, V. Y. 2000 The development of geoinformation system “Climate History of Siberia”. In Problems of climate and environmental reconstructions of Siberian Holocene and Pleistocene, vol. 2 (ed. E. A. Vaganov), pp. 365–374. Novosibirsk, Russia: Institute of Archaeology and Ethnography. [In Russian.]
- Polyakov I.V, et al. Observationally based assessment of polar amplification of global warming. Geophys. Res. Lett. 2002;29:1878. doi: 10.1029/2001GL011111. [DOI] [Google Scholar]
- Serreze M.C, Francis J.A. The Arctic amplification debate. Clim. Change. 2006;76:241–264. doi: 10.1007/s10584-005-9017-y. [DOI] [Google Scholar]
- Shishov V.V, Ivanovsky A.B. Comparative analysis of moving coefficients in time-series analysis. Vestn. SibSAU, Krasnoyarsk. 2006;2:29–33. [Google Scholar]
- Shishov V.V, Vaganov E.A, Hughes M.K, Koretz M.A. The spatial variability of tree-ring growth in Siberian region during the last century. Dokl. Akad. Nauk. 2002;387:690–693. [Google Scholar]
- Sidorova O.V, Vaganov E.A, Naurzbaev M.M, Shishov V.V, Hughes M.K. Regional features of the radial growth of larch in north central Siberia according to millennial tree-ring chronologies. Russ. J. Ecol. 2007;38:99–103. doi: 10.1134/S106741360702004X. [DOI] [Google Scholar]
- Siegel S, Castellan N.J. 2nd edn. McGraw-Hill; New York, NY: 1988. Nonparametric statistics for behavioral sciences. [Google Scholar]
- Tett S.F.B, et al. The impact of natural and anthropogenic forcings on climate and hydrology since 1550. Clim. Dynam. 2007;28:3–34. doi: 10.1007/s00382-006-0165-1. [DOI] [Google Scholar]
- Trenberth K.E, et al. Observations: surface and atmospheric climate change. In: Solomon S, Qin D, Manning M, Chen Z, Marquis M.C, Averyt K.B, Tignor M, Miller H.L, editors. Climate change 2007: the physical science basis. Contribution of working group 1 to the fourth assessment report of the intergovernmental panel on climate change. Cambridge University Press; Cambridge, UK; New York, NY: 2007. pp. 235–336. [Google Scholar]
- Vaganov E.A, Shiyatov S.G, Mazepa V.S. Nauka; Novosibirsk, Russia: 1996. Dendroclimatic research in Ural–Siberian Subarctic. [Google Scholar]
- Vaganov E.A, Hughes M.K, Kirdyanov A.V, Schweingruber F.H, Silkin P.P. Influence of snowfall and melt timing on tree growth in subarctic Eurasia. Nature. 1999;400:149–151. doi: 10.1038/22087. [DOI] [Google Scholar]
- Vaganov E.A, Briffa K.R, Naurzbaev M.M, Schweingruber F.H, Shiyatov S.G, Shishov V.V. Long-term climatic changes in the Arctic region of the Northern Hemisphere. Dokl. Earth Sci. 2000;375:1314–1317. [Google Scholar]
- Vjsotskaya, G. S., Dmitriev, A. I., Nogenkova, L. F. & Shishov, V. V. 2002 Spatial distribution of climate trends (XX centuries). In Collected articles. Principal regularities of global and regional changes of climate and environment for Late Cainozoe in Siberia, vol. 1 (ed. E. A. Vaganov), pp. 83–87. Novosibirsk, Russia: Institute of Archaeology and Ethnography [In Russian.]
- Wilmking M, Juday G.P, Barber V.A, Zald H.S.J. Recent climate warming forces contrasting growth responses of white spruce at treeline in Alaska through temperature thresholds. Glob. Change Biol. 2004;10:1724–1736. doi: 10.1111/j.1365-2486.2004.00826.x. [DOI] [Google Scholar]
- Zar J.H. 4th edn. Prentice Hall; Upper Saddle River, NJ: 1999. Biostatical analysis. [Google Scholar]


