Abstract
Background
We have used a computational model of the thalamocortical system to investigate the effects of a GABAergic anesthetic (etomidate) on cerebral cortical and thalamic neuronal function. We examined the effects of phasic and tonic inhibition, as well as the relative importance of anesthetic action in the thalamus and cortex.
Methods
The amount of phasic GABAergic inhibition was adjusted in the model to simulate etomidate concentrations of between 0.25 and 2 μM, with the concentration range producing unconsciousness assumed to be between 0.25-0.5 μM. In addition, we modeled tonic inhibition separately, and then phasic and tonic inhibition together. We also introduced phasic and tonic inhibition into the cerebral cortex and thalamus separately to determine the relative importance of each of these structures to anesthetic-induced depression of the thalamocortical system.
Results
Phasic inhibition decreased cortical neuronal firing by 11-18% in the 0.25-0.5 μM range and by 38% at 2 μM. Tonic inhibition produced similar depression (11-21%) in the 0.25-0.5 μM range but 65% depression at 2 μM; phasic and tonic inhibition combined produced the most inhibition (76% depression at 2 μM). When the thalamus and cortex were separately subjected to phasic and tonic inhibition, cortical firing rates decreased less compared to when both structures were targeted. In the 0.25-0.5 μM range, cortical firing rate was minimally affected when etomidate action was simulated in the thalamus only.
Conclusions
This computational model of the thalamocortical system indicated that tonic GABAergic inhibition appears to be more important than phasic GABAergic inhibition (especially at larger etomidate concentrations), although both combined had the most effect on cerebral cortical firing rates. Furthermore, etomidate action in the thalamus, by itself, does not likely explain etomidate-induced unconsciousness.
General anesthesia is characterized by specific end points including unconsciousness, amnesia and immobility.1 The mechanism by which anesthetics produce these end points is not clear. In particular, little is known about how anesthetics produce unconsciousness, and this paucity of knowledge is related to our limited understanding of how consciousness occurs.
Several major issues have been investigated regarding anesthetic-induced unconsciousness, including the brain sites where anesthetics might act. For example, there is controversy related to the importance of the cerebral cortex and subcortical sites, including the thalamus and reticular formation.2-6 In particular, it is unclear to what extent anesthetic-induced unconsciousness is due to anesthetic action in the thalamus as compared to the cerebral cortex.2;4
At the cellular and molecular level, there is also uncertainty about how anesthetics work. Several neurotransmitter systems have been implicated, including the gamma-aminobutyric acid (GABA) and glutamate receptor systems.7 Anesthetics can enhance the action of GABA at its receptor and thereby increase inhibition. This effect has been demonstrated on synaptic receptors to enhance phasic inhibition and also on extrasynaptic receptors to enhance tonic inhibition.8 Specifically, the GABAA receptor seems to be the target of etomidate and propofol, as mutation of the beta-3 subunit renders mice resistant to these anesthetics,9 although, depending on the specific anesthetic end point (e.g., sedation versus immobility), different subunits may be involved.10
We sought to address these issues using a computer model of the thalamocortical system which has provided insights into mechanisms of waking and sleeping.11 We separately introduced phasic and tonic inhibition to determine the importance of each to thalamocortical depression. We hypothesized that tonic inhibition, as compared to phasic inhibition, would have a stronger inhibitory effect on the thalamocortical system. We also separately introduced GABAergic anesthetic effects into the cortex and then into the thalamus to determine whether action at either was more important than the other.
Methods
We used the thalamocortical model developed by Hill and Tononi11 (www.synthesis-simulator.com, last accessed April 9, 2008). In brief, this model of the thalamus and the visual cortex contains more than 64,000 neurons and more than 4 million connections. There is a primary visual cortex and a secondary visual cortex, as well as primary and secondary sections of the thalamus along with associated areas of the thalamic reticular nucleus. The primary visual cortex is represented by an 8 mm2 cortical section. The cortical sections contain 3 layers (supragranular layer, layer IV and infragranular layer), and there are excitatory and inhibitory neurons in each. The model approximates the thalamocortical, corticothalamic, intrathalamic and cortico-cortical connections found in vivo. There are neuromodulatory factors that represent activating influences, such as the cholinergic input from the basal forebrain and serotoninergic input from the brainstem. Model neurons are a cross of integrate-and-fire and Hodgkin-Huxley neurons. Synaptic channel currents are represented by (alpha-amino-3-hydroxy-5-methyl-4-isoxazole propionic acid) AMPA, GABAA, GABAB, and N-methyl-D-aspartate; the peak current and decay are modifiable. The intrinsic currents include a hyperpolarization-activated cation current, Ih; low threshold calcium current, IT; depolarization-dependent potassium current, IDK; persistent sodium current, INa(p); and potassium leak current, IKL.
The model ran on a Macintosh laptop computer and the data were analyzed using MATLAB Version 7.5.0.342 Release 2007b (Lowell, MA). From different initial states, we performed 4 computer simulations for each variable tested and compared the results of the awake state to those from simulated etomidate concentrations of 0.25, 0.5, 0.75, 1.0, 1.5, and 2.0 μM. We generated 6 seconds of data for each simulation, however, because the model usually takes 500-750 msec to stabilize, we used only the last 5 sec of data. Each computer simulation took approximately 3 hours to run.
We chose to model the actions of etomidate as there is clear evidence that etomidate acts primarily at the GABAA receptor.9 GABA receptors in the model are represented by the inhibitory currents that they produce when GABAergic action occurs. We changed the phasic component of GABAA by altering the decay of the GABAA current based on published data.12-14 Loss of consciousness with etomidate occurs at around 0.4 μM, so we designated the 0.25-to-0.5 μM transition as the point when unconsciousness occurs.15 Because etomidate diffuses slowly into tissue slices,15 we obtained data from articles in which etomidate was either allowed sufficient time to diffuse into a slice preparation or in which neuron cultures were used (in which case diffusion distance was not a factor). To simulate waking, the model normally has a GABAA-mediated current decay of 7 ms;11 this was increased to simulate the actions of various free-drug concentrations of etomidate. We compared changes in decay versus etomidate concentration from the articles12-14 and developed a linear regression model to determine that decay was increased by approximately 12, 23, 45, 67 and 180% at etomidate concentrations of 0.25, 0.5, 0.75, 1 and 2 μM. Furthermore, because peak current flow from GABAA receptor opening increases around 5% on average (for the etomidate concentration range 0-2 μM), we also introduced this when modeling the GABAA current.
Etomidate also enhances tonic inhibition which is due to actions at extrasynaptic GABAA receptors and is associated with a continuous hyperpolarizing inhibitory current.12;14 We modeled this by introducing a tonic inhibitory current, reported by Drasbek et al.14, into all neurons except those in the reticular nucleus of the thalamus, which has been shown to not have tonic inhibition.16 We assumed a cell surface area of 15,000 μm2, which permitted converting the currents recorded in vitro to be applied to model neurons.17
We also determined the importance of regional etomidate action by introducing phasic and tonic changes in the thalamic and cortical neurons separately. In addition, we simulated anesthetic action in the reticular activating system of the brainstem by changing the neuromodulatory influence on thalamic and cortical neurons, which was primarily produced by increasing potassium leak reflecting decreased neuromodulation by acetylcholine.11
Data were analyzed in MATLAB by calculating the average neuronal firing rate in cortex and thalamus. We simulated the electrocorticogram (ECoG) by taking all inhibitory currents from a superficial layer, an infragranular layer and an L4 layer in Vp (the primary visual area) and subtracted these from all excitatory currents from those layers. That value was then multiplied by a constant based on the size of the area being recorded. This constant produces a value that is roughly appropriate for a local field potential recording (see appendix for more detail). We derived the spectral edge frequency (SEF), median edge frequency (MEF) and total power from the raw ECoG using a custom program developed in MATLAB. In addition, we compared the ECoGs using a power spectral analysis (power vs. frequency). The SEF represents the frequency that captures 95% of the ECoG power under the power spectrum curve, whereas the MEF represents 50% of the ECoG power under the power spectrum curve.
We compared changes in neuronal firing rate, MEF, SEF and total power using repeated measures analysis of variance to determine statistical significance. A p<0.05 was considered significant.
Results
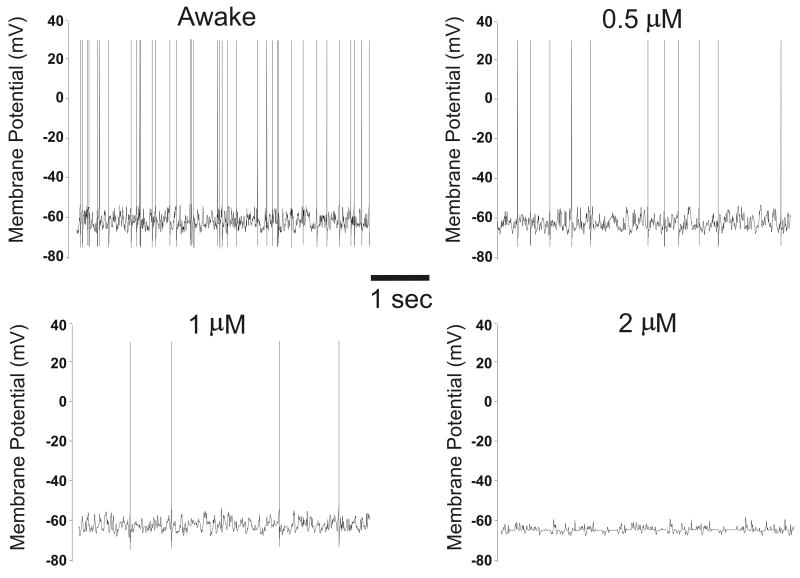
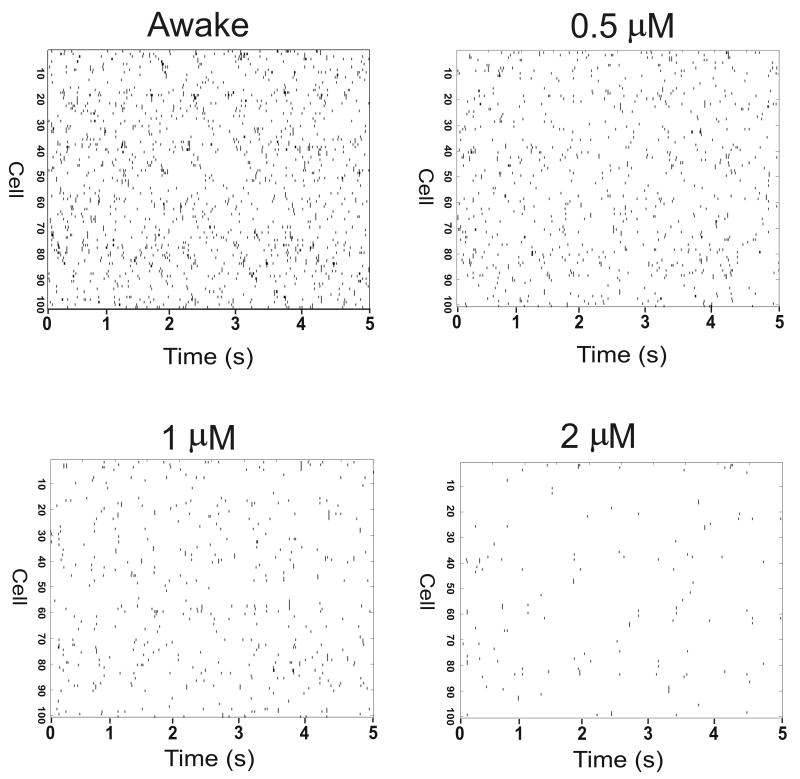
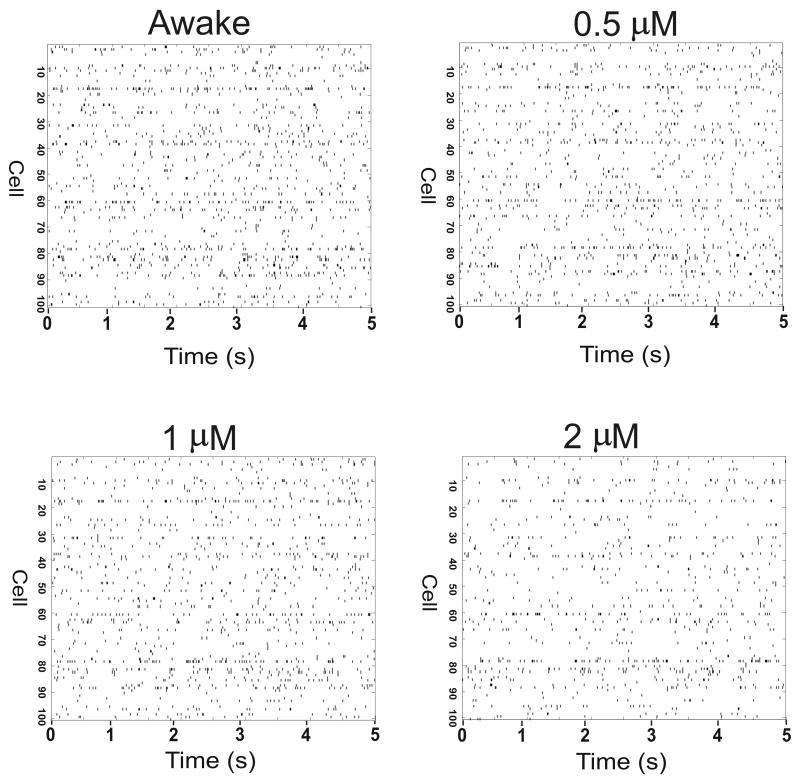
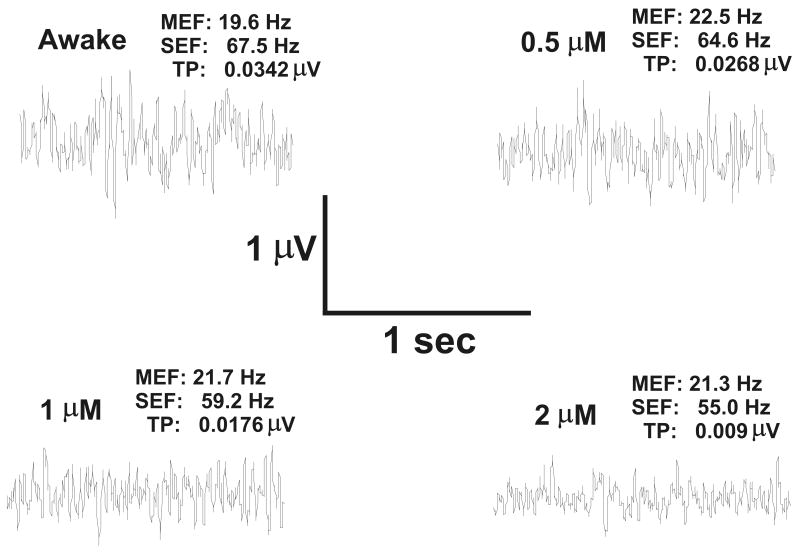
With each parameter change, simulations were reproducible from run to run. Simulations of intracellular recordings produced appropriate action potentials with varying membrane potentials consistent with continuing synaptic activity (Figure 1). The number of action potentials decreased when the GABAergic action of etomidate was introduced into the model (Figures 1 and 2). Thalamic firing rate was less affected by simulating etomidate anesthesia (Figure 3). An example of the ECoG (Figure 4) demonstrates decreased amplitude (total power) and a slight shift to lower frequencies with simulated etomidate anesthesia.
Figure 1.
Simulated action potentials. Membrane potential (mV) is plotted versus time for a cortical neuron (supragranular layer) during waking and at 0.5 μM, 1 μM and 2 μM etomidate; 5 sec tracings are shown. When the threshold membrane potential is reached, an action potential occurs. Note the variability of the resting membrane potential, which reflects continuing synaptic activity resulting in excitatory and inhibitory post-synaptic potentials; in particular, at 1 μM and 2 μM etomidate there is decreased variability of the membrane potential, indicating decreased synaptic activity.
Figure 2.
Effect of etomidate on firing rate of cortical neurons. Raster plots of timing of action potentials are shown for 100 neurons during waking and at 0.5 μM, 1 μM and 2 μM etomidate. Etomidate action was modeled using phasic and tonic inhibition. Note that increasing etomidate concentration results in decreased number of cortical neuronal action potentials.
Figure 3.
Effect of etomidate on firing rate of thalamic neurons. Raster plots of timing of action potentials are shown for 100 neurons during waking and at 0.5 μM, 1 μM and 2 μM etomidate. Etomidate action was modeled using phasic and tonic inhibition. Note that increasing etomidate concentration results in decreased number of thalamic neuronal action potentials, although the thalamic firing rate was less affected than cortical firing rate (Figure 2).
Figure 4.
Effect of etomidate on the electrocortigogram (ECoG). The ECoG is shown for waking and at 0.5 μM, 1 μM and 2 μM etomidate. Etomidate action was modeled using phasic and tonic inhibition. Note that increasing etomidate concentration results in decreased spectral edge frequency (SEF), decreased total power (TP) and little change in median edge frequency (MEF).
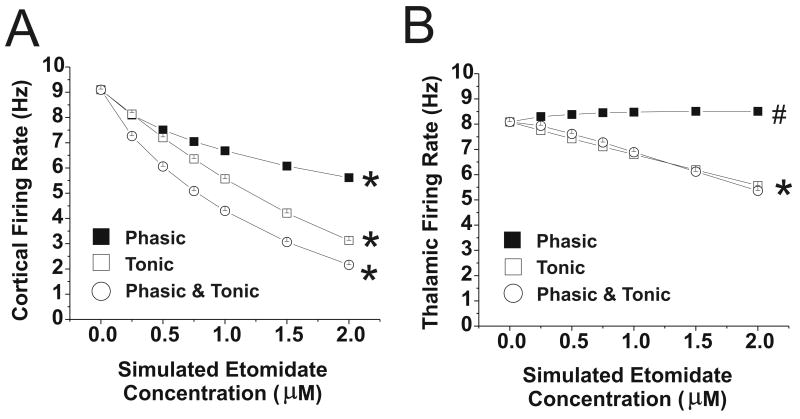
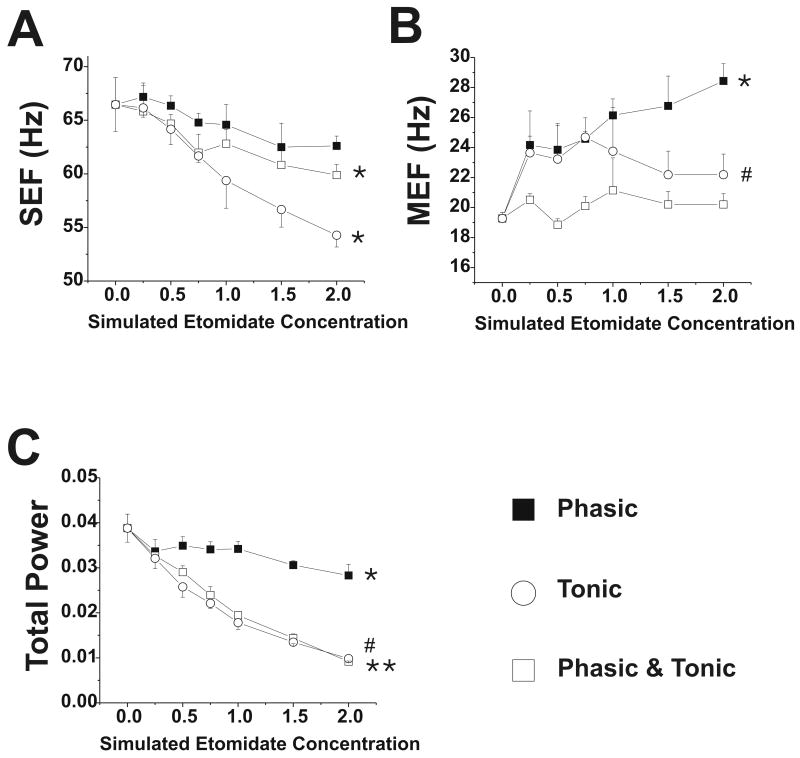
Changing the phasic GABAergic input to simulate the effect of etomidate 0.25-2 μM resulted in a decrease in cortical firing to 62% of control at the simulated 2μM concentration (Figure 5A). In the concentration range that produces unconsciousness (0.25-0.5 μM), cortical firing decreased to approximately 85% of control. The firing rate of both excitatory and inhibitory thalamic neurons was slightly increased (5%) by phasic GABAergic inhibition (Figure 5B), however, the firing rate of reticular neurons decreased (data not shown). The MEF of the ECoG increased with phasic inhibition, whereas the total power decreased slightly (Figure 6).
Figure 5.
Cortical and Thalamic Firing rates with changes in GABAergic input with etomidate. Data are shown for phasic or tonic GABAergic inhibition (or both), applied to thalamus and cortex at simulated etomidate concentrations 0-2 μM. (A) Cortical firing rate; *=values at each etomidate concentration different from all other values, p<0.001. (B) Thalamic firing rate; *=Phasic and combined Phasic and Tonic values at each etomidate concentration different from all other values, p<0.001; # =values at each etomidate concentration different from all other values, p<0.05, except that value at 1 μM is not significantly different from value at 2 μM. Note that when only phasic inhibition is applied thalamic firing rate increases slightly.
Figure 6.
Electrocorticogram parameters with changes in GABAergic input with etomidate. Data are shown for phasic, tonic and combined phasic and tonic GABAergic inhibition at simulated etomidate concentrations 0-2 μM. (A) Spectral edge frequency, SEF; * = p<0.05 for values at 0.75-2 μM compared to awake value; (B) Median edge frequency, MEF; * = p<0.05 for values at 0.25-2 μM compared to awake value; # = p<0.05 for 0.75 μM value compared to awake value (C) Total power; *, #, ** = p<0.05, p<0.01 and p<0.001 for values at 0.25-2 μM compared to awake value.
Tonic inhibition also decreased cortical firing, although to a greater extent than phasic inhibition (Figure 5). At 2 μM, cortical firing rate was 35% of control, and in the 0.25-0.5 μM transition, it was at 85% of control. Thalamic firing rate decreased, with both excitatory and inhibitory neurons equally depressed by tonic inhibition. MEF was minimally affected by tonic inhibition, although SEF and total power decreased (Figure 6).
Phasic and tonic inhibition combined produced similar, but more pronounced, changes compared to either alone (Figure 5). For example, at a simulated etomidate concentration of 2 μM, cortical firing rate was 25% of control, and in the 0.25-0.5 μM transition, it was at 73% of control. The SEF and total power decreased with combined phasic and tonic inhibition; however, MEF was unchanged (Figure 6).
Cortical and thalamic firing rates in waking state and with combined phasic and tonic inhibition are shown in Table 1 for the various cortical layers and thalamic neurons. The variability of the average firing rate of neurons across simulations was low (Table 1), but in fact individual neuronal firing rate was variable. For example, in a simulation of waking, the firing rates of excitatory neurons in the supragranular layer, infragranular layer, layer 4 and thalamus were 2.87 ± 2.19 Hz, 6.37 ± 4.67 Hz, 5.57 ± 4.63 Hz and 10.44 ± 12.11 Hz, respectively.
Table 1.
Cortical and Thalamic firing rates (Hz) during combined phasic and tonic GABAergic inhibition
| Etomidate | Layer 4 Exc | Layer 4 Inh | Infragran Exc | Infragran Inh | Supragran Exc | Supragran Inh | NRT | Thalamic Exc | Thalamic Inh |
|---|---|---|---|---|---|---|---|---|---|
| 0 | 5.6 ± 0.02 | 13.90 ± 0.03 | 6.4 ± 0.03 | 13.78 ± 0.02 | 2.85 ± 0.04 | 12.07 ± 0.05 | 3.63 ± 0.02 | 10.57 ± 0.02 | 5.60 ± 0.01 |
| 0.25 | 4.38 ± 0.02 | 11.85 ± 0.01 | 5.31 ± 0.01 | 11.77 ± 0.02 | 1.63 ± 0.02 | 8.64 ± 0.03 | 2.70 ± 0.02 | 10.40 ± 0.03 | 5.47 ± 0.02 |
| 0.5 | 3.62 ± 0.02 | 10.33 ± 0.02 | 4.52 ± 0.02 | 10.29 ± 0.02 | 1.02 ± 0.01 | 6.55 ± 0.05 | 2.16 ± 0.01 | 9.96 ± 0.01 | 5.27 ± 0.01 |
| 0.75 | 3.01 ± 0.01 | 9.07 ± 0.02 | 3.83 ± 0.01 | 9.04 ± 0.02 | 0.63 ± 0.02 | 4.95 ± 0.01 | 1.76 ± 0.01 | 9.51 ± 0.04 | 5.04 ± 0.01 |
| 1 | 2.51 ± 0.02 | 7.97 ± 0.02 | 3.27 ± 0.01 | 7.92 ± 0.02 | 0.39 ± 0.01 | 3.75 ± 0.01 | 1.45 ± 0.01 | 8.98 ± 0.02 | 4.79 ± 0.03 |
| 1.5 | 1.75 ± 0.01 | 6.12 ± 0.01 | 2.32 ± 0.01 | 6.07 ± 0.01 | 0.13 ± 0.01 | 2.03 ± 0.02 | 0.98 ± 0.01 | 7.94 ± 0.01 | 4.30 ± 0.02 |
| 2 | 1.17 ± 0.01 | 4.64 ± 0.01 | 1.58 ± 0.02 | 4.58 ± 0.01 | 0.04 ± 0.01 | 0.96 ± 0.02 | 0.64 ± 0.01 | 6.90 ± 0.01 | 3.82 ± 0.01 |
Data (impulses/sec, Hz) are expressed as grand mean, standard deviation (from 4 simulations) of the mean firing rate of 1600 neurons in each cortical layer and thalamus, except for 900 neurons in NRT. Simulated etomidate concentrations are μM. Exc = excitatory; Inh = inhibitory; Infragran = infragranular layer; Supragran = supragranular layer; NRT= reticular nucleus.
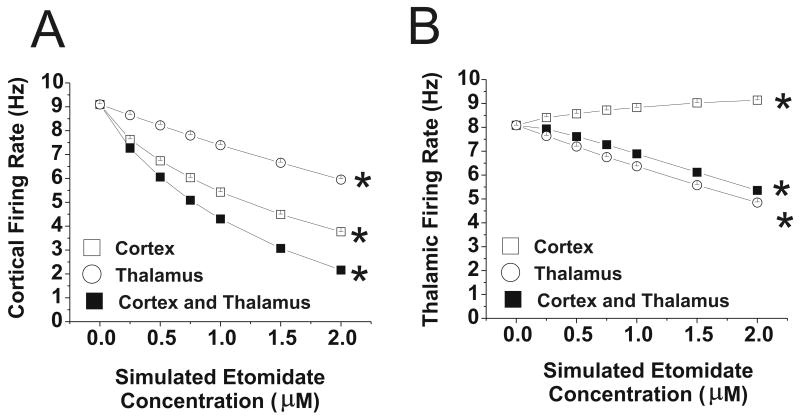
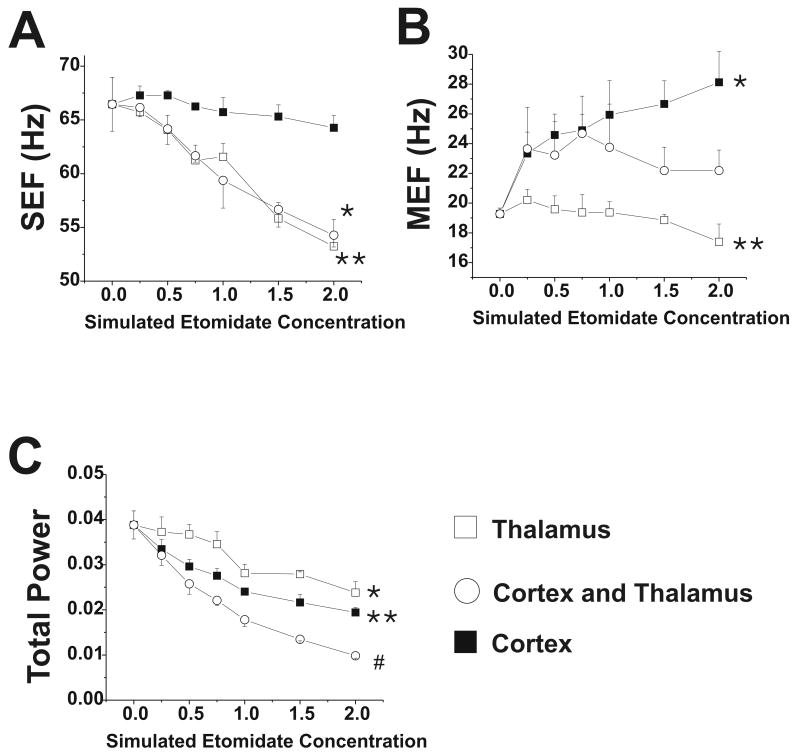
Cortical firing rates decreased when GABAergic changes were introduced into the cortex and thalamus separately (Figure 7), although the changes in firing rate were less than those observed when both cortex and thalamus received increased GABAergic input. Thalamic firing rate increased slightly when only the cortex was targeted, whereas it decreased when only the thalamus was targeted or when both thalamus and cortex were targeted. The MEF increased when the cortex was targeted, whereas the SEF was relatively unaffected (Figure 8). When the thalamus was targeted, MEF increased slightly but SEF decreased, whereas total power decreased when the thalamus and cortex were separately targeted (Figure 8). In the 0-0.5 μM range, however, the neuronal firing rate and ECoG parameters changed little when the thalamus was targeted. When etomidate action was simulated in the reticular formation of the brainstem, in addition to the cortex and thalamus, cortical and thalamic firing rates were markedly depressed, to 32% and 34% of control at 0.25 μM, respectively, and to 9% and 11% of control at 0.5 μM (data are from 1-2 simulations at each etomidate concentration).
Figure 7.
Cortical and thalamic firing rates with changes in GABAergic input with etomidate. Data are shown for phasic and tonic GABAergic inhibition applied to thalamus alone, cortex alone, or both at simulated etomidate concentrations 0-2 μM. (A) Cortical firing rate; *=values at each etomidate concentration different from all other values, p<0.001. (B) Thalamic firing rate; *=values at each etomidate concentration different from all other values, p<0.001. Note that when GABAergic inhibition is applied only to the cortex, thalamic firing rate increases slightly.
Figure 8.
Electrocorticogram parameters with changes in GABAergic input with etomidate. Data are shown for phasic and tonic GABAergic inhibition applied to thalamus alone, cortex alone, or both at simulated etomidate concentrations 0-2 μM. (A) Spectral edge frequency, SEF; *, ** = p<0.05 for values at 0.75-2 μM compared to awake value; (B) Median edge frequency, MEF; * = p<0.001 for values at 0.25-2 μM compared to awake value; ** = p<0.01 for 2 μM value compared to awake value; (C) Total power; * = p<0.001 for values at 1-2 μM compared to awake value; #, ** = p<0.001 for values at 0.25-2 μM compared to awake value.
Discussion
There were 4 primary findings of this study. First, in silico modifications of GABA conductance at the GABAA receptor led to decreased cortical firing rates as has been observed in vivo with volatile anesthetics.2 Second, the electroencephalogram (EEG) data from the in silico modifications of GABAergic conductance demonstrate decreases in the SEF, which is consistent with published data. Third, modifications of GABAergic conductance at the GABAA receptor in silico suggest that the neocortex, as compared to the thalamus, has the most pronounced effect on cortical firing rate, although the most pronounced effect occurs if modifications are made to GABA conductance in both the cortex and the thalamus. Fourth, the contribution of perisynaptic and extrasynaptic GABAA receptors underlying tonic inhibition appear to account for the greatest effect on depressed cortical neuronal firing. Increased decay time of synaptic GABAA receptors, accounting for phasic inhibition, also decreases cortical neuronal firing, but to a lesser degree than tonic inhibition. When the effect of tonic and phasic inhibition were combined, the neuronal firing rates were lower than those from each change alone, but the majority of the effect was due to tonic inhibition.
We chose to explore the roles of phasic and tonic inhibition because it is unclear to what extent each of these affects neuronal activity. The former occurs when a drug, such as etomidate, either prolongs the recovery half-time of the phasic inhibition produced when GABA binds to the GABAA receptor or increases the peak inhibitory conductance or both.12 Tonic inhibition occurs when GABA binds to extrasynaptic receptors which produces a continuous tonic inhibitory current,12 and this, of course, depends on GABA release and turnover. Both phasic and tonic inhibition will hyperpolarize the neuronal membrane. In our model, tonic inhibition, as compared to phasic inhibition, had a more pronounced effect on neuronal firing rate, and both combined produced an additive inhibitory effect.
There is controversy regarding cortical versus subcortical sites of anesthetic action. Hentshcke et al. recorded neuronal firing in intact rats and in cortical cultured slices and found that inhaled anesthetics, such as halothane and isoflurane, produced the same amount of neuronal depression.2 They concluded that, because the cultured slices had no subcortical input, the equally depressive effects of the anesthetics in vivo and in vitro argue for a cortical site of action. However, there are numerous imaging studies showing that anesthetics, including both volatile and IV anesthetics, depress subcortical structures such as the thalamus and reticular formation.3,18,19 Interestingly, very little work has been published regarding how anesthetics affect neuronal firing in thalamus, reticular formation of the brainstem and cortex in the transition from consciousness to unconsciousness. This is due in large part to the need for a chronic preparation that permits recording from awake animals and during and after the transition to anesthetic-induced unconsciousness. In our model, when etomidate action was introduced into the thalamus only, cortical firing rate and the ECoG changed little in the 0-0.5 μM range. These data suggest that etomidate action in the thalamus, by itself, does not likely explain how etomidate produces unconsciousness. Furthermore, although we found that simulating anesthetic action in the brainstem reticular formation, cortex and thalamus combined produced the most neuronal depression, we hasten to point out that simulating anesthetic action in the reticular formation was primarily accomplished by altering potassium leak current, which has a profound effect on the model.
When only phasic GABAergic inhibition was applied the MEF increased (Figure 6), indicating a shift of the ECoG to higher frequencies. It is noteworthy that benzodiazepines, such as midazolam, have been found in some studies to shift the EEG to higher frequencies.20;21 This could be because benzodiazepines appear to produce only phasic inhibition and have little or no effect on tonic inhibition,16 although this finding is not universal.8
Our model is a simplification of the thalamocortical system and, like any model, has limitations. We have made assumptions regarding the amount of tonic inhibition produced by a given etomidate concentration. By necessity, we made assumptions regarding neuronal cell size and membrane resistance that were required to calculate how much tonic inhibition to apply to the model. We cannot exclude the possibility that our range of tonic inhibition does not reflect what actually occurs in vivo. While we based our assumptions on data from the literature (as we did with phasic inhibition), we might have under-estimated or over-estimated the relative amounts of phasic and tonic inhibition. Changing the phasic and tonic inhibition resulted in decreased total power of the simulated EcoG; however, in humans and animals, GABAergic anesthetics, such as propofol and etomidate, cause increased total power in that they produce large amplitude, low frequency EEG patterns.22 When simulating sleep, initiation and maintenance of the up state requires increased glutamatergic input via the N-methyl-D-aspartate receptor,11 although many anesthetics decrease glutamatergic input.7 Furthermore, we simulated only a small portion of the cerebral cortex and thalamus and it is possible that anesthetics might produce high amplitude EEG waves by affecting communication among widely spread parts of the thalamocortical system. The model is based on the visual cortex and thalamus, so it is possible that the differences in the visual thalamocortical system (compared to other brain areas, such as the frontal cortex) might have influenced the results. We also point out that the model, although originally constructed to simulate waking and sleep, is robust and is also able to simulate seizure-like activity. Thus, the model is not biased towards simulating sleep. Lastly, as with any model of this complexity, a large number of combinations are possible with regard to changes in different parameters: we tested only a small fraction of these combinations. We cannot exclude the possibility that we did not examine a combination that would best describe what occurs in vivo.
In summary, we used a computational model to simulate the action of a GABAergic anesthetic, such as etomidate on the thalamocortical system. We found that phasic and tonic inhibition both contribute to depression of the cerebral cortical and thalamic neurons, although tonic inhibition appears to be more important. Furthermore, anesthetic action in the thalamus alone, without action in the cerebral cortex or reticular activating system, appears unlikely to be solely responsible for producing anesthetic-induced unconsciousness.
Appendix
Electrical fields of the brain are believed to reflect, to a large extent, postsynaptic currents in pyramidal cells according to the equation:
where Vext is the extracellular potential, Re (230 Ωcm) is the extracellular resistivity, Ij is the postsynaptic current, and rj is the distance from synaptic activity Ij to the recording site.23 For all cells, we set rj to the mean distance between all neurons and the center of the network (0.35 cm) so as not to bias the recording towards specific cells. While our model uses single compartment neurons, inhibitory synapses in vivo are typically directed to the soma of pyramidal neurons, producing a flow of negative ions into the soma and leading to a current source at the cortical surface. Excitatory synapses instead are typically targeted towards the dendrites of pyramidal neurons, which often run towards the cortical surface, producing a current source near the cortical surface. Therefore, we reversed the sign of inhibitory currents before summing them in the above equation.
Acknowledgments
Supported in part by NIH GM57970, 61283 and 47818
Footnotes
Implications Statement: Computer simulation of etomidate action on the thalamocortical system revealed that GABAergic tonic inhibition, as compared to phasic inhibition, had greater depressant effects on cerebral cortical neuronal function. Furthermore, GABAergic anesthetic action in the thalamus alone does not likely explain how etomidate produces unconsciousness.
Reference List
- 1.Antognini JF, Carstens E. In vivo characterization of clinical anaesthesia and its components. Br J Anaesth. 2002;89:156–66. doi: 10.1093/bja/aef156. [DOI] [PubMed] [Google Scholar]
- 2.Hentschke H, Schwarz C, Antkowiak B. Neocortex is the major target of sedative concentrations of volatile anaesthetics: strong depression of firing rates and increase of GABAA receptor-mediated inhibition. Eur J Neurosci. 2005;21:93–102. doi: 10.1111/j.1460-9568.2004.03843.x. [DOI] [PubMed] [Google Scholar]
- 3.Alkire MT, Haier RJ, Barker SJ, Shah NK, Wu JC, Kao YJ. Cerebral metabolism during propofol anesthesia in humans studied with positron emission tomography. Anesthesiology. 1995;82:393–403. doi: 10.1097/00000542-199502000-00010. [DOI] [PubMed] [Google Scholar]
- 4.Fiset P, Paus T, Daloze T, Plourde G, Meuret P, Bonhomme V, Hajj-Ali N, Backman SB, Evans AC. Brain mechanisms of propofol-induced loss of consciousness in humans: a positron emission tomographic study. J Neurosci. 1999;19:5506–13. doi: 10.1523/JNEUROSCI.19-13-05506.1999. [DOI] [PMC free article] [PubMed] [Google Scholar]
- 5.Folkman J, Mark VH, Ervin F, Suematsu K, Hagiwara R. Intracerebral gas anesthesia by diffusion through silicone rubber. Anesthesiology. 1968;29:419–25. doi: 10.1097/00000542-196805000-00007. [DOI] [PubMed] [Google Scholar]
- 6.Devor M, Zalkind V. Reversible analgesia, atonia, and loss of consciousness on bilateral intracerebral microinjection of pentobarbital. Pain. 2001;94:101–12. doi: 10.1016/S0304-3959(01)00345-1. [DOI] [PubMed] [Google Scholar]
- 7.Krasowski MD, Harrison NL. General anaesthetic actions on ligand-gated ion channels. Cell Mol Life Sci. 1999;55:1278–303. doi: 10.1007/s000180050371. [DOI] [PMC free article] [PubMed] [Google Scholar]
- 8.Bai D, Zhu G, Pennefather P, Jackson MF, MacDonald JF, Orser BA. Distinct functional and pharmacological properties of tonic and quantal inhibitory postsynaptic currents mediated by gamma-aminobutyric acid(A) receptors in hippocampal neurons. Mol Pharmacol. 2001;59:814–24. doi: 10.1124/mol.59.4.814. [DOI] [PubMed] [Google Scholar]
- 9.Jurd R, Arras M, Lambert S, Drexler B, Siegwart R, Crestani F, Zaugg M, Vogt KE, Ledermann B, Antkowiak B, Rudolph U. General anesthetic actions in vivo strongly attenuated by a point mutation in the GABA(A) receptor beta3 subunit. FASEB J. 2003;17:250–2. doi: 10.1096/fj.02-0611fje. [DOI] [PubMed] [Google Scholar]
- 10.Reynolds DS, Rosahl TW, Cirone J, O'Meara GF, Haythornthwaite A, Newman RJ, Myers J, Sur C, Howell O, Rutter AR, Atack J, Macaulay AJ, Hadingham KL, Hutson PH, Belelli D, Lambert JJ, Dawson GR, McKernan R, Whiting PJ, Wafford KA. Sedation and anesthesia mediated by distinct GABA(A) receptor isoforms. J Neurosci. 2003;23:8608–17. doi: 10.1523/JNEUROSCI.23-24-08608.2003. [DOI] [PMC free article] [PubMed] [Google Scholar]
- 11.Hill S, Tononi G. Modeling sleep and wakefulness in the thalamocortical system. J Neurophysiol. 2005;93:1671–98. doi: 10.1152/jn.00915.2004. [DOI] [PubMed] [Google Scholar]
- 12.Cheng VY, Martin LJ, Elliott EM, Kim JH, Mount HT, Taverna FA, Roder JC, MacDonald JF, Bhambri A, Collinson N, Wafford KA, Orser BA. Alpha5GABAA receptors mediate the amnestic but not sedative-hypnotic effects of the general anesthetic etomidate. J Neurosci. 2006;26:3713–20. doi: 10.1523/JNEUROSCI.5024-05.2006. [DOI] [PMC free article] [PubMed] [Google Scholar]
- 13.Belelli D, Peden DR, Rosahl TW, Wafford KA, Lambert JJ. Extrasynaptic GABAA receptors of thalamocortical neurons: a molecular target for hypnotics. J Neurosci. 2005;25:11513–20. doi: 10.1523/JNEUROSCI.2679-05.2005. [DOI] [PMC free article] [PubMed] [Google Scholar]
- 14.Drasbek KR, Hoestgaard-Jensen K, Jensen K. Modulation of extrasynaptic THIP conductances by GABAA-receptor modulators in mouse neocortex. J Neurophysiol. 2007;97:2293–300. doi: 10.1152/jn.00651.2006. [DOI] [PubMed] [Google Scholar]
- 15.Benkwitz C, Liao M, Laster MJ, Sonner JM, Eger EI, Pearce RA. Determination of the EC50 amnesic concentration of etomidate and its diffusion profile in brain tissue: implications for in vitro studies. Anesthesiology. 2007;106:114–23. doi: 10.1097/00000542-200701000-00020. [DOI] [PubMed] [Google Scholar]
- 16.Jia F, Pignataro L, Schofield CM, Yue M, Harrison NL, Goldstein PA. An extrasynaptic GABAA receptor mediates tonic inhibition in thalamic VB neurons. J Neurophysiol. 2005;94:4491–501. doi: 10.1152/jn.00421.2005. [DOI] [PubMed] [Google Scholar]
- 17.Turner DA, Schwartzkroin PA. Electrical characteristics of dendrites and dendritic spines in intracellularly stained CA3 and dentate hippocampal neurons. J Neurosci. 1983;3:2381–94. doi: 10.1523/JNEUROSCI.03-11-02381.1983. [DOI] [PMC free article] [PubMed] [Google Scholar]
- 18.Alkire MT, Pomfrett CJ, Haier RJ, Gianzero MV, Chan CM, Jacobsen BP, Fallon JH. Functional brain imaging during anesthesia in humans: effects of halothane on global and regional cerebral glucose metabolism. Anesthesiology. 1999;90:701–9. doi: 10.1097/00000542-199903000-00011. [DOI] [PubMed] [Google Scholar]
- 19.Antognini JF, Buonocore MH, Disbrow EA, Carstens E. Isoflurane anesthesia blunts cerebral responses to noxious and innocuous stimuli: a fMRI study. Life Sci. 1997;61:PL 349–PL 354. doi: 10.1016/s0024-3205(97)00960-0. [DOI] [PubMed] [Google Scholar]
- 20.Kuizenga K, Wierda JM, Kalkman CJ. Biphasic EEG changes in relation to loss of consciousness during induction with thiopental, propofol, etomidate, midazolam or sevoflurane. Br J Anaesth. 2001;86:354–60. doi: 10.1093/bja/86.3.354. [DOI] [PubMed] [Google Scholar]
- 21.Billard V, Gambus PL, Chamoun N, Stanski DR, Shafer SL. A comparison of spectral edge, delta power, and bispectral index as EEG measures of alfentanil, propofol, and midazolam drug effect. Clin Pharmacol Ther. 1997;61:45–58. doi: 10.1016/S0009-9236(97)90181-8. [DOI] [PubMed] [Google Scholar]
- 22.Jellish WS, Riche H, Salord F, Ravussin P, Tempelhoff R. Etomidate and thiopental-based anesthetic induction: comparisons between different titrated levels of electrophysiologic cortical depression and response to laryngoscopy. J Clin Anesth. 1997;9:36–41. doi: 10.1016/S0952-8180(96)00211-5. [DOI] [PubMed] [Google Scholar]
- 23.Nunez PL, Srinivasan R. Electric fields of the brain: the neurophysics of EEG. 2nd. Oxford: Oxford University Press; 2006. [Google Scholar]


