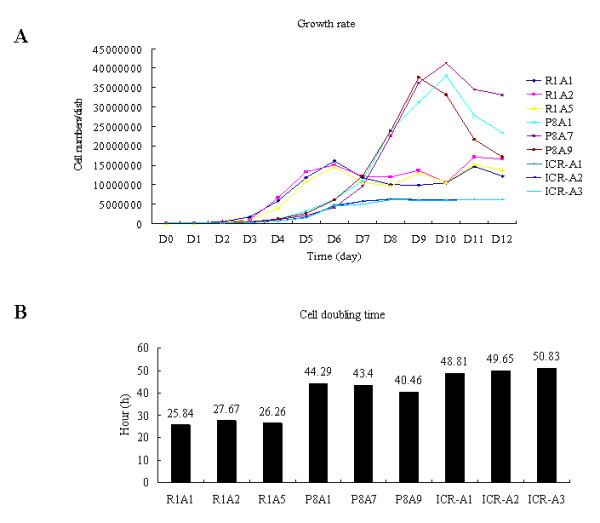
Figure 9.

The difference in growth rates of R1A, P8A and ICR-A cell lines. (A) Comparison of the growth rates of R1A, P8A, and ICR-A cell lines. (B) Representative doubling times of each cell line. Proliferation time was estimated from the growth rate of each cell line. The numbers above each column represent the doubling time in hours of each cell line.
