Abstract
The Hodgkin and Huxley (HH) model predicts sustained repetitive firing of nerve action potentials for a suprathreshold depolarizing current pulse for as long as the pulse is applied (type 2 excitability). Squid giant axons, the preparation for which the model was intended, fire only once at the beginning of the pulse (type 3 behaviour). This discrepancy between the theory and experiments can be removed by modifying a single parameter in the HH equations for the K+ current as determined from the analysis in this paper. K+ currents in general have been described by IK=gK(V−EK), where gK is the membrane's K+ current conductance and EK is the K+ Nernst potential. However, IK has a nonlinear dependence on (V−EK) well described by the Goldman–Hodgkin–Katz equation that determines the voltage dependence of gK. This experimental finding is the basis for the modification in the HH equations describing type 3 behaviour. Our analysis may have broad significance given the use of IK=gK(V−EK) to describe K+ currents in a wide variety of biological preparations.
Keywords: nerve, squid axons, ion channel gating, neuronal excitability
1. Introduction
In 1948, Alan Hodgkin described three classes or types of axonal excitability in experiments on crustacean nerves using constant current stimuli (Hodgkin 1948). Axons having type 1 excitability fired repetitively with a frequency that depended markedly on stimulus intensity. Type 2 axons also fired repetitively once a threshold had been crossed but with a frequency that depended relatively little on stimulus intensity. Type 3 axons fired at most once or twice, or not at all regardless of stimulus intensity or duration. Squid giant axons exhibit type 3 excitability (Clay 1998), which is surprising since the Hodgkin & Huxley (HH 1952d) equations of this preparation describe type 2 behaviour. The model and the underlying voltage-clamp measurements of ionic current in squid giant axons are well known (HH 1952,a–d). In particular, their description of nerve excitability contains separate pathways for sodium and potassium ions, a result that foreshadowed the discovery of ion-specific channels (Hille 2001), and they performed a detailed kinetic analysis of Na+ and K+ currents, which continues to serve as a paradigm for the manner in which voltage-clamp experiments are carried out. Finally, HH (1952d) used their equations to simulate membrane electrical behaviour, in particular the action potential response to brief duration current pulses. They cautioned against applications of their equations for long time scales, although Huxley (1959) and others have used the model for that purpose. The model predicts steady repetitive firing, type 2 (Rinzel 1978), whereas the squid giant axon fires only once at the beginning of the pulse and is then quiescent for the remainder of the pulse regardless of the pulse amplitude or duration, i.e. type 3 excitability.
Type 3 excitability in squid axons was analysed in an earlier work from this laboratory (Clay 1998), although the term type 3 was not used in that report. In that work, the discrepancies between the HH (1952d) model of Na+ channel gating and the experimental measurements of this component following their work (reviewed by Patlak 1991) were considered to be important for models of squid axon excitability, in particular the type 3 result. We have since come to the conclusion that INa may not be a significant factor for this result. The HH (1952d) INa model is sufficient (see §4). Given that their model is simpler than modern models of Na+ channel gating, we have reverted in this report to the original HH (1952d) equations and focused on modifications of the IK component which are critical for type 3 excitability. These results were also a part of the earlier analysis (Clay 1998), but were obscured by the emphasis on INa.
Here, we show that the discrepancy between the HH (1952d) model and experiments concerning the type 3 result can be resolved by changing a single parameter in their equations for K+ current gating based on the K+ current recordings in this paper. The genesis of the modification is surprising. Consider the form for K+ current given by HH (1952b), IK=gK(V, t)(V−EK), where gK is the time- and voltage-dependent K+ current conductance, V is the membrane potential and EK is the Nernst potential for potassium ions, which for most biological cells is in the −70 to −90 mV range. This equation cannot be correct given the potassium ion gradient across the membrane. The potassium ion concentration inside the biological cells, , is significantly greater than the external concentration, . The K+ current for potentials positive to EK is carried principally by intracellular K+, whereas the current for potentials below EK is carried principally by extracellular K+. The slope conductance for V≪EK is not the same as that for V≫EK, given that . Instead, the current–voltage relation has a nonlinear dependence on (V−EK), which is well described by the Goldman–Hodgkin–Katz (GHK) equation (Goldman 1943; Hodgkin & Katz 1949; Frankenhauser 1962; Binstock & Goldman 1971; Clay 1991). This nonlinearity, in turn, influences measurements of the voltage dependence of gK. In this paper, we fit the GHK equation to experimental recordings of IK, which leads to a more accurate determination of one of the parameters in the HH (1952d) model of this component, a modification that makes the model more closely resemble experimental results concerning squid axon excitability.
2. Methods
Experiments on squid giant axons were carried out at the Marine Biological Laboratory in Woods Hole, Massachusetts, using axial wire current and voltage-clamp methods previously described (Clay & Shlesinger 1983). The external solution was filtered seawater. The temperature of the experiments was in the 6–8°C range. In any given experiment, it was maintained constant to within 0.1°C by a Peltier device located within the experimental chamber. For recording potassium ion current, IK, the sodium ion current, INa, was blocked by the addition of tetrodotoxin to the external medium. Simulations were carried out with the original HH (1952d) model and with the revised version of the model, both given in appendix A.
3. Results
3.1 Type 3 excitability
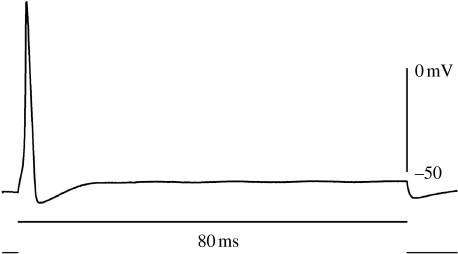
The response of squid giant axons to sustained suprathreshold current pulses is a single spike, or action potential, followed by quiescence for the remainder of the pulse regardless of pulse amplitude or duration—type 3 behaviour (figure 1). The resting potential of this preparation was −61 mV, the maximum overshoot of the spike was 31 mV, the undershoot was −68 mV and the steady quiescent level throughout the duration of the pulse was −58 mV. Similar results were observed in all experiments (n=20 axons) for pulse durations up to 2 s and for pulse amplitudes up to 50 μA cm−2. These results are consistent with the experimental observations of type 3 excitability in previous reports (Clay 1998, 2005).
Figure 1.
Response of a squid giant axon, type 3, to a sustained current pulse 15 μA cm−2 in amplitude. T=8°C.
3.2 IK recordings
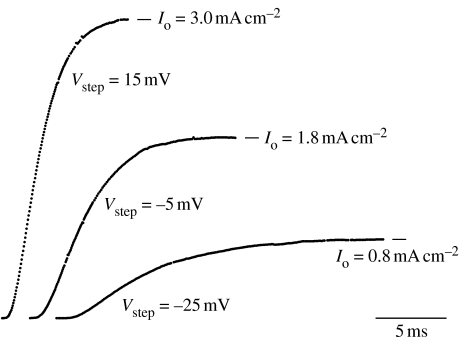
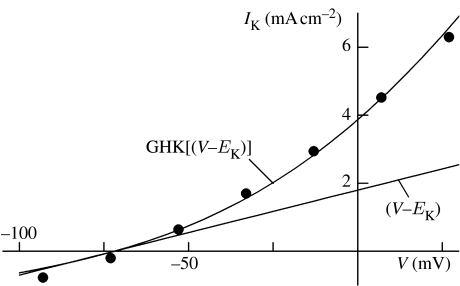
Representative recordings of IK are shown for three different voltage steps (Vstep) −25, −5 and 5 mV from a holding potential of −75 mV (figure 2). A rest interval of at least 3 s was used between each step. The initial times of the records are offset from one another. These results illustrate a sigmoidal time dependence which was originally modelled by HH as IK=ĝKn4(V, t)(V−EK), where ĝK is a constant, V is the membrane potential, EK is the K+ Nernst potential and dn(V, t)/dt=−(αn+βn) n(V, t)+αn, where αn and βn are voltage dependent (HH 1952d; see appendix A). The solution to this equation for a voltage step to a depolarized level, such as −25 mV, is an exponential function of time. Raising that solution to the fourth power yields a sigmoidal time dependence similar to that of the experimental recordings. The current at the end of each record, Io, is indicated by a horizontal bar (figure 2). In the HH (1952d) model, , where , a parameter that varies between zero at relatively negative potentials, such as the holding level, and unity at strongly depolarized potentials. This function is referred to as the IK activation curve or gK–V curve. HH (1952b) obtained this relation from normalization of their Io results with (Vstep−EK), since they assumed IK was directly proportional to (V−EK). However, IK is, instead, proportional to the GHK dependence on (V−EK) (Goldman 1943; Hodgkin & Katz 1949), as shown here (figure 3) and elsewhere (Clay 1991). These results (figure 3) were obtained with a 30 ms prepulse to −30 mV from a holding potential of −90 mV followed by steps to the potentials indicated on the abscissa. The currents immediately following that second step are plotted. The data have a nonlinear dependence on (V−EK), which is well described by the GHK equation (figure 3). We have concluded from these results that IK is given by
| (3.1) |
where PK is the membrane permeability of K ions; F is the Faraday constant; q is the unit electronic charge; k is the Boltzmann constant; and T is the absolute temperature (kT/q=24 mV at T=7°C). Equation (3.1), the part after n4(V, t), was derived from macroscopic diffusion theory (Goldman 1943). At the microscopic level, potassium ions move through K+ channels via single file diffusion along a row of three sites (Hodgkin & Keynes 1955; Zhou et al. 2001). At this level, an expression comparable to equation (3.1) can be derived (Clay 1991). Specifically,
| (3.2) |
where δ is a constant related to the frequency of collisions of K ions with the channel; NK is the K+ channel density; d1=0.07; and d2=0.18. The voltage dependence of equation (3.2) is virtually indistinguishable from that of equation (3.1) for −150<V<+150 mV (Clay 1991), and so we use
| (3.3) |
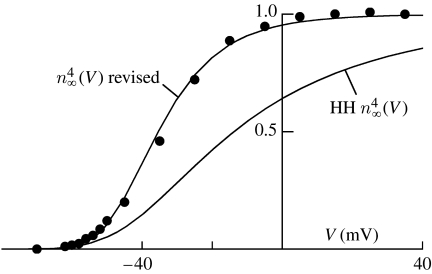
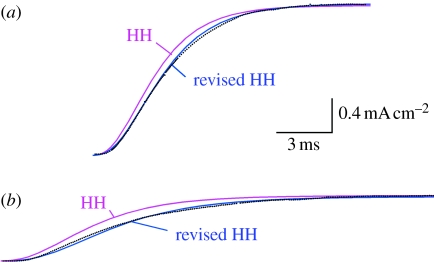
or IK=n4(V, t)δqNKGHK[(V−EK)] for brevity. At the single channel level in the HH model IK=n4(V, t)γK×NK(V−EK), where γK is the K+ channel conductance. The current at the end of voltage steps, such as those in figure 2, is given by . The first step in obtaining in the revised model is to normalize Io by GHK[(V−EK)]. For example, GHK[(V−EK)]=9.8, a dimensionless quantity, for V=Vstep=−25 mV and Io=0.8 mA cm−2 (figure 1), giving a ratio of 0.082 mA cm−2. Similar results for all the voltage steps (figure 4) describe a sigmoidal relation which saturates for Vstep>0 mV. The points for Vstep>0 mV were averaged and that average value (0.151 mA cm−2) was used as a second normalization factor to give the gK–V curve. The HH model does not adequately describe these results (figure 4). The challenge we faced was to alter their model to fit the gK–V curve without significantly modifying IK activation kinetics, which are well described by their model. Those results are determined primarily by αn, for which they used αn=−0.01(V+50)/(exp(−0.1(V+50))−1) ms−1. Their expression for βn is 0.125 exp(−(V+60)/Vo) ms−1, where Vo=80 mV. The βn parameter is significant in determining the gK–V curve and deactivation, or ‘tail’ current kinetics. HH did not report the latter. The voltage dependence of those results is not consistent with their choice of βn (Clay 1984). Both sets of results are well described following the modification of Vo. We used a least-squares procedure to obtain Vo by fitting the HH (1952d) model of to the results in figure 4 with Vo as the only adjustable parameter. The result was Vo=19.7 mV (figure 4), which steepened the gK–V curve and shifted its midpoint from −14.2 mV in the HH model to −36 mV in the revised version. The modified Vo also provides a good fit to activation kinetics (figure 5). Those results are determined primarily by αn, as noted above. However, the starting value for n, no, is affected by βn since no=αn(Vh)/(αn(Vh)+βn(Vh)), with Vh=−75 mV and βn is greater than αn at this potential. The modified βn alters the delayed onset of activation in the model following a voltage step so that the predictions of the model closely match the experimental records (figure 5).
Figure 2.
Three different IK recordings from a squid giant axon preparation (Clay & Shlesinger 1983) taken from a family of recordings in which the holding potential was −75 mV, and the step potential (Vstep) ranged from −55 to +35 mV in 10 mV increments with a 3 s rest interval between each step. The sodium ion current, INa, was blocked by tetrodotoxin (1 μM; Sigma Chemical Co., St Louis, MO). The initial times of each step are offset from one another. The currents at the end of each step, Io, are indicated by the respective horizontal bars. T=6.8°C.
Figure 3.
Nonlinear dependence of IK on (V−EK). In this preparation, the membrane potential was stepped from a holding level of −90 to −30 mV for 30 ms followed by a 10 ms step to the potentials indicated on the abscissa. The currents immediately following the second step are indicated by the circles. The curve is a fit to these results by the GHK equation (equation (3.1)), IK=ϕ(qV/kT)(exp(q(V−EK)/kT)−1)/(exp(qV/kT)−1), where ϕ is a constant, kT/q=24 mV and EK=−72 mV. The only adjustable parameter of the fit is ϕ. Results are taken from Clay (1989).
Figure 4.
Voltage dependence of gK activation. The circles correspond to the experiment illustrated in figure 1. The Io results from those records were normalized by GHK[(V−EK)]. The values of that procedure reached saturation at +5 mV. The points at 5, 15, 25 and 35 mV were averaged, and that average value was used to normalize the results a second time so that this relation for V≥5 mV corresponds to unity. The curve labelled ‘HH ’ represents in the HH (1952d) model, where n∞(V)=αn/(αn+βn). The curve labelled ‘ revised’ is the prediction of the model using the modified βn described in the text (Vo=19.7 mV as opposed to 80 mV in the HH model).
Figure 5.
Description of IK kinetics. The data are the same as in figure 2 for (a) Vstep=−5 and (b) −25 mV. The theoretical curves correspond to I1[n∞(Vstep)−(n∞(Vstep)−no(Vh))exp(−(αn(Vstep)+βn(Vstep))t)]4, where Vh=−75 mV, n∞(Vstep)=αn(Vstep)/(αn(Vstep)+βn(Vstep)), no(Vh)=αn(Vh)/(αn(Vh)+βn(Vh)) and I1 (figure 1). The red curves in (a) and (b) correspond to the respective predictions of the HH (1952d) model. The blue curves in both (a) and (b) are the predictions of their model using the modified βn. The black dotted lines are the data.
The modified βn partially explains the results of Cole & Moore (1960) concerning the influence of the holding, or starting, potential on the delay in activation of IK. They showed that even modest hyperpolarizations such as −75 mV produced a delay in the onset of IK, which was not described by HH (1952d). This effect is illustrated in figure 5. The experimental results (the black curves) rise in a manner similar to the HH predictions (the red curves) but only following a delay relative to HH. As noted above, this discrepancy for Vh=−75 mV is removed with the modified βn in the model (the blue curves). The revised model describes the delayed onset with starting potentials as negative as −100 mV (results not shown). The Cole–Moore delay increases essentially without limit down to −250 mV (Cole & Moore 1960; Clay & Shlesinger 1982). The discrepancy between the delay in activation in the revised model and the experimental recordings of IK begins to occur for starting potentials below −100 mV, which is outside the physiological range, in particular the range of potentials spanned by an action potential. Stated differently, the modification in βn as determined from GHK analysis is sufficient to modify the HH model from type 2 to type 3 behaviour. Serendipitously, this modification also describes the delay in IK activation kinetics over the physiological range of membrane potentials.
3.3 The revised model has type 3 dynamics
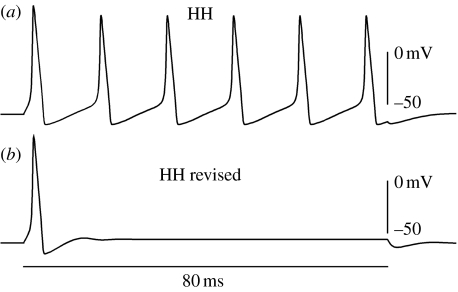
The effect of changing βn, and only βn (i.e. steepening the IK activation curve), in the HH (1952d) model is illustrated in figure 6. A long-lasting current pulse elicits a repetitive train of action potentials from the original model for as long as the pulse is applied over a broad range of pulse amplitudes, i.e. type 2 excitability. Only a single action potential is elicited from the revised model, i.e. type 3 excitability. In these simulations, we used IK=ĝKn4(V, t)(V−EK), for simplicity, with all parameters as in the HH (1952d) model except for the change in βn (modified Vo) rather than IK=δqNKn4(V, t)GHK[(V−EK)] also with the modified βn. This result appears to counter our emphasis on the use of the GHK equation. The GHK[(V−EK)] relation differs relatively little from the straight line relation for −70<V<−30 mV (figure 3). Consequently, the simulations in the revised model are essentially indistinguishable from one another regardless of whether IK∼(V−EK) or IK∼GHK[(V−EK)] is used because the membrane potential spends very little time outside the −70<V<−30 mV range during an action potential. The difference between GHK and the straight line relation is even less for the −65 to −55 mV range which, as shown below, is central for the revision of the HH model from type 2 to type 3. However, the relative conductances of the two models in this voltage range are determined via the normalization procedure with currents measured for V>0 mV. In this voltage range, GHK[(V−EK)] differs substantially from (V−EK), which accounts for the difference in the initial rising phase of the activation curves (the foot of the curves) in the −65 to −55 mV range (figure 4)—the key factor in the type 2–type 3 analysis (see below). The GHK[(V−EK)] relation must be used for descriptions of K+ current families, such as the results in figures 2 and 5, but not for simulations of excitability.
Figure 6.
Responses of (a) the HH (1952d) model and (b) the revised model to an 80 ms duration current pulse of amplitude 10 μA cm−2 in each case. Similar results are obtained in the HH model for a wide range of pulse amplitudes (Rinzel 1978). A single spike is obtained in the revised model for the suprathreshold stimuli for pulse amplitudes up to 50 μA cm−2 (simulations not shown).
3.3.1 Ionic basis of type 3 behaviour
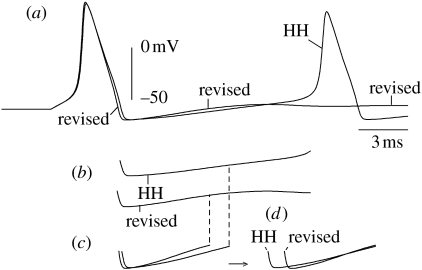
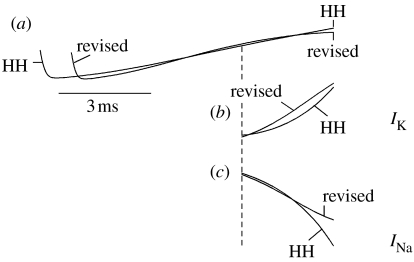
Insight into the mechanism of the type 3 result (as well as type 2 behaviour) can be obtained by superimposing the initial portions of the voltage waveforms in figure 6 for the HH and revised models (figure 7a). The action potential duration of the revised model is slightly less than that of the HH model owing to increased activation of IK during the spike (steeper activation of IK) which, in turn, causes the membrane potential to remain in the vicinity of the foot of the spike longer in the revised model. This effect, paradoxically, results in a greater turning off of IK compared with HH given that the foot of the spike, −70 mV, is below the IK activation curve on the voltage axis (figure 4). In turn, the subsequent depolarization towards threshold in the revised model is slightly faster compared with HH (figure 7c). The depolarization rate in both the models is slow relative to that preceding the first spike (figure 7). The current pulse initially depolarizes the membrane potential to threshold quickly because the resting IK level is small compared with the current immediately following an action potential. A critical comparison of the threshold properties of the two models following the first spike requires analysis of the underlying currents at similar voltages during the respective depolarizing phases, in particular in the −60 to −55 mV range. The models reach this voltage range at different times (figure 7). Consequently, we shifted the revised model by approximately 1 ms rightward so that the depolarizing phases nearly superimpose (figure 7d). The underlying IK and INa components near the threshold reveal the ionic mechanism of the second spike in HH and the failure of spikes (subsequent to the first) in the revised model (figure 8). In the −60 to −55 mV range, the steeper voltage dependence of IK described above produces a greater increase in IK relative to the increase in IK in HH just prior to the second spike in the HH model (figure 8b). The activation of INa prior to threshold is nearly the same in both (figure 8c). In HH, the well-known regenerative activation of INa (Hille 2001) begins to occur near the end of the simulation (figure 8c). Indeed, the membrane potential is beginning its upward rise towards the upstroke of the second action potential (figure 8a). The increased activation of IK in the revised model prior to threshold (produced by the modification in the gK–V curve) prevents further activation of INa, i.e. failure of additional spikes.
Figure 7.
(a) The initial 25 ms of the simulations in figure 6 are superimposed. (b) Subthreshold voltage changes following the initial spike for both models. (c) Initial depolarization phases following the first spike. Results from both models are superimposed. Each trace was terminated at V∼−59 mV. (d) The revised model has been shifted 1.2 ms rightward. The voltage traces in (c) and (d) have been amplified 2×.
Figure 8.
(a) Superimposed subthreshold voltage changes following the first spike in both models, as in figure 7b with both traces continued for an additional 3 ms. (b) Time course of IK underlying the final 3 ms of HH and the shifted revised model. (c) Similar results for INa. For further details refer to the text.
The above analysis demonstrates that the differences between types 2 and 3 models are subtle. Both the models have a threshold for a single spike in response to a brief duration pulse owing to the resting IK level which also produces a threshold for repetitive firing in the HH model for a sustained current pulse. Firing does not occur below the single spike threshold. That is, the firing frequency for sustained stimuli jumps from zero near threshold to a finite value in type 2 excitability, a frequency which is relatively insensitive to further increases in stimulus amplitude owing to the residual IK that remains after a spike. Type 1 excitability occurs, or can occur, in cells having a rapidly inactivating K+ component, IA, a component which is not present in squid axons (Connor et al. 1977). The addition of IA to the HH model causes the threshold to repetitive firing in response to sustained current to be less than in HH and to produce a firing rate that depends on current amplitude more than in HH (Connor et al. 1977).
4. Discussion
Squid giant axons have firing properties that are consistent with the type 3 classification scheme of Hodgkin (1948). The type 3 crustacean axons in his report fired once or twice, or not at all. He suggested that these results may have been attributable to rundown of the preparations. Type 3 behaviour was consistently observed in our experiments with freshly dissected axons having an action potential amplitude of 100 mV (figure 1), or higher. In the earlier model of type 3 behaviour from this laboratory (Clay 1998), the multi-state Markov chain model of Na+ channel gating in squid axons by Vandenberg & Bezanilla (1991b) was used. Their model describes INa voltage-clamp results not predicted by HH (1952d), in particular observations obtained with a double-voltage-step protocol suggesting that Na+ channel activation and inactivation are kinetically linked (Bezanilla & Armstrong 1977). These processes are independent of each other in the HH (1952d) model. Those results may not be relevant for membrane excitability. The single step protocol used by HH (1952a–c) appears to be sufficient, results that are well described by the HH (1952d) INa model (Oxford 1981; J. R. Clay 2001, unpublished simulations). We have found that type 3 behaviour occurs with either model of INa, given the change in the βn parameter described above. Accumulation and depletion of K ions in the extracellular space between the axolemma and the glial cells surrounding the axon, the so-called Frankenhauser & Hodgkin (1956) space, was also included in the earlier work (Clay 1998). That portion of the model is not a factor in type 3 behaviour (simulations not shown).
Several groups have recently used the GHK normalization procedure described in this study and in an earlier report (Clay 2000) to obtain K+ channel activation curves (DeFazio & Moenter 2002; Boland et al. 2003; Van Hoorick et al. 2003; Persson et al. 2005; Nakamura & Takahashi 2007; Johnston et al. 2008). A far larger number of reports have used normalization with (V−EK). Many of these results have been from K+ channels heterologously expressed in Xenopus oocytes. A determination of the relationship of those results to excitability in the native cells containing the relevant K+ channels is not straightforward. Other reports have been from native cells in which analysis of K+ currents is carried out with various ion channel blockers and voltage-clamp protocols used to remove other currents from the analysis. Most mammalian neurons contain several types of voltage-gated ion channels in contrast to squid giant axons which have only two (Bean 2007). Relatively few ionic models have been published for these cells. Determining the effect of GHK normalization of K+ currents in the models which are available is beyond the scope of this study.
Type 3 excitability has been observed in squid giant axons (this report; Clay 1998), bullfrog ganglion cells (Jones 1985; Jones & Adams 1987), goldfish Mauthner cells (Nakayama & Oda 2004), the original results from crustacean axons (Hodgkin 1948) and one type of ventral cochlear neurons from guinea-pigs (Rothman & Manis 2003b). The latter authors referred to this behaviour, i.e. a single spike in response to a sustained current stimulus, as type 2. They presented a model of this result in which the dominant current responsible for the behaviour is a rapidly activating, slowly inactivating low-threshold K+ current which they termed ILT (Rothman & Manis 2003a,b).
Our results raise an additional issue with regard to the HH (1952d) model of the Na+ current component. Specifically, the GHK equation also applies to INa (Vandenberg & Bezanilla 1991a). The curvature of this result is in the direction opposite to that of the IK results (figure 3) because [Nao]+≫[Nai]+. The curvature is offset by a partial, voltage-dependent block of INa by extracellular calcium ions, so that INa is approximately proportional to (V−ENa) over the range of potentials spanned by the action potential (Vandenberg & Bezanilla 1991a). Consequently, normalization of peak INa results during voltage-clamp steps by (V−ENa), the procedure used by HH (1952,a–d) to obtain kinetic information concerning Na+ channel gating, is appropriate. One result of this analysis is that the steepness of voltage activation of INa closely matches that of the revised IK analysis. Indeed, the revised curve superimposes almost exactly with the HH curve following a voltage shift (results not shown), a serendipitous finding given that the modification of Vo in the βn parameter was not designed with this result in mind. This result is to be expected given the structural similarity of K+ and Na+ channels (Sigworth 2003). They differ from one another primarily in the structure of their respective permeation pathways (Hille 2001).
As noted above, the GHK normalization procedure we have used for squid K+ channels has recently been applied to obtain the activation curves for K+ channels in other preparations. The relationship of those results for excitability in cells other than squid axons is a topic for future study.
Acknowledgments
This work was supported by the Intramural Research Program of the National Institute of Neurological Disorders and Stroke, National Institutes of Health, Bethesda, Maryland.
Appendix A.
The HH (1952d) model is given by
| (A1) |
where C is the membrane capacitance, C=1 μF cm−2; V is the membrane potential in mV; t is the time in milliseconds; IK, INa, IL and Istim are, respectively, the potassium ion current, the sodium ion current, the ‘leak’ current and the stimulus current, all in μA cm−2. The IK component is given by ĝKn4(V, t)(V−EK) with ĝK=36 mS cm−2, EK=−72 mV and dn(V, t)/dt=−(αn+βn)n(V, t)+αn, with αn=−0.01(V+50)/(exp(−0.1(V+50))−1) ms−1 and βn=0.125exp(−(V+60)/Vo) ms−1 with Vo=80 mV. The INa component is given by ĝNam3(V, t)h(V, t)(V−ENa) with ĝNa=120 mS cm−2, ENa=55 mV, dm(V, t)/dt=−(αm+βm)m(V, t)+αm, with αm=−0.1(V+35)/(exp(−0.1(V+35))−1) ms−1 and βm=4exp(−(V+60)/18) ms−1, and dh(V, t)/dt=−(αh+βh)h(V, t)+αh with αh=0.07 exp(−(V+60)/20) ms−1 and βh=1/(exp(−0.1(V+30))+1) ms−1. The IL component is given by ĝL(V−EL) with ĝL=0.3 mS cm−2 and EL=−49 mV. The only modification in the revised model is that Vo=19.7 rather than 80 mV, which was obtained using IK=n4(V, t)δqNKGHK[(V−EK)], as described in §3, where GHK refers to the Goldman–Hodgkin–Katz equation, δ is a constant related to the frequency of collisions of K ions with a K+ channel, q is the unit electronic charge, NK is the K+ channel density and GHK[(V−EK)]=(qV/kT)(exp(q(V−EK)/kT)−1)/(exp(qV/kT)−1), where k is the Boltzmann constant and T is absolute temperature (kT/q=24 mV at T=7°C). We used IK∼(V−EK) rather than IK∼GHK[(V−EK)] in the simulations for reasons noted in §3.
References
- Bean B.P. The action potential in mammalian central neurons. Nat. Rev. Neurosci. 2007;8:451–465. doi: 10.1038/nrn2148. [DOI] [PubMed] [Google Scholar]
- Bezanilla F, Armstrong C.M. Inactivation of the sodium channel. I. Sodium current experiments. J. Gen. Physiol. 1977;70:549–566. doi: 10.1085/jgp.70.5.549. [DOI] [PMC free article] [PubMed] [Google Scholar]
- Binstock L, Goldman L. Rectification in instantaneous potassium current–voltage relations in Myxicola giant axons. J. Physiol. 1971;217:517–531. doi: 10.1113/jphysiol.1971.sp009583. [DOI] [PMC free article] [PubMed] [Google Scholar]
- Boland L.M, Jiang M, Lee S.Y, Fahrenkrug S.C, Harnett M.T, O'Grady S.M. Functional properties of a brain-specific NH2-terminally spliced modulator of KV4 channels. Am. J. Physiol. Cell Physiol. 2003;285:C161–C170. doi: 10.1152/ajpcell.00416.2002. [DOI] [PubMed] [Google Scholar]
- Clay J.R. Potassium channel kinetics in squid axons with elevated levels of external potassium concentration. Biophys. J. 1984;45:481–485. doi: 10.1016/S0006-3495(84)84172-7. [DOI] [PMC free article] [PubMed] [Google Scholar]
- Clay J.R. On the mechanism underlying recovery from repolarization in squid giant axons. In: Jacklet J, editor. Neuronal and cellular oscillators. Marcel Dekker; New York, NY: 1989. pp. 3–30. [Google Scholar]
- Clay J.R. A paradox concerning ion permeation of the delayed rectifier potassium ion channel in squid giant axons. J. Physiol. 1991;444:499–511. doi: 10.1113/jphysiol.1991.sp018890. [DOI] [PMC free article] [PubMed] [Google Scholar]
- Clay J.R. Excitability of the squid giant axon revisited. J. Neurophysiol. 1998;80:903–913. doi: 10.1152/jn.1998.80.2.903. [DOI] [PubMed] [Google Scholar]
- Clay J.R. Determining K+ channel activation curves from K+ channel currents. Eur. Biophys. J. 2000;29:555–557. doi: 10.1007/s002490000091. [DOI] [PubMed] [Google Scholar]
- Clay J.R. Axonal excitability revisited. Prog. Biophys. Mol. Biol. 2005;88:59–90. doi: 10.1016/j.pbiomolbio.2003.12.004. [DOI] [PubMed] [Google Scholar]
- Clay J.R, Shlesinger M. Delayed kineteics of squid axon potassium channels do not always superpose after time translation. Biophys. J. 1982;37:677–680. [PMC free article] [PubMed] [Google Scholar]
- Clay J.R, Shlesinger M. Effects of external cesium and rubidium on outward potassium currents in squid axons. Biophys. J. 1983;42:43–53. doi: 10.1016/S0006-3495(83)84367-7. [DOI] [PMC free article] [PubMed] [Google Scholar]
- Cole K.S, Moore J.W. Potassium ion current in the squid giant axon: dynamic characteristic. Biophys. J. 1960;1:1–14. doi: 10.1016/s0006-3495(60)86871-3. [DOI] [PMC free article] [PubMed] [Google Scholar]
- Connor J.A, Walter D, McKown R. Modifications of the Hodgkin–Huxley axon suggested by experimental results from crustacean axons. Biophys. J. 1977;18:81–102. doi: 10.1016/S0006-3495(77)85598-7. [DOI] [PMC free article] [PubMed] [Google Scholar]
- DeFazio R.A, Moenter S.M. Estradiol feedback alters potassium currents and firing properties of gonadotropin-releasing hormone neurons. Mol. Endocrinol. 2002;16:2255–2265. doi: 10.1210/me.2002-0155. [DOI] [PubMed] [Google Scholar]
- Frankenhauser B. Potassium permeability in myelinated nerve fibers of Xenopus laevis. J. Physiol. 1962;160:54–61. doi: 10.1113/jphysiol.1962.sp006834. [DOI] [PMC free article] [PubMed] [Google Scholar]
- Frankenhauser B, Hodgkin A.L. The after-effects of impulses in the giant nerve fibers of Loligo. J. Physiol. 1956;131:341–376. doi: 10.1113/jphysiol.1956.sp005467. [DOI] [PMC free article] [PubMed] [Google Scholar]
- Goldman D.E. Potential, impedance, and rectification in membranes. J. Gen. Physiol. 1943;27:37–60. doi: 10.1085/jgp.27.1.37. [DOI] [PMC free article] [PubMed] [Google Scholar]
- Hille B. 3rd edn. Sinauer; Sunderland, MA: 2001. Ion channels of excitable membranes. [Google Scholar]
- Hodgkin A.L. The local electric changes associated with repetitive action in a non-medullated axon. J. Physiol. 1948;107:165–181. doi: 10.1113/jphysiol.1948.sp004260. [DOI] [PMC free article] [PubMed] [Google Scholar]
- Hodgkin A.L, Huxley A.F. Currents carried by sodium and potassium ions through the membrane of the giant axon of Loligo. J. Physiol. 1952a;116:449–472. doi: 10.1113/jphysiol.1952.sp004717. [DOI] [PMC free article] [PubMed] [Google Scholar]
- Hodgkin A.L, Huxley A.F. The components of membrane conductance in the giant axon of Loligo. J. Physiol. 1952b;116:473–496. doi: 10.1113/jphysiol.1952.sp004718. [DOI] [PMC free article] [PubMed] [Google Scholar]
- Hodgkin A.L, Huxley A.F. The dual effect of membrane potential on sodium conductance in the giant axon of Loligo. J. Physiol. 1952c;116:497–506. doi: 10.1113/jphysiol.1952.sp004719. [DOI] [PMC free article] [PubMed] [Google Scholar]
- Hodgkin A.L, Huxley A.F. A quantitative description of membrane current and its application to conduction and excitation in nerve. J. Physiol. 1952d;117:500–544. doi: 10.1113/jphysiol.1952.sp004764. [DOI] [PMC free article] [PubMed] [Google Scholar]
- Hodgkin A.L, Katz B. The effect of sodium ions on the electrical activity of the giant axon of the squid. J. Physiol. 1949;108:37–77. doi: 10.1113/jphysiol.1949.sp004310. [DOI] [PMC free article] [PubMed] [Google Scholar]
- Hodgkin A.L, Keynes R.D. The potassium permeability of a giant nerve fiber. J. Physiol. 1955;128:61–88. doi: 10.1113/jphysiol.1955.sp005291. [DOI] [PMC free article] [PubMed] [Google Scholar]
- Huxley A.F. Ion movements during nerve activity. Ann. NY Acad. Sci. 1959;81:221–246. doi: 10.1111/j.1749-6632.1959.tb49311.x. [DOI] [PubMed] [Google Scholar]
- Johnston J, Griffin S.J, Baker C, Forsythe I.D. Kv4 (A-type) potassium currents in the mouse medial nucleus of the trapezoid body. Eur. J. Neurosci. 2008;27:1391–1399. doi: 10.1111/j.1460-9568.2008.06116.x. [DOI] [PubMed] [Google Scholar]
- Jones S.W. Muscarinic and peptidergic excitation of bull-frog sympathetic neurons. J. Physiol. 1985;366:63–87. doi: 10.1113/jphysiol.1985.sp015785. [DOI] [PMC free article] [PubMed] [Google Scholar]
- Jones, S. W. & Adams, P. 1987 The M-current and other potassium currents of vertebrate neurons. In Neuromodulation. The biochemical control of neuronal excitability. New York, NY: Oxford University Press.
- Nakayama H, Oda Y. Common sensory inputs and differential excitability of segmentally homologous reticulospinal neurons in the hindbrain. J. Neurosci. 2004;24:3199–3209. doi: 10.1523/JNEUROSCI.4419-03.2004. [DOI] [PMC free article] [PubMed] [Google Scholar]
- Nakamura Y, Takahashi T. Developmental changes in potassium currents at the rat calyx of Held presynaptic terminal. J. Physiol. 2007;581:1101–1112. doi: 10.1113/jphysiol.2007.128702. [DOI] [PMC free article] [PubMed] [Google Scholar]
- Oxford G.S. Some kinetic and steady-state properties of sodium channels after removal of inactivation. J. Gen. Physiol. 1981;77:1–22. doi: 10.1085/jgp.77.1.1. [DOI] [PMC free article] [PubMed] [Google Scholar]
- Patlak J. Molecular kinetics of voltage-dependent Na+ channels. Physiol. Rev. 1991;71:1047–1080. doi: 10.1152/physrev.1991.71.4.1047. [DOI] [PubMed] [Google Scholar]
- Persson F, Carlsson L, Duker G, Jacobson I. Blocking characteristics of hKv1.5 and hKc4.3/hKChIP2.2 after administration of the novel antiarrhythmic compound AZD7009. J. Cardiovasc. Pharmacol. 2005;46:7–17. doi: 10.1097/01.fjc.0000161405.37198.c1. [DOI] [PubMed] [Google Scholar]
- Rinzel J. On repetitive firing in nerve. Fed. Proc. 1978;37:2793–2802. [PubMed] [Google Scholar]
- Rothman J.S, Manis P.B. Kinetic analyses of three distinct potassium conductances in ventral cochlear neurons. J. Neurophysiol. 2003a;89:3083–3096. doi: 10.1152/jn.00126.2002. [DOI] [PubMed] [Google Scholar]
- Rothman J.S, Manis P.B. The roles potassium currents play in regulating the electrical activity of ventral cochlear nucleus neurons. J. Neurophysiol. 2003b;89:3097–3113. doi: 10.1152/jn.00127.2002. [DOI] [PubMed] [Google Scholar]
- Sigworth F. Structural biology: life's transitors. Nature. 2003;423:21. doi: 10.1038/423021a. [DOI] [PubMed] [Google Scholar]
- Vandenberg C.A, Bezanilla F. Single-channel, macroscopic, and gating currents from sodium channels in the squid giant axon. Biophys. J. 1991a;60:1499–1510. doi: 10.1016/S0006-3495(91)82185-3. [DOI] [PMC free article] [PubMed] [Google Scholar]
- Vandenberg C.A, Bezanilla F. A sodium channel gating model based on single channel, macroscopic ionic, and gating currents in the squid giant axon. Biophys. J. 1991b;60:1511–1533. doi: 10.1016/S0006-3495(91)82186-5. [DOI] [PMC free article] [PubMed] [Google Scholar]
- Van Hoorick D, Raes A, Keysers W, Mayeur E, Snyders D.J. Differential modulation of KV3 kinetics by KCHIP1 splice variants. Mol. Cell. Neurosci. 2003;24:357–366. doi: 10.1016/S1044-7431(03)00174-X. [DOI] [PubMed] [Google Scholar]
- Zhou Y, Morais-Cabral J.H, Kaufman A, MacKinnon R. Chemistry of ion coordination and hydration revealed by a K+ channel-Fab complex at 2.0 Å resolution. Nature. 2001;414:43–48. doi: 10.1038/35102009. [DOI] [PubMed] [Google Scholar]


