Abstract
Empirical data indicate that the maternal diet composition has a direct impact on foetal fat mass and resulting birth weights. Weight-bearing maternal exercise influences the placental volume, which has also been correlated to birth weight. A foetal energy balance equation, based on the first law of thermodynamics, that incorporates maternal diet and exercise is developed. Model parameters and validity are evaluated using published data.
Keywords: differential equation, energy balance, exercise, foetus, glycaemic index, placental volume
1. Introduction
Recent advances in ultrasound and other technologies have allowed the medical community to estimate foetal growth rates in utero, diagnose abnormalities and treat foetal conditions prior to birth (Parretti et al. 2003; Koo et al. 2004; Padoan et al. 2004). In spite of the progress, these estimates still contain significant errors and the uterus remains a black box. Past attempts to mathematically predict foetal growth rates and resulting birth weights were based on statistical data fitting (Sparks 1984; Kennaugh & Hay 1987). The statistical models separate birth weights into three standard categories: large for gestational age (LGA, greater than 90th percentile); average for gestational age (AGA, between 10th and 90th percentile); and small for gestational age (SGA, less than 10th percentile; Usher & McLean 1969).
Although statistical methods can provide estimates of foetal growth and alert us to deviations from an expected growth pattern, they require knowledge of the foetal mass category and do not incorporate underlying physiological explanations that determine whether a foetus will be large, average or small. The question of whether a foetus will be large, average or small has increased in importance due to a growing body of research connecting infant birth weights to adult health (Ravelli et al. 1976; Starfield & Budetti 1985; Paneth 1994; Osmond & Barker 2000; Landrigan et al. 2005; McMillen et al. 2005; Salsberry & Reagan 2005).
In order to develop a dynamic mathematical model of foetal growth rates, the manner in which the foetus ingests energy must be examined. The energy obtained by the foetus is regulated by the placenta and consequent correlations between placental volume and foetal mass have been observed (Thame et al. 2001, 2004). Control of the placental volume has been connected to maternal exercise intensity (Jackson et al. 1995; Clapp et al. 2000, 2002; Clapp 2003, 2006; Bergmann et al. 2004) and therefore the energy consumed by the foetus is an indirect function of maternal exercise intensity. In addition, recent work has linked the nutrient composition of the maternal diet to foetal growth (Fraser et al. 1988; Clapp 1998, 2002; Parretti et al. 2003; Scholl et al. 2004; Moses et al. 2006). Based on these conclusions, we develop a foetal energy balance equation founded on the first law of thermodynamics and examine the predictive value of the results in connection with reported birth weights.
2. Development of mathematical model
2.1 Placental volume model
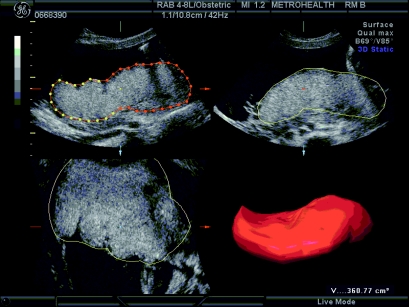
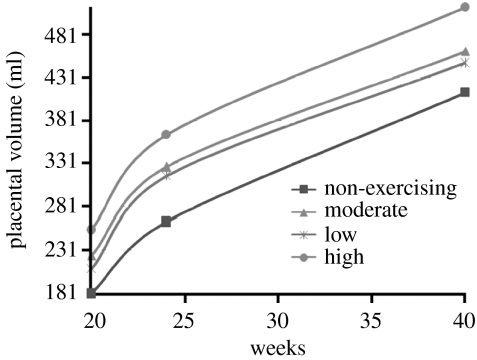
The first step to developing a foetal energy balance model is to understand the topology and resulting blood flow from placenta to foetus as a function of time. The simplest measurable characteristic of the placenta is the placental volume. Because three-dimensional ultrasound technology can accurately determine the volume of balloon-like structures in utero, the placental volume can be computed between the 20th and the 36th weeks of gestation with minimal error (figure 1). Prior to the 20th week, the placenta is too small for accurate volume calculations and after the 36th week, the uterus contains very little space to determine definite measurements. The placental volume is largely determined by the villi, finger-like structures formed in the placenta (Clapp et al. 2000, 2002). The spaces between and among the villi (intervillous space) fill with maternal blood through which nutrients are despatched to the foetus. During early pregnancy, when ample space exists in utero, the placental volume increases in an unrestricted manner. The amount of villi formed in early pregnancy appears to determine how much blood can be maximally held by the placenta in late pregnancy. As space restricts growth, the rate of placental volume growth decreases as seen in the placental volume data curves (figure 2). Although the data plotted in figure 2 were collected at only three time values, it is well known that placental growth curves are logistic in nature (Bonds et al. 1984; Geirsson et al. 1985). The familiar sigmoidal structure of placental volume curves corresponds to the logistic differential equation model used in population dynamics, i.e. if we define
then the rate of placental volume growth per day is governed by the equation
| (2.1) |
where r is the unrestricted growth rate and K is the carrying capacity (the maximum possible volume (ml) the placenta can attain). Weight-bearing maternal exercise increases placental blood flow through an increase in villi (Clapp 2006). Both changes clearly suggest that the absolute rate of blood flow is increased as well. Figure 2 depicts several placental volume mean data curves from Clapp et al. (2000, 2002). Each curve corresponds to a group of mothers exercising at similar exercise intensity; the lowest curve correlating to non-exercising mothers and the highest curve to high-intensity exercising mothers (60% of Vo2max). Because P(t) can be solved for in closed form,
| (2.2) |
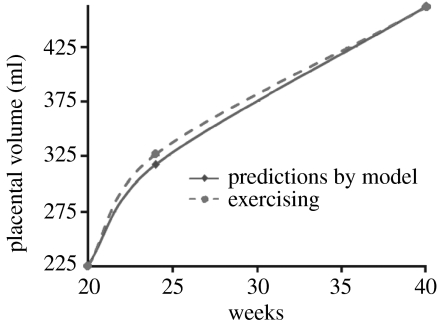
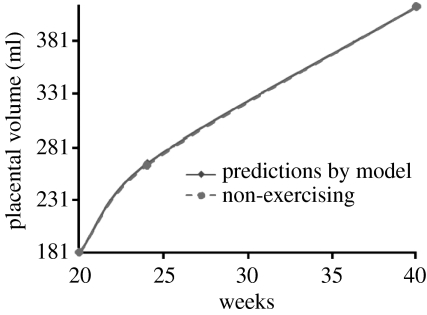
we can use the data to estimate parameters. The value r=0.03 is held constant for all placental volume curves. The value of the carrying capacity, K, increased in range from K=424 ml for non-exercising mothers to 522 ml for high-intensity exercising mothers. The initial condition, P(140), is also a function of exercise intensity ranging from P(140)=181 ml for non-exercising mothers to P(140)=255 ml for high-intensity exercising mothers. Figures 3 and 4 plot the model predictions against data from Clapp et al. (2000, 2002) for moderate-intensity exercising mothers and non-exercising mothers, respectively. How P(140) and K are determined for specific cases will be discussed in an example of parameter estimation in §4.
Figure 1.
Placental volume measurements through a three-dimensional ultrasound.
Figure 2.
Placental volume data for varying maternal exercise intensities from Clapp et al. (2000, 2002).
Figure 3.
Placental volume data and model predictions for moderate exercising case .
Figure 4.
Placental volume data and model predictions for non-exercising case .
2.2 The foetal energy balance model
Human energy balance equations are derived directly from the first law of thermodynamics (McArdle et al. 2001). Simply stated, the first law of thermodynamics asserts that energy cannot be destroyed and, as a result, must be used or stored (Felder & Rousseau 1999). Differential equation models for human energy balance equations, based on the first law of thermodynamics, have been developed to describe the rate of energy accretion during normal and starvation periods in adult humans (Christiansen et al. 2005; Hall 2006; Song & Thomas 2007). Song & Thomas have carefully derived the human energy balance equation based on the first law of thermodynamics which we refer the reader to. The energy balance equation is R=I−E, where R is the rate of energy accretion in kcal d−1; I is the rate of energy ingested in kcal d−1; and E is the rate of energy expended in kcal d−1. The foetal energy balance model presented here develops each term R, E and I applying published conclusions on the rate of foetal caloric acquirement, accretion and expenditure. These observations yield the following assumptions that establish the model:
The accretion rate of fat-free mass is constant after the 30th week (Moulton 1923; Sparks 1984; Forbes 1987; Catalano et al. 1992).
The foetus begins to store fat at the 30th week (Widdowson & Spray 1951; Sparks 1984).
Foetal growth is directly linked to maternal glucose. Glucose availability at the placental site regulates the rate of placental release of, as yet unidentified, growth-suppressive peptide or peptides into the foetal compartment. When glucose availability decreases, the rate of release increases which slows the synthesis of insulin growth factors (IGFs) and increases the synthesis of IGF-binding proteins by multiple foetal tissues. This slows the foetal growth in the tissue-specific pattern which, if persistent, defines the timing and type of growth restriction. Conversely, when glucose availability increases, the rate of release decreases which upregulates IGFs and downregulates IGF-binding proteins in the foetal compartment resulting in an increased foetal growth rate. As a result, we assume that the rate of kcal ingested by the foetus is an increasing function of placental volume, total maternal kcal ingested and the glycaemic index of the maternal diet (Fraser et al. 1988; Clapp 1998, 2002; Parretti et al. 2003; Scholl et al. 2004; Moses et al. 2006).
The pregnancy is considered normal and the foetus is not deprived of energy required to grow.
2.2.1 R
By the third trimester, the foetus can store energy only in the form of anhydrous fat-free mass (protein) and foetal fat mass (Widdowson & Spray 1951). Therefore,
If we define A(t) to be the anhydrous fat-free mass on day t of the gestational period and assign the state variable,
in kg, we have the following formulation for R:
| (2.3) |
where (caloric value of 1 kg of fat mass and 1 kg of anhydrous fat-free mass).
2.2.2 I
Measurements of I as a function of placental volume, glycaemic index and total maternal calories do not currently exist and as a result we must conjecture what this term will be. The simplest possible formulation is a product of the total maternal calories per day, percentage factor of daily glycaemic index of maternal diet and placental volume. Thus,
| (2.4) |
where m is the total daily average of kcal ingested by the mother; g is the percentage impact of the average daily glycaemic index of maternal diet (g=0 implies the lowest possible glycaemic index and g=1 represents the highest possible); and is the placental volume on day t. The parameter γ is a conversion constant measured in 1 ml−1.
2.2.3 E
The term E consists of two parts. The first component is the energy that the foetus requires to sustain and maintain life, EM, and the second component is the energy required for the deposition of fat, EF,
Caloric requirements of foetal growth and sustainment per day are typically provided in the literature as a proportion of body mass (Sparks 1984; Kennaugh & Hay 1987). Therefore, we model the rate of growth and sustainment caloric requirements as a direct proportion of foetal body mass,
| (2.5) |
where μ is the proportionality constant measured in kcal kg−1 d−1 and FFM(t) is the fat-free mass of the foetus in kg on day t. We point out that there is no reason to assume that the proportionality constant is equal for fat-free mass and fat mass (Elia 1992). Our formulation is simplifying and allows for the simple use of the reported data.
The value for EF is a difficult quantity to measure at any stage of life. The model composition of the energy balance equation in Christiansen et al. (2005) circumvents this issue by using an efficiency constant. In order to factor in the cost of energy to deposit fat, Christiansen et al. (2005) rewrite the energy balance equation as , where e is the efficiency of the conversion of food energy into new tissue. Applying the data in Widdowson & Dickerson (1964), we can estimate e using the formula derived in Christiansen et al. (2005) to be e=0.799.
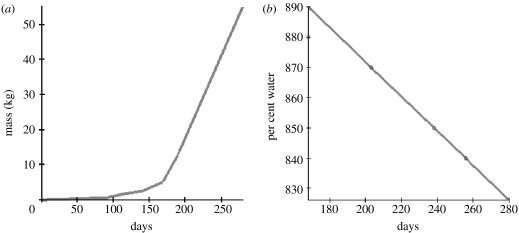
Although there is variation in fat-free mass as a function of gender, genes, exercise and diet, we will assume a formulation for fat-free mass in order to understand the dynamics of fat accumulation in the foetus. Define A(t) to be the anhydrous fat-free mass of the foetus in kg on day t of gestation. Because the fat-free mass is composed largely of water (Widdowson & Dickerson 1964), we will partition FFM(t) by , where W(t) is the portion of FFM(t) that consists of water on day t of gestation. Data points from Widdowson & Dickerson (1964) provide estimates of what percentage of FFM(t) is composed of water along with average FFM(t) values. Applying a least-squares approximation of the per cent of water as a function of gestational age allows for a piecewise linear least-squares approximation of A(t) which we hold constant for all simulations (figure 5).
Figure 5.
Least-squares approximation for (a) piecewise linear fat-free mass curve and (b) per cent water composition of fat-free mass as a function of gestational age.
The full foetal energy balance equation model is
| (2.6) |
The assumption that foetal fat mass does not begin to accrue until the 30th week yields the initial condition F(210)=0. A list of all state variables and parameters with meanings and units is given in table 1.
Table 1.
Model variables and parameters.
| variable | meaning | units |
|---|---|---|
| P(t) | placental volume on day t of gestation | ml |
| K | carrying capacity of placental volume | ml |
| r | growth rate of placental volume | 1 d−1 |
| F(t) | foetal fat mass on day t of gestation | kg |
| A(t) | anhydrous fat-free mass on day t of gestation | kg |
| FFM(t) | fat-free mass on day t of gestation | kg |
| λF | caloric value of a kg of anhydrous fat mass | kcal kg−1 |
| λA | caloric value of a kg of anhydrous fat-free mass | kcal kg−1 |
| e | efficiency of fat deposition | dimensionless |
| γ | conversion constant | 1 ml−1 |
| m | maternal caloric intake per day | kcal d−1 |
| g | glycaemic impact of intake | dimensionless |
| μ | proportion the total body mass contributes to expenditure | kcal kg−1 d−1 |
3. Mathematical analysis
The closed-form solution for P(t) can be determined using separation of variables and as a result the solution for F(t) depends on the computation of the integral in
| (3.1) |
where and −−. In addition, we need to guarantee that solutions do not become negative. Recall the assumption that the mother is healthy and the foetus is obtaining adequate nutrients to grow. This translates mathematically as the rate of energy ingested by the foetus should exceed the growth rate in the absence of any fat storage. The minimum possible rate of energy ingested is
where (since the placental volume is increasing, the smallest placental volume in the foetal balance equation is at the beginning of integration, which is at the beginning of the third trimester). The maximum need by the anhydrous fat-free mass occurs at birth: , where GA is the gestational age and c is the slope of A(t) after the 30th week. If we let and require , then we have whenever F=0 guaranteeing F(t) is non-negative for .
Suppose that . Then the solution to (2.6) is non-negative for all .
4. Parameter estimation and model predictive value
Foetal caloric requirements and accretion values based on large datasets have been estimated and recorded in Sparks (1984) and Kennaugh & Hay (1987). By applying these values at the 30th week, we can estimate the parameters of our dynamic model as illustrated in the following example for a group of mothers who ran during pregnancy. Example:
The values for P(140) and K are determined by estimating the exercise intensity of the population. Placental volume data at gestation can be found in Bergmann et al. (2004) for a group of runners (P(278)=431)). Based on this data point, we find the appropriate logistic curve that fits the point and falls into the category of exercising placental volumes. This assumption leads to an initial value of P(140)=255 and K=441. In the case where maternal exercise intensity is not published, we assume a non-exercising population which yields P(140)=181 and K=522.
If maternal diet estimates are provided as in Clapp (1998), m is determined from the published value. If maternal diet information is not provided, we assume a traditional western diet moderately high in glycaemic index, g=0.65, and an average maternal caloric intake of m=2200 kcal. The value of g was determined to provide the best fit to the data in Widdowson & Dickerson (1964). In the case of the runner group, maternal diet information did not appear.
Based on the statistical analysis of large datasets, the average accretion rate in kcal kg−1 d−1 for a human foetus is approximately 40 (Sparks 1984). In addition, the analysis in Sparks (1984) indicates that foetal caloric requirements range from 70 to 85% of the accretion rate where the lower end corresponded to a larger than average birth weight at gestation and the higher end corresponded to a smaller than average birth weight at gestation. If the mothers in a study had healthy pregnancies, we assumed that this percentage was 80% (Sparks 1984). Since we assumed that F(210)=0, we may determine μ by solving the equation
yielding μ=32.
Applying that the average accretion rate of a human foetus is 40 kcal kg−1 d−1 at the 30th week and that fat-free mass grows linearly after the 30th week, we have
where c is the slope of A(t) after the 30th week. Since have been estimated and , the only remaining unknown is γ
allowing us to solve for γ; γ=0.000234.
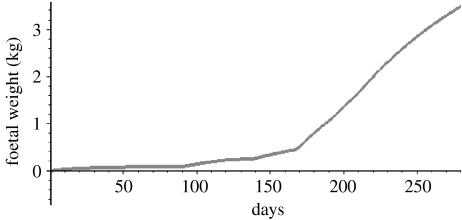
We can plot the entire evolution of foetal mass during gestation by plotting FFM(t) from t=0 to 210 days and FFM(t)+F(t) from t=210 to 280 days (figure 6). The curve in figure 6 fits the description of foetal mass data curves which are known to be sigmoidal, curvilinear and an increasing function of gestational age (Sparks 1984; Forbes 1987). Mean birth weights from several studies appear in Catalano et al. (1995a,b), Clapp (1998), Bergmann et al. (2004) and Koo et al. (2004). Model solutions were integrated after parameters were determined, applying as much information provided on maternal diet and exercise from each study. The resulting birth weights and fat mass predicted by the model versus the published data are provided in table 2.
Figure 6.
Foetal weight in kg as a function of gestational age for a 40-week gestational period.
Table 2.
Model predictions of fat mass and birth weight compared with empirical data.
| source and parameters | model predictions | empirical data | ||
|---|---|---|---|---|
| birth weight (kg) | fat mass (kg) | birth weight (kg) | fat mass (kg) | |
| low glycaemic diet, Clapp (1998) | 3.45 | 0.231 | 3.33 | 0.266 |
| g=0.55, m=2200 | ||||
| P(140)=181, μ=32 | ||||
| γ=0.0004, K=424 | ||||
| runner group, Bergmann et al. (2004) | 3.49 | 0.37 | 3.44 | 0.38 |
| g=0.65, m=2200 | ||||
| P(140)=255, μ=32 | ||||
| γ=0.00023, K=522 | ||||
| non-exercising group, Bergmann et al. (2004) | 3.53 | 0.31 | 3.53 | 0.42 |
| g=0.65, c=0.011, m=2200 | ||||
| P(140)=181, μ=32 | ||||
| γ=0.00027, K=424 | ||||
5. Conclusion
Although the foetal energy balance model is simple in nature, its predictive ability against published data appears strong. There are several shortcomings of the model to keep in mind for modifications and future improvements.
The total maternal caloric intake per day is difficult to determine. In order to estimate the maternal caloric intake, one can use pre-pregnancy height, weight and age along with the Harris–Benedict regression formula to determine the pre-pregnancy basal metabolic rates (McArdle et al. 2001). Assuming that the woman is in equilibrium state prior to pregnancy, the total maternal caloric intake can be estimated by assuming that the basal metabolic rate accounts for 60% of total energy expenditures. This value provides a ballpark figure for m.
For future work, refining parameter values for c, g and γ must be examined carefully in a laboratory setting. Our current model simply computes a best approximation for g to data in Widdowson & Dickerson (1964). The fact that we used one function for FFM(t) is simplifying. Different formulations for FFM(t) based on gender and exercise need to be developed to improve the model. Other studies indicate a correlation between pre-pregnancy weight and birth weights and pregnancy weight gain and birth weights (Abrams & Selvin 1995; Hibbert et al. 1999; Maloni et al. 2004; McLaughlin et al. 2006). Determining how these factors affect placental volume and model formulation needs to be investigated. In addition, the conjectured term for I should be improved and established through data analysis. Our current placental volume data were collected at three different points. Data specifically designed for improvement to the model need to be collected at more gestational time values.
After the parameter ranges and I have been satisfactorily determined, the model's prospective value against individual data should be evaluated.
Acknowledgments
Special thanks to Christina Candelaria, Michael Jones, Helen Roberts, Mallika Thomas, Baojun Song and an anonymous referee for their valuable discussions and feedback. The authors would also like to thank the Rockaway Township Library for connecting the authors on this project.
References
- Abrams B, Selvin S. Maternal weight gain pattern and birth weight. Obstet. Gynecol. 1995;86:163–169. doi: 10.1016/0029-7844(95)00118-B. [DOI] [PubMed] [Google Scholar]
- Bergmann A, Zygmunt M, Clapp J.F. Running throughout pregnancy: effect on placental villous vascular volume and cell proliferation. Placenta. 2004;25:694–698. doi: 10.1016/j.placenta.2004.02.005. [DOI] [PubMed] [Google Scholar]
- Bonds D.R, Mwape B, Kumar S, Gabbe S.G. Human fetal weight and placental weight growth curves. A mathematical analysis from a population at sea level. Biol. Neonate. 1984;145:261–274. doi: 10.1159/000242016. [DOI] [PubMed] [Google Scholar]
- Catalano P.M, Tyzbir E.D, Allen S.R, McBean J.H, McAuliffe T.L. Evaluation of fetal growth by estimation of neonatal body composition. Obstet. Gynecol. 1992;79:46–50. [PubMed] [Google Scholar]
- Catalano P.M, Drago N.M, Amini S.B. Maternal carbohydrate metabolism and its relationship to fetal growth and body composition. Am. J. Obstet. Gynecol. 1995a;172:1464–1470. doi: 10.1016/0002-9378(95)90479-4. [DOI] [PubMed] [Google Scholar]
- Catalano P.M, Drago N.M, Amini S.B. Factors affecting fetal growth and body composition. Am. J. Obstet. Gynecol. 1995b;172:1459–1463. doi: 10.1016/0002-9378(95)90478-6. [DOI] [PubMed] [Google Scholar]
- Christiansen E, Garby L, Sorenson T. Quantitative analysis of the energy requirements for development of obesity. J. Theor. Biol. 2005;234:99–106. doi: 10.1016/j.jtbi.2004.11.012. [DOI] [PubMed] [Google Scholar]
- Clapp J.F. Effect of dietary carbohydrate on the glucose and insulin response to mixed caloric intake and exercise in both non pregnant and pregnant women. Diab. Care. 1998;21:B107–B112. [PubMed] [Google Scholar]
- Clapp J.F. Maternal carbohydrate intake and pregnancy outcome. Proc. Nutr. Soc. 2002;61:45–50. doi: 10.1079/pns2001129. [DOI] [PubMed] [Google Scholar]
- Clapp J.F. The effects of maternal exercise on fetal oxygenation and feto-placental growth. Eur. J. Obstet. Gynecol. 2003;110:S80–S85. doi: 10.1016/S0301-2115(03)00176-3. [DOI] [PubMed] [Google Scholar]
- Clapp J.F. Influence of endurance exercise and diet on human placental development and fetal growth. Placenta. 2006;27:527–534. doi: 10.1016/j.placenta.2005.07.010. [DOI] [PubMed] [Google Scholar]
- Clapp J.F, Kim H, Burciu B, Lopez B. Beginning regular exercise in early pregnancy: effect on fetoplacental growth. Am. J. Obstet. Gynecol. 2000;183:1484–1488. doi: 10.1067/mob.2000.107096. [DOI] [PubMed] [Google Scholar]
- Clapp J.F, Kim G, Burciu B, Schmidt S, Petry K, Lopez B. Continuing regular exercise during pregnancy: effect of exercise volume on fetoplacental growth. Am. J. Obstet. Gynecol. 2002;186:142–147. doi: 10.1067/mob.2002.119109. [DOI] [PubMed] [Google Scholar]
- Elia M. Organ and tissue contribution to metabolic rate in energy metabolism. In: Kinney J.M, Tucker H.N, editors. Energy metabolism: tissue determinants and cellular corollaries. Raven; New York, NY: 1992. pp. 19–60. [Google Scholar]
- Felder R.M, Rousseau R.W. 3rd edn. Wiley; New York, NY: 1999. Elementary principles of chemical processes. [Google Scholar]
- Forbes G. Springer; New York, NY: 1987. Human body composition. [Google Scholar]
- Fraser R.B, Ford F.A, Lawrence G.F. Insulin sensitivity in third trimester pregnancy. A randomized study of dietary effects. Br. J. Obstet. Gynaecol. 1988;95:223–229. doi: 10.1111/j.1471-0528.1988.tb06861.x. [DOI] [PubMed] [Google Scholar]
- Geirsson R.T, Ogston S.A, Patel N.B, Christie A.D. Growth of total intrauterine, intra-amniotic and placental volume in normal singleton pregnancy measured by ultrasound. Br. J. Obstet. Gynaecol. 1985;92:46–53. doi: 10.1111/j.1471-0528.1985.tb01047.x. [DOI] [PubMed] [Google Scholar]
- Hall K.D. Computational model of in vivo human energy metabolism during semi-starvation and re-feeding. Am. J. Physiol. Endocrinol. Metab. 2006;291:E23–E37. doi: 10.1152/ajpendo.00523.2005. [DOI] [PMC free article] [PubMed] [Google Scholar]
- Hibbert J.M, Davidson S, Hall J.S, Jackson A.A. Maternal pre-pregnancy weight and placental weight determine birth weight in normal Jamaican infants. West Indian Med. J. 1999;48:216–220. [PubMed] [Google Scholar]
- Jackson M.R, Gott P, Lye S.J, Knox Ritchie J.W, Clapp J.F. The effects of maternal aerobic exercise on human placental development: placental volumetric composition and surface areas. Placenta. 1995;16:179–191. doi: 10.1016/0143-4004(95)90007-1. [DOI] [PubMed] [Google Scholar]
- Kennaugh J.M, Hay W.W.J. Nutrition of the fetus and newborn. West. J. Med. 1987;147:435–448. [PMC free article] [PubMed] [Google Scholar]
- Koo W.W, Walters J.C, Hockman E.M. Body composition in neonates: relationship between measured and derived anthropometry with dual-energy X-ray absorptiometry measurements. Pediatr. Res. 2004;56:694–700. doi: 10.1203/01.PDR.0000142587.59238.BD. [DOI] [PubMed] [Google Scholar]
- Landrigan P.J, Sonawane B, Butler R.N, Trasande L, Callan R, Droller D. Early environmental origins of neurodegenerative disease in later life. Environ. Health Perspect. 2005;113:1230–1233. doi: 10.1289/ehp.7571. [DOI] [PMC free article] [PubMed] [Google Scholar]
- Maloni J.A, Alexander G.R, Schluchter M.D, Shah D.M, Park S. Antepartum bed rest: maternal weight change and infant birth weight. Biol. Res. Nurs. 2004;5:177–186. doi: 10.1177/1099800403260307. [DOI] [PubMed] [Google Scholar]
- McArdle W.D, Katch F.I, Katch V.L. Lippincott, Williams and Wilkins; London, UK: 2001. Exercise physiology: energy, nutrition, and human performance. [Google Scholar]
- McLaughlin C.C, Baptiste M.S, Schymura1 M.J, Nasca P.C, Zdeb M.S. Birth weight, maternal weight and childhood leukaemia. Br. J. Cancer. 2006;94:1738–1744. doi: 10.1038/sj.bjc.6603173. [DOI] [PMC free article] [PubMed] [Google Scholar]
- McMillen I.C, Adam C.L, Mühlhäusler B.S. Early origins of obesity: programming the appetite regulatory system. J. Physiol. 2005;565:9–17. doi: 10.1113/jphysiol.2004.081992. [DOI] [PMC free article] [PubMed] [Google Scholar]
- Moses R.G, Luebcke M, Davis W.S, Coleman K.J, Tapsell L.C, Petocz P, Brand-Miller J.C. Effect of a low-glycemic-index diet during pregnancy on obstetric outcomes. Am. J. Clin. Nutr. 2006;84:807–812. doi: 10.1093/ajcn/84.4.807. [DOI] [PubMed] [Google Scholar]
- Moulton C.R. Age and chemical development in mammals. J. Biol. Chem. 1923;57:79–97. [Google Scholar]
- Osmond C, Barker D.J. Fetal, infant, and childhood growth are predictors of coronary heart disease, diabetes, and hypertension in adult men and women. Environ. Health Perspect. 2000;108:545–553. doi: 10.2307/3454545. [DOI] [PMC free article] [PubMed] [Google Scholar]
- Padoan A, Rigano S, Ferrazzi E, Beaty B.L, Battaglia F.C, Galan H.L. Differences in fat and lean mass proportions in normal and growth-restricted fetuses. Am. J. Obstet. Gynecol. 2004;191:1459–1464. doi: 10.1016/j.ajog.2004.06.045. [DOI] [PubMed] [Google Scholar]
- Paneth N. The impressionable fetus? Fetal life and adult health. Am. J. Public Health. 1994;84:1372–1374. doi: 10.2105/ajph.84.9.1372. [DOI] [PMC free article] [PubMed] [Google Scholar]
- Parretti E, et al. Sonographic evaluation of fetal growth and body composition in women with different degrees of normal glucose metabolism. Diab. Care. 2003;26:2741–2748. doi: 10.2337/diacare.26.10.2741. [DOI] [PubMed] [Google Scholar]
- Ravelli G.P, Stein Z.A, Susser M.W. Obesity in young men after famine exposure in utero and early infancy. N. Engl. J. Med. 1976;295:349–353. doi: 10.1056/NEJM197608122950701. [DOI] [PubMed] [Google Scholar]
- Salsberry P.J, Reagan P.B. Dynamics of early childhood overweight. Pediatrics. 2005;116:1329–1338. doi: 10.1542/peds.2004-2583. [DOI] [PMC free article] [PubMed] [Google Scholar]
- Scholl T.O, Xinhua C, San Khoo C, Lenders C. The dietary glycemic index during pregnancy: influence on infant birth weight, fetal growth, and biomarkers of carbohydrate metabolism. Am. J. Epidemiol. 2004;159:467–474. doi: 10.1093/aje/kwh068. [DOI] [PubMed] [Google Scholar]
- Song B, Thomas D.M. Dynamics of starvation in humans. J. Math. Biol. 2007;54:27–43. doi: 10.1007/s00285-006-0037-7. (Epub 2006) [DOI] [PubMed] [Google Scholar]
- Sparks J.W. Human intrauterine growth and nutrient accretion. Semin. Perinatol. 1984;8:74–93. [PubMed] [Google Scholar]
- Starfield B, Budetti P.P. Child health status and risk factors. Health Serv. Res. 1985;6:817–886. [PMC free article] [PubMed] [Google Scholar]
- Thame M, Osmond C, Wilks R, Bennett F.I, Forrester T.E. Second-trimester placental volume and infant size at birth. Am. J. Obstet. Gynecol. 2001;98:279–283. doi: 10.1016/S0029-7844(01)01414-4. [DOI] [PubMed] [Google Scholar]
- Thame M, Osmond C, Bennett F, Wilks R, Forrester T. Fetal growth is directly related to maternal anthropometry and placental volume. Eur. J. Clin. Nutr. 2004;58:894–900. doi: 10.1038/sj.ejcn.1601909. [DOI] [PubMed] [Google Scholar]
- Usher R, McLean F. Intrauterine growth of live-born Caucasian infants at sea level: standards obtained from measurements in 7 dimensions of infants born between 25 and 44 weeks of gestation. J. Pediatr. 1969;74:901–910. doi: 10.1016/S0022-3476(69)80224-6. [DOI] [PubMed] [Google Scholar]
- Widdowson E, Dickerson J.W.T. Mineral metabolism. vol. 2:A. Academic Press; London, UK: 1964. Chemical composition of the body. [Google Scholar]
- Widdowson E, Spray C.M. Chemical composition in utero. Arch. Dis. Child. 1951;26:205–214. doi: 10.1136/adc.26.127.205. [DOI] [PMC free article] [PubMed] [Google Scholar]


