Abstract
The nonlinear response of gas bubbles to acoustic excitation is an important phenomenon in both the biomedical and engineering sciences. In medical ultrasound imaging, for example, microbubbles are used as contrast agents on account of their ability to scatter ultrasound nonlinearly. Increasing the degree of nonlinearity, however, normally requires an increase in the amplitude of excitation, which may also result in violent behaviour such as inertial cavitation and bubble fragmentation. These effects may be highly undesirable, particularly in biomedical applications, and the aim of this work was to investigate alternative means of enhancing nonlinear behaviour. In this preliminary report, it is shown through theoretical simulation and experimental verification that depositing nanoparticles on the surface of a bubble increases the nonlinear character of its response significantly at low excitation amplitudes. This is due to the fact that close packing of the nanoparticles restricts bubble compression.
Keywords: bubbles, nonlinear dynamics, microbubbles, nanoparticles, ultrasound
1. Theoretical prediction
In order to predict the effect of particles on the dynamic behaviour of a bubble excited by an acoustic field, a modified Rayleigh–Plesset equation was derived, whereby the radial oscillations of a bubble coated with a surfactant layer containing particles of a given size and concentration are described by
| (1.1) |
where R is the instantaneous radius of the bubble; R0 is its initial value; p0 is the ambient pressure; σ0 is the initial interfacial tension; Γ0 is the initial concentration of the surfactant on the bubble surface; x and K are constants for the surfactant; and are the velocity and acceleration of the bubble wall, respectively; ρL is the density and μL the viscosity of the surrounding fluid; pA is the pressure due to the applied sound field; pG is the pressure of the gas inside the bubble; Rx is the limiting bubble radius beneath which the surface buckles; and B and ηs0 are again constants for the individual surfactant. Further details of the treatment of the surfactant coating may be found in Stride (2008). The original equation for an uncoated bubble is given by Plesset & Prosperetti (1977).
The effect of the particles is described by the quantity G that is defined as
| (1.2) |
where fp is the fractional surface area coverage that defines the limiting radius Rlim at which the particles would be expected to reach their square packing density in two dimensions and beyond which the bubble's resistance to further compression would be expected to increase by a factor determined by the compressibility of the particles. This is represented by the quantity X, which is estimated from the ratio of the effective shear moduli of the particles and the surfactant coating.
The pressure prad radiated by the bubble at a distance r from its centre may be predicted using Vokurka (1990)
| (1.3) |
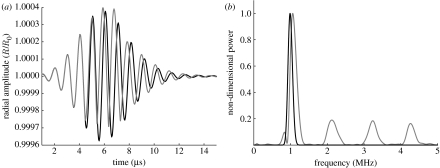
Equations (1.1) and (1.3) were solved numerically using purpose-written code in Matlab R2006b (The Mathworks, Inc., Natick, MA, USA) implementing a fourth-order Runge–Kutta procedure (Matlab function ODE45) for the following set of parameters: R0=75 μm; p0=0.1 MPa; σ0=0.05 N m−1; Γ0=2.25×10¹⁷ m−2; x=0; K=1.5×10⁻¹⁴ N m; ρL=1000 kg m−3; μL=0.0015 Pa s; ; ηs0=1.5×10⁻⁴ N s m−1; Rx=0.8R0; B=0; fp=0.78; X=8; ; τ=n/2f; f=1 MHz; n=10; and A=25 kPa. The results are shown in figure 1.
Figure 1.
Amplification of bubble nonlinear response due to the presence of nanoparticles on the bubble surface. (a) Simulation of the radial oscillations of a bubble (normalized with respect to the initial diameter R0=75 μm) excited by an ultrasound pulse with centre frequency 1 MHz and peak negative pressure 25 kPa. The grey and black curves (overlapping during the first two cycles) show the response of a bubble with and without nanoparticles, respectively. (b) Frequency spectrum for the scattered ultrasound field produced as a result of the oscillations shown in (a). The backscattered power is plotted normalized with respect to the maximum.
2. Experimental verification
2.1 Preparation of gold suspension
Small gold colloids with an average diameter of approximately 15 nm ±10% were synthesized according to the sodium citrate reduction method (Enustun & Turkevich 1963) by boiling 95 ml of 5×10⁻⁴ M tetrachloroauric acid (HAuCl4) solution and adding 5 ml of a warm sodium citrate solution (1 wt%). A small amount of surfactant, polyethylene glycol 40 stearate (PEG40S), was added to the gold suspension and dispersed using a sonicator (Misonix XL200, Labcaire, Dorset, UK) operating at an average power of 8 W (varied continuously between levels 1 and 6) for 240 s, to yield an aqueous suspension containing 0.06 wt% gold nanoparticles and 0.01 wt% PEG40S. Suspensions containing only water and PEG40S were also prepared in the same manner. All chemicals were purchased from Sigma Aldrich Ltd (Poole, Dorset, UK) and solutions prepared using Milli-Q water (R>18.2 Ω mm).
2.2 T-junction bubble preparation
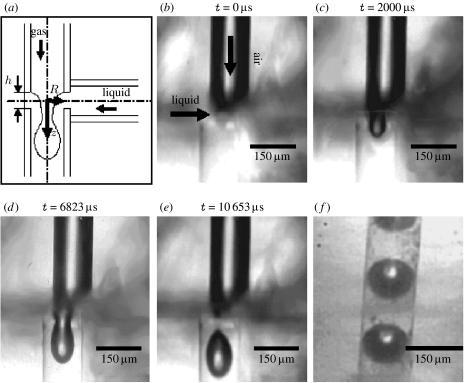
Details of the specially designed and constructed T-junction may be found in Pancholi et al. (2008). Briefly, the ends of two Teflon capillaries having 150 μm internal diameter were axially aligned and encased within a rigid polymer block (10 mm thick) separated by a distance h of 70 μm. A third tube was inserted into the polymer block with its axis perpendicular to those of the other tubes to facilitate a complete T-junction (figure 2a). The upper tube of the T-junction was connected to a pressurized tank supplying gas at constant pressure (32 kPa). The lower perpendicular tube was connected to a 20 ml stainless-steel syringe (KD Scientific, Holliston, MA, USA) supplying the liquid suspension (PEG40S with or without gold nanoparticles) at a constant flow rate of 0.4 ml min−1, controlled by a precision syringe pump (Harvard Apparatus, Holliston, MA, USA). Bubbles were collected at the end of the third (outlet) tube of the T-junction and examined via either optical or electron microscopy (see below). Real-time video images of bubble formation (figure 2b–e) were taken with a Phantom V5 high-speed camera (Vision Research Ltd, Bedford, UK) using the manufacturer-supplied software (v. 605.2) at 5× magnification and exposure times between 15 and 43 μs.
Figure 2.
T-junction bubble generation. (a) Schematic of the T-junction apparatus. (b) Air meets liquid at the T-junction and two-phase flow is established. The introduction of air reduces the cross-sectional area occupied by the liquid and, since the volume flow rate is regulated by a precision syringe pump, this results in a sharp increase in pressure at the T-junction and the ‘pinching-off’ of a bubble shown by sequence (c–e). Bubble generation is continuous as illustrated in (f).
2.3 Transmission electron microscopy
Bubbles were collected directly on standard transmission microscopy copper grids of 10 μm aperture and immediately frozen at −30°C. They were then transferred to a freeze dryer (Mini-Lyotrap, LTE Scientific Ltd, Oldham, UK) and maintained at −10°C for 18 hours to facilitate freeze drying. The freeze-dried structures were investigated using JEOL JEM 100CX and JEOL JEM 2010 transmission electron microscopes (JEOL (UK) Ltd, Welwyn Garden City, UK); the latter was equipped with an Inca ISIS system (Oxford Instruments, Oxford, UK), which was used to carry out energy-dispersive X-ray analysis. All transmission electron microscope images were recorded on film and digitally scanned at high resolution (300 dpi).
2.4 Measurement of ultrasound backscattered power
Bubble suspensions were also collected directly for ultrasonic characterization in a measurement chamber consisting of a section of polymethylmethacrylate tubing (diameter 60 mm, length 30 mm) with acoustic ‘windows’, of polyethylene film (thickness 50 μm), at each end. The chamber was fixed on the base of a large water bath filled with distilled water at ambient temperature, with its axis at 45° to that of the ultrasound beam. An unfocused bespoke broadband immersion piezoelectric transducer (diameter 20 mm, nominal centre frequency 1 MHz) was used as both transmitter and receiver for the experiments. The transducer was connected to a precision scanning rig to enable accurate positioning and excited using a pulser/receiver (Panametrics model 5072 PR, Olympus NDT, Lancashire, UK) set to give a transmitted peak negative pressure in water of approximately 25 kPa. This pressure was chosen in order to minimize bubble destruction and any distortion of the results due to nonlinear propagation. The beam profile was measured using a needle hydrophone (Precision Acoustics Ltd, Dorchester, UK), and the absence of harmonic content was verified by the examination of the signal frequency spectrum for transmission in water. Broadband pulses were transmitted at a pulse repetition frequency of 0.2 kHz and captured at 50 mega-samples s−1 on a digital oscilloscope (LeCroy 9310M Dual 300 MHz, LeCroy Corp., Chestnut Ridge, NY, USA). The captured signals were processed in Matlab using purpose-written code whereby each signal was normalized with respect to its mean value and its frequency spectrum obtained via fast Fourier transform (Matlab function, fft).
3. Results and discussion
In the absence of any particles on its surface, a bubble would be expected to exhibit symmetrical radial oscillations in response to a low-intensity ultrasound field, as shown by the black curve in figure 1a. The presence of particles, however, prevents the bubble from expanding and contracting with equal amplitude, due to the packing together of the particles during compression. This results in expansion-dominated oscillations as shown by the grey curve in figure 1a, which, despite their low amplitude, are highly nonlinear on account of this asymmetry. Figure 1b shows the frequency spectra for the scattered pressure from two bubbles as predicted by equation (1.3), with and without nanoparticles on their surfaces (fp≈0.78 and 0, respectively, based on averaged calculations from the electron micrographs). As expected, both spectra contain a large component at the frequency of the sound field exciting the bubbles (1 MHz); but whereas this is the only peak for the particle-free bubble, in contrast, the spectrum for the particle-coated bubble also contains higher harmonics of this frequency, which represent a significant proportion of the total scattered power (more than 75% based on numerical integration of the curve in figure 1b). This indicates the substantial increase in nonlinear behaviour produced by the nanoparticles. For the particle-free bubble to produce a similar response, it would need to be driven at a much higher amplitude (more than 10 times the acoustic peak negative pressure).
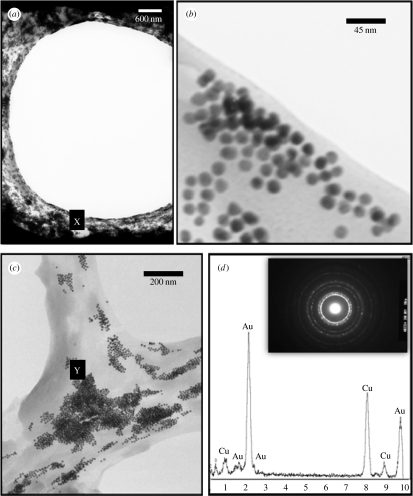
The aim of the experimental work was to investigate whether these effects could be observed in practice. As shown in figure 2, the T-junction device enabled near-monodisperse bubbles (150 μm diameter determined via optical microscopy) to be prepared from aqueous suspensions of PEG40S with and without gold nanoparticles. It was assumed that the bubble coating would form spontaneously as a result of the amphiphilic nature of the surfactant molecules and this was confirmed by transmission electron microscopy (figure 3a–c) and energy-dispersive X-ray analysis (figure 3d), which shows that the gold particles were deposited at the surface of the bubbles, creating an outer layer a few hundred nanometres thick.
Figure 3.
Transmission electron micrographs of freeze-dried bubbles prepared using the T-junction device (figure 2). (a) Cross-section through a bubble showing the gold nanoparticles concentrated at the surface. (b) Magnified image of region ‘X’ in (a), showing 15 nm diameter gold particles. (c) Distribution of gold nanoparticles at the interface of three adjacent bubbles. (d) Energy-dispersive X-ray analysis and selected-area diffraction pattern of point ‘Y’ in (c) confirming the presence of gold at the bubble surface.
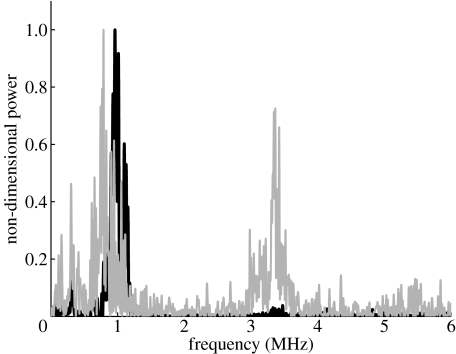
Figure 4 shows the frequency spectra from the ultrasound backscattering measurements for the two types of bubble. As may be seen, the response of the bubbles coated with PEG40S only is predominantly at the excitation frequency, i.e. the bubbles were responding linearly, as would be expected for the low insonation pressure used. The spectrum for the nanoparticle-coated bubbles, however, contains a significant number of harmonics: 80% of the total scattered power compared with 25% for the PEG40S-only bubbles (from numerical integration of the curves in figure 4) indicating that their behaviour was nonlinear despite the low-amplitude excitation. The amplitudes of the individual frequency components were different from those predicted from equations (1.1) and (1.3), but this was not entirely unexpected given that the theoretical model considers only two-dimensional packing of the nanoparticles, whereas the three-dimensional case may give rise to more complex dynamics and hence a more complex frequency spectrum.
Figure 4.
Experimental measurements of backscattered ultrasound power showing the amplification of nonlinear behaviour. The black curve shows the frequency spectrum for the backscattered power from a suspension of surfactant (PEG40S)-coated bubbles. The grey curve shows the frequency spectrum for a similar suspension containing bubbles of equal size and concentration, but coated with both PEG40S and gold nanoparticles (cf. figure 3). The sound field parameters are as specified for figure 1.
It should be noted that, although the bubbles in this study were 150 μm in diameter, smaller (less than 10 μm) or larger (mm) bubbles could be prepared via appropriate modification of the apparatus. It is also possible to vary the concentration of particles on the bubble surface, as well as the size and type of the particles, which offers an additional measure of control over bubble behaviour. The effect of changing size would be to alter the resonance frequency of the bubbles (Medwin 1977) and hence the range of frequencies at which enhanced nonlinear behaviour would be observed. Simulations of the behaviour of bubbles of different sizes using equation (1.1) indicate that similar effects to those observed in this work would be expected at a range of scales from micrometres to millimetres. In fact, more pronounced amplification of the nonlinear response was predicted in most cases. This may be due to the fact that the bubbles in this study were actually being excited well above the frequency at which resonance would be expected, based on an analysis similar to that applied by Medwin.
The ability to modify the behaviour of bubbles in this way may potentially be exploited in a range of applications. In ultrasound imaging, for example, where bubbles are used as contrast agents, increasing the harmonic content of the scattered sound field will enable them to be detected at lower ultrasound intensities. This minimizes the risk of cell damage and facilitates imaging at greater tissue depths, although the safety of the particle-coated bubbles themselves would, of course, have to be assessed. It also minimizes unwanted bubble destruction, which is beneficial for both imaging and therapeutic applications such as drug delivery and gene therapy where bubbles are used as encapsulation vehicles and premature destruction would be highly undesirable (Harvey et al. 2002). Similarly, increasing the strength of flow phenomena such as microstreaming around the bubble could assist cell permeabilization for drug/gene delivery (Marmottant & Hilgenfeldt 2003) and could also be useful in other applications where these effects are exploited, for example microfluidic devices (Marmottant et al. 2006).
4. Conclusion
In this report, it has been shown theoretically and experimentally that by depositing nanoparticles on the surface of a bubble, the nonlinear character of its response to acoustic excitation can be increased significantly even at low amplitudes. This is due to the fact that close packing of the nanoparticles restricts bubble compression. Further investigations of this phenomenon and its applications are currently being undertaken.
Acknowledgments
The authors would like to thank the Engineering and Physical Sciences Research Council and the Royal Academy of Engineering for supporting this work (EP/E012434/1, EP/E 045839 and GR/S52636), Prof. Luis Liz-Marzan of the University of Vigo, Spain, for the provision of the gold nanoparticle suspensions and the Chemistry and Materials Departments of the University of London for technical assistance with the microscopy.
References
- Enustun B, Turkevich J. Coagulation of colloidal gold. J. Am. Chem. Soc. 1963;85:3317–3328. doi: 10.1021/ja00904a001. [DOI] [Google Scholar]
- Harvey C, Plicher J, Eckersley R, Blomley M, Cosgrove D. Advances in ultrasound. Clin. Radiol. 2002;57:157–177. doi: 10.1053/crad.2001.0918. [DOI] [PubMed] [Google Scholar]
- Marmottant P, Hilgenfeldt S. Controlled vesicle deformation and lysis by single oscillating bubbles. Nature. 2003;423:153–156. doi: 10.1038/nature01613. [DOI] [PubMed] [Google Scholar]
- Marmottant P, Raven J, Gardeniers H, Bomer J, Hilgenfeldt S. Microfluidics with ultrasound driven bubbles. J. Fluid Mech. 2006;568:109–118. doi: 10.1017/S0022112006002746. [DOI] [Google Scholar]
- Medwin H. Counting bubbles acoustically—a review. Ultrasonics. 1977;15:7–13. doi: 10.1016/0041-624X(77)90005-1. [DOI] [Google Scholar]
- Pancholi K.P, Farook U, Moaleji R, Stride E, Edirisinghe M.J. Novel methods for preparing phospholipid coated microbubbles. Eur. Biophys. J. 2008;37:515–520. doi: 10.1007/s00249-007-0211-x. [DOI] [PubMed] [Google Scholar]
- Plesset M, Prosperetti A. Bubble dynamics and cavitation. Annu. Rev. Fluid Mech. 1977;9:145–185. doi: 10.1146/annurev.fl.09.010177.001045. [DOI] [Google Scholar]
- Stride E. The influence of surface adsorption on bubble dynamics. Phil. Trans. R. Soc. A. 2008;366:2103–2115. doi: 10.1098/rsta.2008.0001. [DOI] [PubMed] [Google Scholar]
- Vokurka K. Amplitudes of free bubble oscillations in liquids. J. Sound Vibrat. 1990;141:259–275. doi: 10.1016/0022-460X(90)90839-R. [DOI] [Google Scholar]


