

Abstract
In malignant gliomas, the integrin adhesion receptors seem to play a key role for invasive growth and angiogenesis. However, there is still a controversy about the expression and the distribution of αvβ3 integrin caused by malignancy. The aim of our study was to assess the extent and pattern of αvβ3 integrin expression within primary glioblastomas (GBMs) compared with low‐grade gliomas (LGGs). Tumor samples were immunostained for the detection of αvβ3 integrin and quantified by an imaging software. The expression of αvβ3 was found to be significantly higher in GBMs than in LGGs, whereby focal strong reactivity was restricted to GBMs only. Subsequent analysis revealed that not only endothelial cells but also, to a large extent, glial tumor cells contribute to the overall amount of αvβ3 integrin in the tumors. To further analyze the integrin subunits, Western blots from histologic sections were performed, which demonstrated a significant difference in the expression of the β3 integrin subunit between GBMs and LGGs. The presented data lead to new insights in the pattern of αvβ3 integrin in gliomas and are of relevance for the inhibition of αvβ3 integrin with specific RGD peptides and interfering drugs to reduce angiogenesis and tumor growth.
Keywords: angiogenesis, glioma, integrin αvβ3, integrin immunohistochemistry, tumor vasculature
INTRODUCTION
Gliomas are the most common brain‐derived neoplasms with glioblastoma (GBM) multiforme being the most frequent and also the most malignant subtype. Marked tumor cell proliferation, rapid invasion into the surrounding brain tissue and intense microvascular angiogenesis are the biologic hallmarks of malignant gliomas 25, 26, 34. They depend on the complex interactions of tumor cells with the extracellular matrix (ECM) and neighboring endothelial cells as well as various other cell types 14, 40. These mechanisms include signaling via integrins, which are involved in adhesive properties of proliferating cells and play fundamental roles in the regulation of migration and invasion of tumor cells as well as of neoangiogenesis 23, 36. The integrin family consists of 24 different heterodimeric receptors of two transmembrane subunits of which the 18α and 8β subunits are known at present 5, 23, 41. In contrast to many other cell‐surface receptors, integrins are not only able to transduce signals to the interior of the cells (“outside‐in” signaling) but can also transmit information about the activational state of the cells to their microenvironment (“inside‐out” signaling) 13, 41.
The integrins αvβ3 and αvβ5 have been demonstrated to be necessary for tumor‐induced angiogenesis in a variety of tumors, particularly malignant gliomas via basic fibroblast growth factor (bFGF) and tumor necrosis factor α (TNF‐α) 9, 10, 15. Indeed, integrin αvβ3 has been found to be located in small blood vessels in GBMs, where it is thought to promote the extensive tumor progression, while in the tissue of the normal brain, it is barely detectable (16). Interestingly, immunohistochemical studies of autopsy material from patients with brain tumors revealed that the expression of integrin αvβ3 might not be restricted only to proliferating endothelial cells (32). Integrin αvβ3 was also detected and colocalized with matrix metalloproteinase 2 (MMP‐2) at the surface of invasive tumor cells 6, 11. Yet, the level of αvβ3 integrin expression and its cellular distribution caused by malignancy has not been expounded up to now. This has become even more important as αvβ3 integrin antagonists have reached phase I/IIa clinical trials in patients with malignant gliomas, where they are used in combination with temozolomide as an antiangiogenic therapy. The current study was undertaken to elucidate the expression level and pattern of the integrin αvβ3 in high‐ and low‐grade gliomas (LGGs) by analysis of snap‐frozen tumor samples.
MATERIALS AND METHODS
Patients and tissue samples
The brain tissues were obtained from 20 primary GBMs, corresponding to the World Health Organization (WHO) grade IV, and five diffuse astrocytomas, corresponding to WHO grade II. Written informed consent was obtained from all patients for the scientific use of tumor tissue. The histologic diagnosis was made on paraffin sections according to the WHO criteria (25). For the immunohistochemical analysis of αvβ3 integrin expression (GBM: n = 12; LGG: n = 4; histologically suitable quality) and Western blot analysis (GBM: n = 20; LGG: n = 5), corresponding tissue samples were snap frozen in liquid nitrogen and processed as described below. Additionally, samples of five different solid peripheral tumors (malignant melanoma, neurofibroma, skin cancer metastases, malignant fibrillary histiocytoma and sarcoma; n = 1 each) were processed (kindly provided by the Department of Pathology, Technical University of Munich, Munich, Germany).
Histologic and immunohistochemical staining
Paraffin sections For the histologic tumor grading, tissues from all patients were fixed for at least 24 h in phosphate‐buffered formalin (4%, pH 7.3), dehydrated in graded ethanol followed by xylol and embedded in hot paraffin. Sections (6 µm) were cut from a cold paraffin block and mounted on slides. After drying and deparaffination in graded alcohol, routinely Hematoxilin & Eosin (H&E), Elastica van Gieson and Gomorri stains were performed. Additional immunohistochemical investigations included the proliferation index by staining proliferation marker MIB‐1 and glial fibrillary acid protein (GFAP) according to standard procedures (antibodies were obtained from DakoCytomation, Hamburg, Germany).
Cryosections Cryosections of 6‐µm thickness (GBM: n = 12; LGG: n = 4; histologically suitable quality) were mounted on glass slides (Superfrost Plus, Menzel, Braunschweig, Germany) and postfixed with 4% paraformaldehyde and acetone (each 10 minutes at 4°C). After a short equilibration in phosphate‐buffered saline (pH 7.3) over 10 minutes at room temperature, immunohistochemical stains were performed simultaneously and automatically to reach a maximum of accuracy (BenchMark® and software NexES v9.20, Ventana, Strasbourg, France). As primary antibodies, we used either polyclonal anti‐GFAP (1:1600, DakoCytomation, Hamburg, Germany), monoclonal anti‐CD31 (1:50, DakoCytomation, Hamburg, Germany) or monoclonal anti‐αvβ3 integrin (1:100, clone LM609, Chemicon, Temecula, CA, USA) diluted in antibody diluent (Antibody Diluent, Ventana, Strasbourg, France). The primary antibody was incubated over 32 minutes at 37°C (software: “option 1 per hand”). Respective application of polyclonal biotinylated secondary antibodies (1:150, DakoCytomation, Hamburg, Germany, secondary antibody incubation 32 minutes at 37°C, software: “option 2 by dispenser”) was followed by alkaline phosphatase conjugated streptavidin (enhanced SA‐AP over 12 minutes, Ventana, Strasbourg, France). Visualization was achieved by the generation of Fast Red over 20 minutes at room temperature as prescribed by the manufacturer (enhancer/naphthol 4 minutes, Fast Red A 8 minutes, Fast Red B 8 minutes, Ventana, Strasbourg, France). Subsequently, the slides were counterstained with hematoxylin (hematoxylin 4 minutes, bluing reagent 4 minutes) and 4′‐6‐Diamidino‐2‐phenylindole (DAPI). The slides were dehydrated by an ascending ethanol sequence (50%, 70%, 98%, 100%) and xylene, and finally covered.
All immunohistochemical staining procedures and antibody concentrations were adjusted to avoid overstaining (saturation), understaining (beyond detection limit) or non‐specific background artifacts. In detail, for staining αvβ3 integrin, series of dilutions of the secondary antibody (previous incubation without primary antibody) were performed on positive control (xenotransplanted human M21 melanoma cells expressing αvβ3, see below) to determine the highest concentration where no background artifacts or non‐specific binding occurred (= maximum sensitivity of secondary detection). Then, based on this setting, series of the primary antibody concentration were tested on the positive control. As staining intensity demonstrates a saturation effect, the concentration developing a moderate staining intensity (about half of the maximum intensity of a blank sample) was further used. At this concentration, no non‐specific background staining was detectable.
Murine tumor models
Xenotransplanted human melanoma cells (M21) expressing αvβ3 integrin 12, 19 served as a positive immunohistochemical control. Cell culture conditions for M21 were set up as described elsewhere (20). The experimental protocol involving animals was approved by the Committee of Veterinarian Medicine of the State of Bavaria; the handling of animals was performed according to the standards set by the Committee of Veterinarian Medicine.
To obtain the tumor tissue, the mice were injected 1.5 × 10⁶ M21 subcutaneously, which led to the formation of tumors with a diameter of approximately 8 mm within 8 weeks. Four weeks after inoculation, the tumors were dissected, cut and frozen for further processing (20).
Analysis of immunohistochemical staining
The immunohistochemical detection of αvβ3 integrin was determined by a special imaging software, which was calibrated for this purpose. Within a selected area, it measured (i) the mean intensity of the desired immunohistochemical staining and (ii) the immunohistochemically positive fraction at a desired immunohistochemical staining intensity (software written by the author B. Krebs) (33).
In detail, all sections stained in parallel were scanned through an upright microscope (Axiovert 200M and Axiocam MRc5, Carl Zeiss AG, Jena, Germany), keeping the settings including light intensity constant. In the digitized pictures (983 × 737 µm), the area of tissue was selected by excluding possible empty areas of glass light only. Consequently, the measurement was related to tissue only. Then, the selected area was scanned for immunohistochemical detection. Thereby, the software mathematically extracted the component of the desired immunohistochemical staining per pixel (Fast Red maximum emission: 580 nm) and determined its intensity. From this data, the mean intensity of the immunohistochemical staining was calculated. For calibrating the intensity measurement, a sample stained in parallel of xenotransplanted human M21 melanoma cells expressing αvβ3 was used. This sample acted as a positive control 12, 19 and was set to 100%. The tissue that was counterstained only served as a negative control (set to 0%). The procedure resulted in (i) the relative level of αvβ3 integrin expression in the respective sample (= mean immunohistochemical staining intensity). In addition, to evaluate the distribution pattern of the immunohistochemical staining intensity within the selected area, the fraction of immunohistochemically positive area at a desired intensity level was calculated. In this study, three different levels of staining intensity defined as mild, moderate or strong (about 25%, 50% and 75% of positive control) were investigated. This resulted in (ii) a quantification based on the desired levels of staining intensity (= fraction at different intensity levels).
Western blot
Parallel to the immunohistochemical stainings, Western blotting was performed from the frozen sections of the brain tumor biopsies as described elsewhere (27). In brief, frozen brain sections were cut in 6‐µm sections and mounted on glass slides (same as for immunohistochemical stainings). Afterwards, the sections were overlaid with section lysis buffer [2% sodium dodecyl sulfate (SDS), 0.05 M dithiothreiotol, 10% glycerol, 1 mm EDTA, 16 mm Tris‐HCl, pH 7.2] using a total volume of 20 µL per 10 mm2 of tissue. The solubilized tissue was collected, boiled for 10 minutes and subjected to sodium dodecyl sulfate polyacrylamide gel electrophoresis. The very small amount of tissue used in this study was not suitable for standard methods of protein measurement (eg, Bradford assay). Therefore, a protein loading control was determined separately (β‐actin, see beyond). Proteins were electrophoretically separated (New Page Gel 12%, Invitrogen, Karlsruhe, Germany) with 100 V over 24 minutes in running buffer [0.1% SDS, 1 mm EDTA, 15 mm 3‐(N‐morpholino) propansulphonic acid (MOPS), 50 mmol Tris‐HCl, pH 7.2]. After that, the proteins were transferred to a polyvinyldifluoride (PVDF) membrane (0.45 µm, Immobilon, Millipore, Eschborn, Germany) by a semidry blotting technique with freshly prepared blotting buffer (20% methanol, 192 mmol glycin, 25 mmol Tris‐base, pH 8.3). Next, the PVDF membranes were blocked in blocking buffer (0.05% w/v casein, 0.5% v/v Tween in phosphate buffer saline, pH 7.4) over 1 h at room temperature. The primary antibodies against integrin subunits (polyclonal rabbit anti‐integrin αv subunit AB1930 and polyclonal rabbit anti‐integrin β3 subunit AB1932; Chemicon, Temecula, CA, USA) were diluted in the respective blocking buffer (1:1000) and incubated overnight at 4°C. After a washing step, bound antibodies were labeled using a secondary antibody coupled to alkaline phosphatase (1:2000 polyclonal goat anti‐mouse and anti‐rabbit immunoglobulin/AP, DakoCytomation, Hamburg, Germany) over 45 minutes. Visualization followed a second washing step using chromogen nitroblue tetrazolium (NBT) salt and 5‐bromo‐4‐chloro‐3‐indulylphosphate (BCIP) according to standard protocols (28). The wet blots were scanned using a high‐resolution flatbed scanner before reprobing. For the detection of the endothelial component, the blots were reprobed with anti‐CD31 (CD31); for the assessment of the amount of tissue, Western blots were reprobed with anti‐β‐actin (Actin I‐19, Santa Cruz Biotechnology, Heidelberg, Germany) as the ubiquitous component of the cytoskeleton (21). Densitometric measurements were performed with the software TotalLab V 2.01 (Nonlinear Dynamics, Newcastle upon Tyne, UK) by using series of dilution for calibration of the concentration and a protein ladder (Invitrogen, Karlsruhe, Germany) for the calibration of the molecular weights.
PCR
For the analysis of the mRNA expression of integrin subunits αv and β3, equal amounts of tumor tissue from GBMs (n = 5) and LGG (n = 3) patients were homogenized and suspended in TRIZOL® reagent (Invitrogen, Karlsruhe, Germany). RNA was isolated according to the manufacturer's instructions (Invitrogen, Karlsruhe, Germany). The first‐strand cDNA synthesis was done by MMLV‐RT (New England Biolabs, Frankfurt, Germany). Primers were designed according to the sequences of ITAV [accession number NM_002210; forward primer (2692–2716): 5′‐CTATGAGCTGAGAAACAATGGTCC‐3′; reverse primer (3351–3373): 5′‐GCTGCTCCCTTTCTTGTTCTTC‐3′] for integrin subunit αv and ITB3 [accession number NM_00212; forward primer (1859–1881): 5′‐CTGTATCCAGCCGGGCTCCTATG‐3′; reverse primer (2346–2369): 5′‐GCCCCGGTACGTGATATT GGTGAA‐3′] for integrin subunit β3. The analysis and comparison of the sequences were performed with the DNAstar software (GATC Biotech, Konstanz, Germany). All primers were blasted against the www‐databases. PCR for amplifying total cDNA as the template was performed for up to 30 cycles with denaturation for 30 s at 95°C, annealing for 45 s at 64°C and elongation for 60 s at 72°C with the Advantage™ 2 PCR Enzyme Systems (Takara, Otsu, Japan).
Statistics
Staining intensities and densities of immunopositive structures as well as densitometric measurements of the Western blots were tested for normal distribution and groups were compared by Student's t‐test for unpaired values and unequal variances. All values were given with standard deviation.
RESULTS
Two types of patterns of αvβ3 and CD31 expression
Immunohistochemical staining of αvβ3 integrin was investigated in sections of GBMs (n = 12), diffuse low‐grade astrocytomas (n = 4) as well as non‐CNS tumors (n = 5). The expression of αvβ3 integrin was found in the microvessels as well as in the glial tumor cells. The majority of αvβ3 expression in glial tumors was located in samples from GBMs, which are characterized by extensive proliferation of pleomorphic glial cells accompanied by microvascular proliferates with branching glomeruloid vessels. A sample of an HE stain is given in Figure 1A. Figure 1C,D demonstrates the immunohistochemical stainings of an area with vital tumor (left) and a hypercellular zone (mid) surrounding the necrotic areas (right). The staining for αvβ3 integrin, shown in Figure 1C, demonstrates a high endothelium‐associated expression in this hypercellular zone. This expression is almost identical to the staining of endothelial marker CD31, as demonstrated in Figure 1D (microvascular association). Nevertheless, numerous tumor cells, especially enlarged giant pleomorphic astrocytes, show a strong immunoreactivity for the αvβ3 integrin, too. In other samples or areas with dense tumor growth, the expression of αvβ3 integrin seems to be associated to glial tumor cells as well. A typical sample is demonstrated by an overlay of fluorescent stainings of αvβ3 integrin and CD31 in Figure 1B. The small branched proliferating microvessels marked by CD31 in red are only partially colocalized with the expression of the αvβ3 integrin in green, which is predominantly located in the glial tumor cells (glial association). The nuclei are counterstained in blue. In contrast to the GBMs, a low expression of αvβ3 integrin is found in WHO grade II diffuse astrocytomas, where the staining was more diffuse and only barely associated with the microvessels ( Figure 2B).
Figure 1.
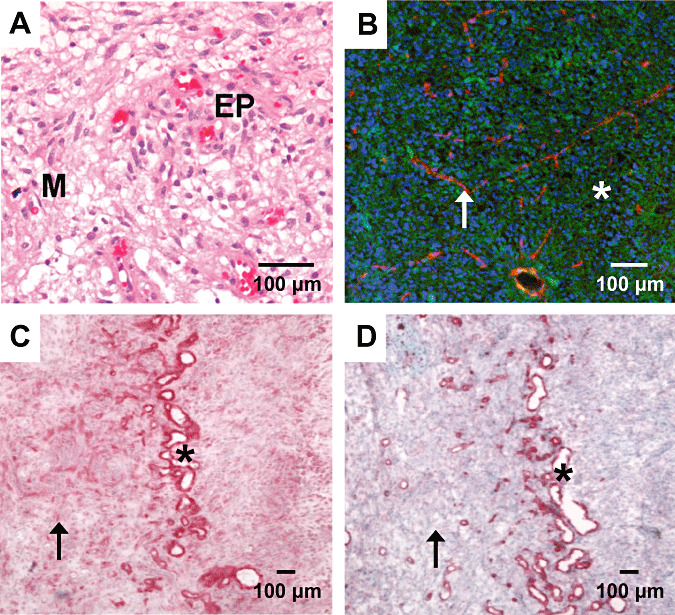
Hematoxilin & Eosin (H&E) (A) and immunostain of integrin αvβ3 (C), CD31 (D) and fluorescent overlay (B) in samples of glioblastoma. Standard H&E staining (A) shows typical morphology of a malignant glioma. Immunohistochemical staining of αvβ3 (C) is intense in vascular structures (asterisk) as confirmed by a consecutive section stained for the endothelial cell marker CD31 (D). Rather, αvβ3 is clearly detectable throughout the whole section as expressed by the glial tumor cells (arrow). A fluorescent overlay picture of another area with dense tumor growth (B) demonstrates that the integrin αvβ3 (green) is not restricted to vascular structures (red, asterisk) but shows a ubiquitous distribution pattern (cell nuclei blue). Scale bars: 100 µm. Abbreviations: EP = endothelial proliferation; M = mitosis.
Figure 2.
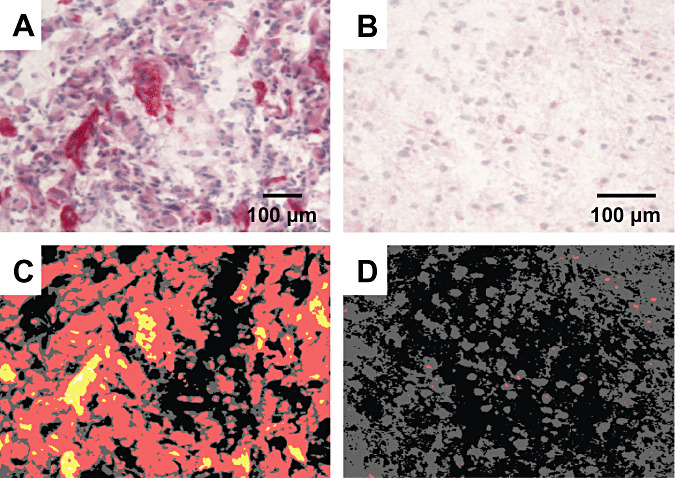
Detection of αvβ3 integrin in malignant (A) and a low‐grade (B) glioma and analysis by an imaging software (C,D). The malignant glioma (A) exhibit a much higher expression of αvβ3 integrin (red) than the low‐grade glioma (B), where only very few glial cells are immunopositive for the integrin. The detection of the staining intensity in the malignant glioma shows a large overall baseline (red) expression with certain strong (yellow) or even intense (white) expression in microvascular structures (C). In contrast, only some red dots can be detected in the low‐grade glioma (D). Scale bars: 100 µm
αvβ3 Protein expression is associated with malignancy
The different samples were simultaneously stained for αvβ3 integrin (Figure 2A,B) and analyzed via an imaging software (Figure 2C,D). The measurements were calibrated to xenotransplanted human melanoma cells (M21) expressing αvβ3. These acted as a positive control and were set to 100% integrin αvβ3 expression. The overall mean staining intensity of αvβ3 integrin in GBMs reached 76.53 ± 12.08%, which was significantly higher than in LGGs with 58.43 ± 2.30% (P < 0.05, Figure 3A). In comparison, the samples of the non‐CNS tumors reached 85.18 ± 11.95%, (P < 0.05).
Figure 3.
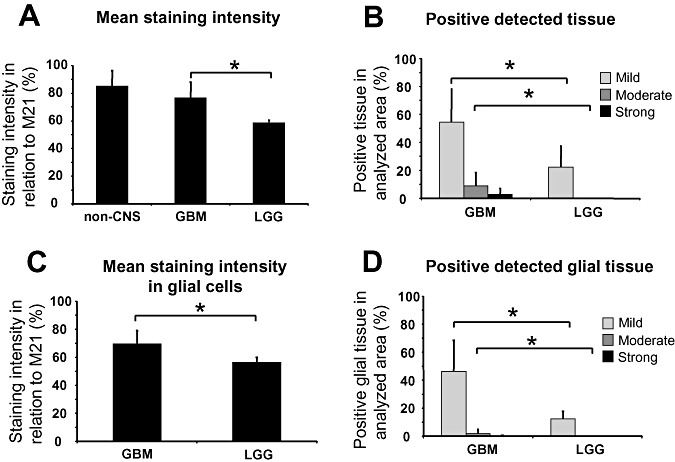
Statistical analysis of the αvβ3 integrin immunohistochemistry in patients with glioblastomas (GBMs) and low‐grade gliomas (LGGs) and non‐CNS tumors (non‐CNS). A. Mean staining intensity of non‐CNS tumors, GBMs and LGGs. B. Fraction of mild, moderate and strong stained tissue in GBMs and LGGs. C. Mean staining intensity of glial tissue only in GBMs and LGGs. D. Fraction of mild, moderate and strong stained tissue of glial tissue only in GBMs and LGGs. Significant differences (P < 0.05, Student's t‐test) are indicated with an asterisk.
To investigate the expression pattern in more detail, the fraction of immunohistochemically positive structures (density) were calculated for mild, moderate and strong positive detection of αvβ3 integrin (demonstrated by different colors in Figure 2C,D). In the samples of GBMs, 54.62 ± 23.52% of all tissue were found at least mildly stained, whereas the samples of LGGs reached only 22.20 ± 14.99% (P < 0.05, Student's t‐test; Figure 3B). The moderate staining of αvβ3 integrin was nearly exclusively associated with malignancy, with 9.07 ± 9.25% in GBMs and 0.06 ± 0.07% in low‐grade astrocytomas (P < 0.05, Student's t‐test). The strong staining intensities were restricted to GBMs only (2.83 ± 4.08%; Figure 3B). Therefore, the average αvβ3 integrin expression in GBMs exceeds αvβ3 integrin expression in LGGs by far. However, different GBMs show a very heterogeneous expression of αvβ3 integrin, which ranges from slightly to very strong integrin expression, similar to high expressing non‐CNS tumors.
Glioma cells substantially contribute to αvβ3 integrin expression
To access the glial cell specific αvβ3 integrin expression within the tumor, small areas were selected and analyzed where no endothelial structures were present. These areas showed once more a significantly higher mean staining intensity in GBMs (69.47 ± 9.49%) than in LGGs (56.41 ± 6.83%; P < 0.05). The density of immunohistochemically positive tumor cells was measured in GBMs (mild: 46.31 ± 22.23%, moderate: 2.02 ± 2.88%, strong: 0.23 ± 0.49%) and LGGs (mild: 12.31 ± 5.46%, moderate: 0.01 ± 0.01%, strong: 0%), which were significantly different (P < 0.05), although the smaller areas might increase the sampling error. The latter findings indicate that the tumor cells contribute substantially to the αvβ3 integrin expression.
In conclusion, GBMs demonstrated a higher expression of αvβ3 integrin than low‐grade astrocytomas that was not only caused by a high focal reactivity in proliferating microvessels but also by stronger expression in glial tumor cells. The pattern of αvβ3 integrin expression depended also on the subtype of tumor. In malignant gliomas, more than three quarters of the overall integrin expression (about 85%) is derived from glial tumor cells.
β3 Integrin subunit expression shows an essential difference between GBMs and LGGs in Western blot analysis
To investigate the immunohistochemical expression of integrin αvβ3 expression in more detail, we performed Western blot analysis from frozen brain tumor samples as described in the methods. Each lane was loaded with an equal tissue volume of 30 nL (5 mm2 of tissue). The Western blots were incubated with subunit specific antibody for β3 chain and αv chains. Thereby, the integrin subunits demonstrate degradation to potential cleavage products. The β3 chains were detected as weak bands at a molecular weight of about 96 kDa accompanied by their major degradation products at about 64 and 52 kDa. The heavy αv chains were detectable at 137 kDa. Further on, strong double bands were detectable at about 25 and 27 kDa, which correspond to major degradation products αv light chains. The full lengths of the αv light chains are barely detectable at about 52 kDa. Figure 4A shows the detection of integrin subunits from five different GBM patients (left five lanes; the one lane on the right demonstrates CD31 and β‐actin). The group of GBMs demonstrate a heterogenous pattern of β3 chains, whereas the portions of αv light chains were strongly present in all samples. The expression in low‐grade astrocytomas was lower, especially the β3 chains, which were barely detectable.
Figure 4.
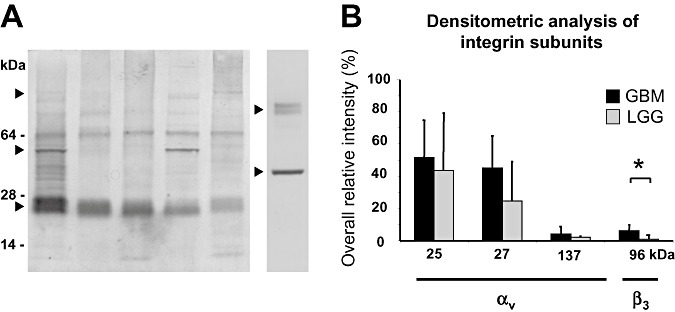
Western blot analysis of subunits and degradation products of the αvβ3 integrin. The Western blot analysis of five different glioblastoma (GBM) tissue samples (A, left lanes) and densitometric analysis of integrin subunits (B). In all glial tumors, degradation products of the αv subunit (αv light chains) were detected as a double band at 25/27 kDa (▸). Expression was constantly present but heterogeneous between different GBMs. The β3 subunit was detected at about 96 kDa (▸). Degradation products of αv and β3 subunit were found at 55 kDa (▸). The detection of CD31 at about 80 kDa (right ▸) and β‐actin at about 42 kDa (right ▸) is additionally demonstrated in the lane on the right. B. Densitometric analysis revealed significant differences for the β3 subunit between malignant gliomas and low‐grade gliomas (LGGs) (P < 0.05; Student's t‐test; indicated with an asterisk). The αv subunit (about 137 kDa) and its degradation products (αv light chains, 25/27 kDa) showed no significant differences between high‐ and low‐grade gliomas.
The densitometric analysis (Figure 4B) of the samples, calibrated by the dilution series of a reference probe, revealed an overall density of β3 chain at 96 kDa and αv light chains at 25 and 27 kDa of 102.8 ± 43.0 in GBMs (n = 20) and 69.1 ± 30.9 in low‐grade astrocytomas (n = 5), which corroborates the immunohistochemical measurements (but is not statistically significant). By comparing the β3 subunit at 96 kDa, we found a highly significantly elevated expression in GBMs with 6.18 ± 4.59 compared with LGGs with 1.07 ± 0.549 (P < 0.05; Student's t‐test, Table 1). The expressions of αv light chains at 25 and 27 kDa were not significantly different in GBMs (51.6 ± 23.0 and 45.0 ± 19.9 respectively) and in low‐grade astrocytomas (43.4 ± 35.6 and 24.6 ± 24.6, respectively).
Table 1.
Densitometric analysis of integrin subunits αv and β3 and microvascularization in glioblastomas (GBMs), low‐grade gliomas (LGGs) and non‐CNS tumors (non‐CNS). Overall density of integrin subunits αv (25/27 kDa) and β3 (96 kDa) as well as the endothelial cells (CD31; 80 kDa) of the tumors was assessed by the Western blot analysis and calibrated by a dilution series of a reference probe. In GBMs, the β3 subunit at 96 kDa showed a significantly elevated expression compared with LGGs (P<0.05; Student's t‐test). The amount of CD31 demonstrated quite different values in GBMs and in LGGs, indicating microvascular proliferation.
| αv Light chains | β3 Subunit | αv + β3 Subunit | CD31 | β‐Actin | ||
|---|---|---|---|---|---|---|
| 25 kDa | 27 kDa | 96 kDa | 25 + 27 + 96 kDa | 80 kDa | 40 kDa | |
| GBM | 51.6 ± 23.0 | 45.0 ± 19.9 | 6.18 ± 4.59 | 102.8 ± 43.0 | 25.2 ± 12.9 | 36.8 ± 22.7 |
| LGG | 43.4 ± 35.6 | 24.6 ± 24.6 | 1.07 ± 0.549 | 69.1 ± 30.9 | 4.9 ± 2.2 | 30.1 ± 13.2 |
| Non‐CNS | 36.2 ± 29.0 | 70.0 ± 36.1 | 8.1 ± 6.2 | 105.3 ± 58.0 | 34.6 ± 18.4 | 52.5 ± 41.0 |
Further on, microvascularization was assessed by Western blot analysis using the endothelial cell marker CD31, which was detected at 80 kDa (Figure 4A, right lane). Densitometric analysis demonstrated that samples of GBMs had significantly higher staining intensities (25.2 ± 12.9) than LGGs (4.9 ± 2.2, P < 0.05). The ratio of the overall integrin αvβ3 detection (sum GBMs 102.8 ± 43.0, sum LGGs 69.1 ± 30.9) to the amount of CD31 demonstrated quite different values of 4.1 in GBMs and 14.1 in LGGs, which indicates that the detection of CD31 positive endothelial cells overcomes the higher expression of αvβ3 integrin in GBMs (Table 1). Consequently, the numerous proliferating endothelial cells do not contribute at all to the αvβ3 integrin expression.
Integrin subunits αv mRNA and β3 mRNA both found in GBMs and low‐grade astrocytomas
As immunohistochemical stainings and Western blot analysis revealed an αvβ3 integrin expression in malignant GBMs and in a low level in low‐grade astrocytomas, we investigated the expression on mRNA level. Cryoconserved tissue of low‐ and high‐grade gliomas was subjected to RT‐PCR as described in the materials. Figure 5 demonstrates the PCR product after 24 to 36 recombination cycles for the subunits αv and β3 in a sample of a malignant GBM and a low‐grade astrocytoma. The mRNA of subunit αv was strongly amplified in both high‐ and low‐grade gliomas. The mRNA of the β3 subunit was also present in both tumor entities but amplified on a lower level. Therefore, on the mRNA level, both malignant GBM and low‐grade astrocytoma were able to express active αvβ3 integrin, as suggested by the previous immunohistochemistry and Western blotting, which corroborates the previous results of immunohistochemistry and Western blotting.
Figure 5.
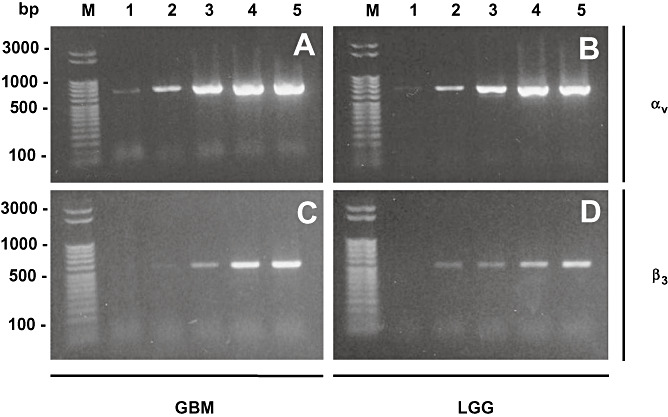
PCR analysis of αvβ3 integrin subunits. PCR analysis of αvβ3 integrin subunits αv (A,B) and β3 (C,D) of a glioblastoma (GBM; A,C) and low‐grade glioma (LGG; B,D) after different recombination cycles. Lane 1: 24 cycles, lane 2: 27 cycles, lane 3: 30 cycles, lane 4: 33 cycles and lane 5: 36 recombination cycles. Standard PCR revealed that both subunits αv (690 bp) and β3 (510 bp) are synthesized in high as well as low‐grade gliomas indicating that both tumor entities are able to express a functionally active αvβ3 integrin receptor. Marker (M) was a 50 bp ladder (Novagen, Perfect DNA ladder).
DISCUSSION
Integrins are adhesion receptors that mediate cell–cell as well as cell–ECM interactions associated with tumor growth and angiogenesis in malignant gliomas 5, 23, 31, 39. However, there is still a controversy about the extent and the distribution of αvβ3 integrin expression caused by malignancy and the cell type of origin in gliomas. In literature, 30% of glioma cells were described positive for αvβ3 integrin in anaplastic astrocytomas and GBMs, whereas LGGs did not express detectable amounts of this integrin 16, 17, 18, 38. In situ studies for the two different integrin subunits αv and β3 revealed that the expression of integrin αvβ3 was focused more on small blood vessels of GBMs 16, 38. One other group detected individual glial tumor cells of GBMs to be positive for the subunits αv and β3 (32). Only recently, Bello et al reported a more prominent expression of integrin αvβ3 on glioma cells but without providing a detailed expression pattern (5). Yet, this is a matter of major interest for therapeutic delivery of integrin αvβ3 interfering agents to reduce tumor angiogenesis and growth 7, 9, 29, 38. The efficacy of this approach is clearly dependent on the intratumoral extent and distribution of αvβ3 integrin, as it has to be supposed that mainly the endothelial cell bound αvβ3 integrin portion is reached by intravenous application.
For this reasons, the extent, distribution and pattern of integrin αvβ3 expression as well as its correlation to tumor grade were investigated. The computed immunohistochemistry and calibrated staining analysis provided high accuracy and the possibility to bypass the very crucial point of visual quantification of immunohistochemical staining results. In GBMs, a high expression of αvβ3 integrin was found not only in the endothelial cells of proliferating microvessels but also in tumor cells. The great variability of the expression might, in part, explain why the studies that have been carried out so far showed controversial results according to the amount of αvβ3 integrin and its cellular and regional distribution within the tumor. While previous reports focused more on the impact of integrin αvβ3 on angiogenesis 5, 16, we demonstrated that glial tumor cells themselves contribute significantly, accounting for approximately 85% of the overall expression of αvβ3 integrin. In contradiction to former studies, we were also able to detect integrin αvβ3 expression even in LGGs (18), but on a significantly lower level and predominantly on tumor cells, as there is a lower vascularization.
Interestingly, our miniaturized Western blot analysis revealed a significant difference only for the expression of the β3 subunit between GBMs and LGGs, whereas the αv subunit and its degradation products (12) showed no significant difference between these tumor entities. This might be caused by the fact that the integrin αv subunit is also needed with the β5 subunit to form the αvβ5 integrin, which is also abundant in highly vascularized malignant gliomas (5). Moreover, there are other β subunits (β1, β6, β8) that heterodimerize with the αv subunit, whereas the β3 subunit in brain tumors only partners with αv and with αIIb in thrombocytes 5, 18, 23, 24, 32. Therefore, the endothelial expression of αvβ3 integrin seems to be characteristic for malignant microvessel transformation, as it has already been described that the β3 subunit expression in GBMs is most prominent in endothelial and perivascular cells associated with tumor angiogenesis 5, 16, 18. Moreover, integrin αvβ3 has already been detected in colocalization with MMP‐2, where it was found to correlate with the dedifferentiation and invasive behavior of invasive endothelial cells as well as tumor cells 5, 8, 9, 11, 37. As MMP‐2 is an important metalloproteinase for the invasion and dissemination of tumor cells, its functional relationship to the αvβ3 integrin expression might play a key role in tumor progression (30). However, recent studies on genetically altered mouse models raise the question whether the integrin αvβ3 is truly proangiogenic and necessary for tumor angiogenesis, as mice lacking either one of these subunits are viable and fertile and show extensive vascularization 1, 22, 35.
Despite these still unanswered questions, antiangiogenic therapy with integrin αvβ3 antagonists has reached clinical phase I/IIa trials for the patients with malignant gliomas. Therefore, minute detection and quantification of αvβ3 integrin expression could be a prerequisite for the selection of patients suitable for this kind of additional therapy to analyze the potential relationship between αvβ3 expression and antitumor activity. In the context of a modern personalized cancer therapy, the benefits should be calculated for each individual patient, especially, as GBMs show a very heterogenous expression of αvβ3 integrin, which ranges from only mild to very strong. This might also include the noninvasive detection of αvβ3 expression in gliomas through molecular imaging methods 2, 3, 4, 19, 20, 30. Thus, future studies will have to confirm that either tumor angiogenesis or higher malignancy in gliomas in fact correlate with the amount of integrin αvβ3 expression. This could also lead to new diagnostic and therapeutic approaches for integrin‐interfering agents.
ACKNOWLEDGMENTS
We thank Gertrud Kwiatkowski, Angelika Henn and Stefanie Lange for excellent technical work on tissue preparation, immunohistochemistry and PCR. We thank Dorothee Rieger for proofreading this manuscript.
This study was supported by a grant from the Förderprogramm für Forschung und Lehre of the Faculty of Medicine of the Ludwig‐Maximilians‐Universität München (O.S.; FöFoLe, Reg. No. 377) and from the Deutsche Forschungsgemeinschaft (C.G.; DFG–Forschergruppe Radionuklidtherapie, FOR–411).
Re‐use of this article is permitted in accordance with the Creative Commons Deed, Attribution 2.5, which does not permit commercial exploitation.
REFERENCES
- 1. Bader BL, Rayburn H, Crowley D, Hynes RO (1998) Extensive vasculogenesis, angiogenesis, and organogenesis precede lethality in mice lacking all alpha v integrins. Cell 95:507–519. [DOI] [PubMed] [Google Scholar]
- 2. Beer AJ, Schwaiger M (2007) Molecular imaging with new PET tracers. Radiologe 47:8–17. [DOI] [PubMed] [Google Scholar]
- 3. Beer AJ, Haubner R, Goebel M, Luderschmidt S, Spilker ME, Wester HJ et al (2005) Biodistribution and pharmacokinetics of the alphavbeta3‐selective tracer 18F‐galacto‐RGD in cancer patients. J Nucl Med 46:1333–1341. [PubMed] [Google Scholar]
- 4. Beer AJ, Haubner R, Sarbia M, Goebel M, Luderschmidt S, Grosu AL et al (2006) Positron emission tomography using [18F] Galacto‐RGD identifies the level of integrin alpha(v)beta3 expression in man. Clin Cancer Res 12:3942–3949. [DOI] [PubMed] [Google Scholar]
- 5. Bello L, Francolini M, Marthyn P, Zhang J, Carroll RS, Nikas DC et al (2001) Alpha(v)beta3 and alpha(v)beta5 integrin expression in glioma periphery. Neurosurgery 49:380–389. [DOI] [PubMed] [Google Scholar]
- 6. Bello L, Lucini V, Carrabba G, Giussani C, Machluf M, Pluderi M et al (2001) Simultaneous inhibition of glioma angiogenesis, cell proliferation, and invasion by a naturally occurring fragment of human metalloproteinase‐2. Cancer Res 61:8730–8736. [PubMed] [Google Scholar]
- 7. Bello L, Lucini V, Giussani C, Carrabba G, Pluderi M, Scaglione F et al (2003) IS20I, a specific alphavbeta3 integrin inhibitor, reduces glioma growth in vivo. Neurosurgery 52:177–185. [DOI] [PubMed] [Google Scholar]
- 8. Boger DL, Goldberg J, Silletti S, Kessler T, Cheresh DA (2001) Identification of a novel class of small‐molecule antiangiogenic agents through the screening of combinatorial libraries which function by inhibiting the binding and localization of proteinase MMP2 to integrin alpha(V)beta(3). J Am Chem Soc 123:1280–1288. [DOI] [PubMed] [Google Scholar]
- 9. Brooks PC, Montgomery AM, Rosenfeld M, Reisfeld RA, Hu T, Klier G et al (1994) Integrin alpha v beta 3 antagonists promote tumor regression by inducing apoptosis of angiogenic blood vessels. Cell 79:1157–1164. [DOI] [PubMed] [Google Scholar]
- 10. Brooks PC, Stromblad S, Klemke R, Visscher D, Sarkar FH, Cheresh DA (1995) Antiintegrin alpha v beta 3 blocks human breast cancer growth and angiogenesis in human skin. J Clin Invest 96:1815–1822. [DOI] [PMC free article] [PubMed] [Google Scholar]
- 11. Brooks PC, Stromblad S, Sanders LC, Von Schalscha TL, Aimes RT, Stetler‐Stevenson WG et al (1996) Localization of matrix metalloproteinase MMP‐2 to the surface of invasive cells by interaction with integrin alpha v beta 3. Cell 85:683–693. [DOI] [PubMed] [Google Scholar]
- 12. Cheresh DA, Spiro RC (1987) Biosynthetic and functional properties of an Arg‐Gly‐Asp‐directed receptor involved in human melanoma cell attachment to vitronectin, fibrinogen, and von Willebrand factor. J Biol Chem 262:17703–17711. [PubMed] [Google Scholar]
- 13. Cheresh DA, Stupack DG (2002) Integrin‐mediated death: an explanation of the integrin‐knockout phenotype? Nat Med 8:193–194. [DOI] [PubMed] [Google Scholar]
- 14. Demuth T, Berens ME (2004) Molecular mechanisms of glioma cell migration and invasion. J Neurooncol 70:217–228. [DOI] [PubMed] [Google Scholar]
- 15. Friedlander M, Brooks PC, Shaffer RW, Kincaid CM, Varner JA, Cheresh DA (1995) Definition of two angiogenic pathways by distinct alpha v integrins. Science 270:1500–1502. [DOI] [PubMed] [Google Scholar]
- 16. Gladson CL (1996) Expression of integrin alpha v beta 3 in small blood vessels of glioblastoma tumors. J Neuropathol Exp Neurol 55:1143–1149. [DOI] [PubMed] [Google Scholar]
- 17. Gladson CL, Cheresh DA (1991) Glioblastoma expression of vitronectin and the alpha v beta 3 integrin. Adhesion mechanism for transformed glial cells. J Clin Invest 88:1924–1932. [DOI] [PMC free article] [PubMed] [Google Scholar]
- 18. Gladson CL, Wilcox JN, Sanders L, Gillespie GY, Cheresh DA (1995) Cerebral microenvironment influences expression of the vitronectin gene in astrocytic tumors. J Cell Sci 108:947–956. [DOI] [PubMed] [Google Scholar]
- 19. Haubner R, Wester HJ, Reuning U, Senekowitsch‐Schmidtke R, Diefenbach B, Kessler H et al (1999) Radiolabeled alpha(v)beta3 integrin antagonists: a new class of tracers for tumor targeting. J Nucl Med 40:1061–1071. [PubMed] [Google Scholar]
- 20. Haubner R, Weber WA, Beer AJ, Vabuliene E, Reim D, Sarbia M et al (2005) Noninvasive visualization of the activated alphavbeta3 integrin in cancer patients by positron emission tomography and [18F]Galacto‐RGD. PLoS Med 2: e70. [DOI] [PMC free article] [PubMed] [Google Scholar]
- 21. Herman IM (1993) Actin isoforms. Curr Opin Cell Biol 5:48–55. [DOI] [PubMed] [Google Scholar]
- 22. Hodivala‐Dilke KM, McHugh KP, Tsakiris DA, Rayburn H, Crowley D, Ullman‐Cullere M et al (1999) Beta3‐integrin‐deficient mice are a model for Glanzmann thrombasthenia showing placental defects and reduced survival. J Clin Invest 103:229–238. [DOI] [PMC free article] [PubMed] [Google Scholar]
- 23. Hynes RO (1992) Integrins: versatility, modulation, and signaling in cell adhesion. Cell 69:11–25. [DOI] [PubMed] [Google Scholar]
- 24. Hynes RO (2002) A reevaluation of integrins as regulators of angiogenesis. Nat Med 8:918–921. [DOI] [PubMed] [Google Scholar]
- 25. Kleihues P, Cavenee WK (2000) Pathology and Genetics of Tumours of the Nervous System. Lyon IARC Press: Lyon, France. [Google Scholar]
- 26. Kleihues P, Louis DN, Scheithauer BW, Rorke LB, Reifenberger G, Burger PC et al (2002) The WHO classification of tumors of the nervous system. J Neuropathol Exp Neurol 61:215–225. [DOI] [PubMed] [Google Scholar]
- 27. Krebs B, Kohlmannsperger V, Nolting S, Schmalzbauer R, Kretzschmar HA (2006) A method to perform Western blots of microscopic areas of histological sections. J Histochem Cytochem 54:559–565. [DOI] [PubMed] [Google Scholar]
- 28. Leary JJ, Brigati DJ, Ward DC (1983) Rapid and sensitive colorimetric method for visualizing biotin‐labeled DNA probes hybridized to DNA or RNA immobilized on nitrocellulose: bio‐blots. Proc Natl Acad Sci USA 80:4045–4049. [DOI] [PMC free article] [PubMed] [Google Scholar]
- 29. Macdonald TJ, Taga T, Shimada H, Tabrizi P, Zlokovic BV, Cheresh DA et al (2001) Preferential susceptibility of brain tumors to the antiangiogenic effects of an alpha(v) integrin antagonist. Neurosurgery 48:151–157. [DOI] [PubMed] [Google Scholar]
- 30. Ozen O, Krebs B, Hemmerlein B, Pekrun A, Kretzschmar H, Herms J (2004) Expression of matrix metalloproteinases and their inhibitors in medulloblastomas and their prognostic relevance. Clin Cancer Res 10:4746–4753. [DOI] [PubMed] [Google Scholar]
- 31. Paulus W, Tonn JC (1995) Interactions of glioma cells and extracellular matrix. J Neurooncol 24:87–91. [DOI] [PubMed] [Google Scholar]
- 32. Paulus W, Baur I, Schuppan D, Roggendorf W (1993) Characterization of integrin receptors in normal and neoplastic human brain. Am J Pathol 143:154–163. [PMC free article] [PubMed] [Google Scholar]
- 33. Priller C, Bauer T, Mitteregger G, Krebs B, Kretzschmar HA, Herms J (2006) Synapse formation and function is modulated by the amyloid precursor protein. J Neurosci 26:7212–7221. [DOI] [PMC free article] [PubMed] [Google Scholar]
- 34. Reifenberger G, Blümcke I, Pietsch T, Paulus W (2006) Pathology and classification of tumors of the nervous system. In: Neuro‐Oncology of CNS‐Tumors, Tonn JC, Westphal M, Rutka JT, Sae G (eds), pp. 3–72. Springer: Berlin Heidelberg New York. [Google Scholar]
- 35. Reynolds LE, Wyder L, Lively JC, Taverna D, Robinson SD, Huang X et al (2002) Enhanced pathological angiogenesis in mice lacking beta3 integrin or beta3 and beta5 integrins. Nat Med 8:27–34. [DOI] [PubMed] [Google Scholar]
- 36. Ruoslahti E (1991) Integrins. J Clin Invest 87:1–5. [DOI] [PMC free article] [PubMed] [Google Scholar]
- 37. Silletti S, Kessler T, Goldberg J, Boger DL, Cheresh DA (2001) Disruption of matrix metalloproteinase 2 binding to integrin alpha vbeta 3 by an organic molecule inhibits angiogenesis and tumor growth in vivo. Proc Natl Acad Sci USA 98:119–124. [DOI] [PMC free article] [PubMed] [Google Scholar]
- 38. Taga T, Suzuki A, Gonzalez‐Gomez I, Gilles FH, Stins M, Shimada H et al (2002) Alpha v‐Integrin antagonist EMD 121974 induces apoptosis in brain tumor cells growing on vitronectin and tenascin. Int J Cancer 98:690–697. [DOI] [PubMed] [Google Scholar]
- 39. Takano S, Tsuboi K, Tomono Y, Mitsui Y, Nose T (2000) Tissue factor, osteopontin, alphavbeta3 integrin expression in microvasculature of gliomas associated with vascular endothelial growth factor expression. Br J Cancer 82:1967–1973. [DOI] [PMC free article] [PubMed] [Google Scholar]
- 40. Wang D, Anderson JC, Gladson CL (2005) The role of the extracellular matrix in angiogenesis in malignant glioma tumors. Brain Pathol 15:318–326. [DOI] [PMC free article] [PubMed] [Google Scholar]
- 41. Xiong JP, Stehle T, Diefenbach B, Zhang R, Dunker R, Scott DL et al (2001) Crystal structure of the extracellular segment of integrin alpha Vbeta3. Science 294:339–345. [DOI] [PMC free article] [PubMed] [Google Scholar]