

Abstract
Chromosome gains and losses used for risk stratification in chronic lymphocytic leukemia (CLL) are commonly assessed by multiprobe fluorescence in situ hybridization (FISH) studies. We designed and validated a customized array-comparative genomic hybridization (aCGH) platform as a clinical assay for CLL genomic profiling. A 60-mer, 44,000-probe oligonucleotide array with a 50-kb average spatial resolution was augmented with high-density probe tiling at loci that are frequently aberrant in CLL. Aberrations identified by aCGH were compared with those identified by a FISH panel, including locus-specific probes to ATM (11q22.3), the centromeric region of chromosome 12 (12p11.1–q11), D13S319 (13q14.3), LAMP1 (13q34), and TP53 (17p13.1). In 100 CLL samples, aCGH/FISH concordance was seen for 89% of FISH-called aberrations at the ATM (n = 18), D13S319 (n = 42), LAMP (n = 12), and TP53 (n = 22) loci and for chromosome 12 (n = 14). Eighty-four percentage of FISH/aCGH discordant calls were in samples either at or below the limit of aCGH sensitivity (10% to 25% FISH aberration-containing cells). Therefore, aCGH profiling is a feasible routine clinical test with comparable results to multiprobe FISH studies; however, it may be less sensitive than FISH in cases with low-level aberrations. Further, a customized array design can provide comprehensive genomic profiling with additional accuracy in both identifying and defining the extent of small aberrations at target loci.
Chronic lymphocytic leukemia (CLL) is characterized by peripheral blood and bone marrow involvement by mature, monoclonal B-cells that co-express CD19, CD5, and CD23.1 CLL shows a variable clinical course that is correlated with phenotypic variability in a number of tumor-associated biomarkers, including serum lactate dehydrogenase, CD38 and ZAP70 expression, the degree of somatic mutation in the immunoglobulin heavy chain variable region genes, and specific genetic aberrations.2,3,4,5,6,7,8,9,10,11,12,13,14,15,16,17,18 The Rai and Binet staging systems, which are based on the extent of disease, remain among the most widely used predictors of prognosis. However, these predictors fail to identify those patients diagnosed with early stage disease who will have an aggressive clinical course.19,20 With the recent development of more effective and potentially curative regimens for CLL, a panel of tumor-associated biomarkers is increasingly performed during the initial workup of newly diagnosed patients and used to guide treatment.
The detection of specific genomic alterations in CLL has emerged as one of the most important biomarker studies. Tumor-associated deletions of the short arm of chromosome (chr) 17 (del17p), seen in 5% to 10% of cases, and within the long arm of chr 11 involving bands q22–q24 (del11q 22.3), seen in 15% to 25% of cases, have been shown to be independent predictors of survival and disease progression in CLL.10,18,21 In addition, the deletion of a small region at chr 13q14 and the presence of trisomy 12 have been shown to be of value in disease classification and diagnosis. As a result, these four chromosomal aberrations, and an additional locus at chr 13q34, are now commonly assessed by a multiprobe fluorescence in situ hybridization studies (FISH) for risk stratification in CLL patients.
Comparative genomic hybridization using high density arrays (aCGH) is a powerful tool for high-throughput analysis of genetic alterations in tumors. Our study evaluates the use of aCGH as a cost-effective and feasible alternative to multiprobe FISH for genomic profiling and risk stratification in CLL. We report the design and validation of a customized, oligonucleotide aCGH platform and the comparison of its performance with that of clinical-grade multiprobe FISH assay in 100 CLL samples.
Materials and Methods
Case Selection and Review
This study was conducted under an institutional review board-approved protocol in the Molecular Diagnostic Laboratory at the University of Texas M. D. Anderson Cancer Center. For the pilot study, 62 tumor samples diagnosed as CLL according to the World Health Organization criteria1 were selected based on a range of genetic aberrations identified previously by conventional G-banded karyotype and/or multiprobe FISH assays. For a follow-up blinded study, 38 sequential CLL cases, which met our screening criteria established during the pilot study (ie, greater than 25% CLL cells in the sample), were analyzed and multiprobe FISH studies were simultaneously performed on parallel samples. The FISH results were not reviewed for comparison until after the aCGH aberration calls were finalized.
DNA Purification and Labeling
Genomic DNA (gDNA) from peripheral blood or bone marrow samples was isolated using the Autopure extractor (QIAGEN/Gentra, Valencia, CA) and 0.5 μg of gDNA in a total volume of 26 μl was digested with AluI and RsaI restriction enzymes for 2 hours at 37°C. Digested gDNA fragments were labeled with Cy5-dUTP for patient DNA and Cy3-dUTP for human female reference DNA (Promega Corporation, Madison, WI) using Agilent Genomic DNA labeling Kit PLUS (p/n 5188–5309, Agilent Technologies, Palo Alto, CA) according to the manufacturer's instructions. Microcon YM-30 columns (Millipore, Billerica, MA) were used to clean labeled DNA and 1× TE (pH 8.0) was added after filtering, if necessary, to ensure all sample volumes were between 20 and 25 μl. Target yield and specific activity were quantified using the Nanodrop ND-1000 (Thermo Fisher Scientific, Wilmington, DE).
Genomic Array Design and Hybridization
A custom-designed, 44,000-feature, 60-mer oligonucleotide genomic array was designed using eArray software (Agilent Technologies), with gene-centric full genome coverage augmented with high density probe tiling in the 15 chromosomal loci with aberrations in CLL as reported by others and observed at our institution (Table 1).21,22,23,24,25,26,27,28 The average functional spatial resolution within the non-high-tiled areas of the genome was approximately 50 to 75 kb and approximately 5 to 11 kb in the focused regions of interest. The four samples per slide (4×44K) configuration was used.
Table 1.
High Density Probe Coverage in the Custom Designed aCGH Array
| Genomic areas with augmented probe density included in the multi-probe FISH panel | Number of probes | Percentage of probes in 44K probe array |
|---|---|---|
| Chr 11q14.3–q23.3 | 4729 | 11.2 |
| Chr 12q13–q15 | 765 | 1.8 |
| Chr 13q12–13q14.3 | 3139 | 7.4 |
| Chr 13q34.3 | 597 | 1.4 |
| Chr 17p13 | 408 | 1.0 |
| Additional genomic areas with augmented probe density | ||
| Chr 1q23.3 | 500 | 1.2 |
| Chr 3q27.3 | 45 | 0.1 |
| Chr 6q21–q23 | 2065 | 4.9 |
| Chr 6q25–q27 | 2110 | 5.1 |
| Chr 9p24 | 284 | 0.7 |
| Chr 9p24.1 | 116 | 0.3 |
| Chr 13q21.33 | 127 | 0.3 |
| Chr 14q22–q24 | 2291 | 5.4 |
| Chr 14q32.13 | 1972 | 4.7 |
| Chr 18q21.33 | 387 | 0.9 |
For hybridization, labeled patient gDNA and reference gDNA were pooled and mixed with 5 μg of human Cot-1 DNA (Invitrogen, Carlsbad, CA), 11 μl of 10× blocking agent, and 55 μl of 2× hybridization buffer (Agilent Technologies) in a final volume of 110 μl. The mixtures were denatured at 93°C for 3 minutes and incubated at 37°C for 30 minutes before loading on to the array. Hybridization was performed for 40 hours at 65°C in a rotating oven (Robbins Scientific, Mountain View, CA) at 10 rpm. Following hybridization, the arrays were disassembled and washed for 5 minutes at room temperature in oligo aCGH wash buffer 1, followed by washes for 1 minute at 37°C in oligo aCGH wash buffer 2 (Agilent Technologies), for 1 minute at room temperature in acetonitrile (Sigma-Aldrich, St. Louis, MO), and a final 30-second wash in stabilization and drying solution (Agilent Technologies). The arrays were scanned using an Agilent 2565BA DNA microarray scanner.
Positive Controls and Sensitivity Controls
A master mix of three different CLL patients, yielding one sample containing all cytogenetic abnormalities of prognostic significance, was used for a positive control. To establish array sensitivity, three CLL patient samples with known percentages of aberration-bearing cells determined by FISH were diluted 1:2 and 1:4 into reference gDNA. Negative controls included pooled or individual gDNA from normal donors, or pooled male or pooled female donor gDNA (Promega Corporation, Madison, WI). To establish assay precision, six positive and five negative genomic DNA samples were tested in multiple different experiments.
Data Analysis
Following array scanning, data were normalized using the Feature Extraction Software version 9.5.3.1, and analyzed by CGH Analytics software version 3.5.14 (Agilent Technologies) or Nexus CGH 2.0.2 (Biodiscovery Inc, El Segundo CA). For report generation, aberration calls generated by CGH Analytics were imported into the laboratory SQL database. Calls were reported only if the aberration(s) identified spanned the location of the FISH probes for the five tested loci. The probe distribution at these five loci was also visually examined in CGH Analytics independently by three of the investigators (D.J., R.L., R.S.).
During the pilot study, multiple analysis settings in two software packages were tested to optimize aberration calls while minimizing background related gains/losses. Based on these studies, in CGH Analytics (our primary analysis platform), we selected the Aberration Detection Method 2 (ADM-2) statistical algorithm and the default analysis settings for the centralization and fuzzy zero corrections. Additionally, low and high stringency aberration filter settings were developed and used for analysis in the blinded study. The “low stringency setting” included an ADM-2 threshold of 4.0 and an aberration level filter with a minimum number of probes in an aberrant region of 2 and a minimum absolute average Log2 ratio of 0.05. The “high stringency” setting included an ADM-2 threshold of 6.0 and an aberration level filter with a minimum number of probes in an aberrant region of 25 and a minimum absolute average Log2 ratio of 0.2. In Nexus CGH analysis, the Rank Segmentation algorithm with significance threshold of 1.0× 10⁻⁶ was used. The settings for aberration calls in Nexus CGH were 0.4 for high gain, 0.15 for gain, −0.1 for loss, and −0.4 for high loss. Optimal data analysis was achieved by applying the low and then high stringency filters and if different calls were made using Nexus as a tiebreaker. Using this two tiered data analysis approach, there were no false-positive calls (ie, aberration seen by aCGH by not by FISH or karyotype) identified in any of the cases.
Quality Control Measures and Assay Performance Parameters
Only samples with a postlabeling yield of 5 to 7 μg DNA, and a specific activity of 25 to 40 pmol/μg for Cy3 and 20 to 35 pmol/μg for Cy5, were used for array hybridization. Following array hybridization, the signal intensity, signal to noise ratio, background noise, the derivative log ratio spread, and the reproducibility were evaluated using the Feature Extraction software version 9.5.3.1 (Agilent), with cutoffs for sample rejection used according to the manufacturer's recommendations.
During the initial stages of assay development, we were able to streamline the testing process by eliminating the genome amplification step, shortening the time for sample concentration, and decreasing hybridization time from the recommended 72 hours to 40 hours without compromising data quality. By implementing these time saving steps, streamlining data analysis, and simplifying database import steps, an overall turn-around time of 5 days was achieved that included DNA extraction, pre-screening of sample adequacy, 10 hours hands-on technical time, and 3 hours for technical review of data.
Other Laboratory Parameters Evaluated
For each sample, the percentage of lymphocytes in either the bone marrow or peripheral blood differential count was recorded. In addition, the percentage of CD5/CD19+ CLL B-cells in the lymphocyte gate was measured using four-color flow cytometry. Quantitation of the CD5/CD19+ tumor cells in each sample was performed by multiplying the number of lymphocytes in the differential by the percentage of CD5/CD19+ CLL B-cells measured using flow cytometry.
Conventional cytogenetic and FISH analyses were performed on cultures of whole bone marrow or peripheral blood samples. FISH analysis was performed on bone marrow or peripheral blood samples that had been maintained in culture without stimulation for 24 hours using the Vysis CLL probe panel (Abbott Molecular, Downers Grove, IL) according to the manufacturer's recommendations. The panel includes locus-specific probes to ATM (11q22.3), the centromeric region of chr 12 (12p11.1–q11), D13S319 (13q14.3), LAMP1 (13q34), and TP53 (17p13.1). For each probe, 200 interphase nuclei were enumerated. Conventional cytogenetic analysis was performed on 20 metaphase cells using standard Giemsa-banding techniques from samples that had either been maintained in culture without stimulation for 24 hours or stimulated with lipopolysaccharide for 72 hours.
Results
Array Sensitivity
aCGH analysis was performed on three CLL patient samples using undiluted, 1:2 and 1:4 dilutions of patient gDNA with reference gDNA to evaluate array sensitivity. By FISH analysis, sample 1 demonstrated a deletion of the ATM locus at chr 11q22.3 in 96% of cells, D13S319 loss in 37% of cells and trisomy 12 in 57%; sample 2 demonstrated deletion of ATM locus in 91%, D13S319 loss in 94%, and TP53 probe loss in 87% of cells; sample 3 demonstrated trisomy 12 in 67%, D13S319 loss in both loci in 38% and one locus in 43% of cells. For these samples, aberrations could be called by aCGH at these four loci if there were present in at least 25% of the cells in the dilutions.
Comparison of FISH and aCGH Detection of Selected Chromosomal Aberrations in Pilot Study Samples
Of the 62 CLL cases selected for the pilot study, 56 were bone marrow aspirates and 6 were peripheral blood. The percentage of lymphocytes in the samples ranged from 33% to 98% (median 89%) and the calculated number of CD5/CD19+ tumor cells in samples ranged from 14% to 97% (median 77%). Multiprobe FISH studies with aberration percentages at chrs 11q23, 12, 13q14, 13q34, and 17p13 were available for comparison in 52/62 (84%) cases.
Using stringent analysis settings, aCGH-FISH concordance was seen in 14/15 (93%) del ATM (11q22.3), 11/12 (92%) trisomy 12, 21/27 (78%) del 13q14.3, 5/10 (50%) del LAMP1/13q34, and 13/18 (72%) del TP53/17p13.1 aberrations (Figure 1 and Table 2). In 6/52 (12%) cases, cytogenetic abnormalities were not detected by either FISH or aCGH in the five loci of interest. At stringent analysis settings, no false positive aCGH aberration calls were seen in the negative controls. Similarly, no false-positive aCGH aberration calls were identified within the five loci of interest in the CLL cases. Compared with FISH/aCGH, conventional karyotypic analysis showed more discordance, with 7/11 (64%) del ATM/11q22.3 and 14/18 (78%) del 13q14.3 aberrations identified by FISH and aCGH that were not reported in the G-banded karyotype.
Figure 1.
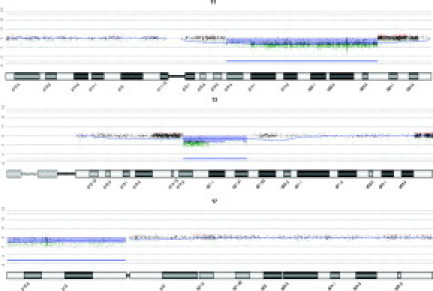
aCGH data for FISH-validated loci in CLL. A single case is shown that has deletions spanning the ATM locus at chr 11q 22.3 (91%), the D13S319 locus at chr 13q14.3 (94%), and the TP53 locus at chr 17p13.1 (87%). The thin blue line represents a 50 megabase moving average. Green/Red dots indicate less or greater than Log2 ratio change of 0.5. The horizontal blue bar represents regions called statistically significant by CGH Analytics with an ADM-2 threshold of 6.0.
Table 2.
Comparison of Aberrations Detected by CGH and Multi-Probe FISH in Pilot Study
| Aberrations* | Aberration frequency | % Aberration containing cells (FISH) |
|---|---|---|
| ATM/del11q22.3 | ||
| FISH+/aCGH+ | 14 | 9–98 |
| FISH+/aCGH− | 1 | 14 |
| Trisomy 12 | ||
| FISH+/aCGH+ | 11 | 43–78 |
| FISH+/aCGH− | 1 | 57 |
| D13S319/del13q14.3 | ||
| FISH+/aCGH+ | 21 | 17–94 |
| FISH+/aCGH− | 6 | 11, 11, 13, 19, 22, 25 |
| LAMP1/del13q34 | ||
| FISH+/aCGH+ | 5 | 35–82 |
| FISH+/aCGH− | 5 | 8, 9, 11, 24, 49 |
| TP53/del17p13.1 | ||
| FISH+/aCGH+ | 13 | 27–96 |
| FISH+/aCGH− | 5 | 8, 9, 18, 27, 51 |
Analysis done only using CGH Analytics, with calls based on stringent settings.
Among the discordant results, 14/18 (78%) were in samples that had less than 25% of cells scored positive on multiprobe FISH analysis (Table 2). In 11/14 (79%), use of less stringent analysis settings revealed a matching aberration by aCGH (Figure 2). However, these lower stringency settings resulted in aberration calls in several genomic areas within the negative control samples. In the four discordances where the FISH aberrations were greater than 25% (57% +12, 49% del 13q34, and 51% and 27% del 17p13.1), the lower stringency analysis setting still did not detect FISH identified aberrations in 2/4 cases (+12, 57% and del 17p13.1, 27%) (Figure 3 and not shown). Whether the discordances in these aberration calls were due to differences in the parallel samples analyzed, the effect of short-term cultures used for cytogenetic analysis, or technical issues related to either assay is unclear.
Figure 2.

Discordance between aCGH calls and FISH results largely relate to differential sensitivity of the assays. A case with 22% of cells demonstrating a D13S319 loss by FISH that had the aberration called by low (top array panel) but not high (bottom array panel) stringency analysis settings. The thin blue line represents a 50 megabase moving average. Green/Red dots indicate less or greater than Log2 ratio change of 0.5. The horizontal blue bar represents the region called statistically significant by CGH Analytics with an ADM-2 threshold of 4.0. CGH Analytics settings used in the bottom panel are as described in Figure 1.
Figure 3.
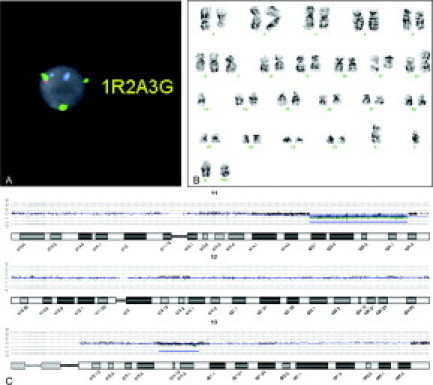
A: A case with 96% of cells exhibiting an ATM gene deletion at 11q22.3 (not illustrated), 57% of cells exhibiting three green CEP12 signals (3G), 37% of cells exhibiting a deletion of one red signal (1R) at the D13S319 locus, and two aqua signals (2A) representing the presence of two 13q34/LAMP1 loci by multiprobe FISH. B: The conventional karyotype for this case was: 39–46,XY,del(1)(q22), add(2)(p25), −7, del(11)(q22q25), add(12)(p11.2), −18,+1–2mar[cp8], and diploid male karyotype 46, XY CP5. Note in this representative karyotype, some of the karyotypic alterations, including the trisomy 12 seen by FISH, are not clearly identified; however, the possibility of additional chromosome 12 material, including the centromeric portion of the chromosome, in the marker chromosomes cannot be excluded. C: Although the 11q22.3 deletion and the D13S319 deletion were detected at both high and low stringency analysis settings, no detectable aberration was seen in chromosome 12 by aCGH at either the low or high stringency analysis settings. CGH Analytics settings for this analysis are as described in Figure 1.
Comparison of FISH and aCGH Detection of Selected Chromosomal Aberrations in Follow-up Blinded Study Samples
Based on the pilot study results, a workflow algorithm was designed for routine analysis of sequential CLL cases. This included evaluation of the flow cytometry for parallel samples to ensure that the percentage of CD5/CD19+ lymphocytes was at least 25% of the total cells before proceeding with CGH analysis. Only cases that met this pre-screening criterion were tested. For data analysis, we included use of both CGH Analytics at high and low stringency filter settings and Nexus software; aCGH aberrations were only called when an aberration was identified using at least two of the three analysis settings.
Using these criteria, 38 CLL cases (26 bone marrow aspirates and 12 peripheral blood) were analyzed. Multiprobe FISH studies with aberration percentages at chrs 11q22.3, 12, 13q14, 13q34, and 17p13 were available for comparison in 36/38 (95%) cases. Identical FISH/aCGH calls were noted in 32/36 (89%) cases. Cytogenetic abnormalities at the five loci of interest were not detected by either FISH or aCGH in 10/36 (28%) cases and 33 aberrations were identified by FISH in the remaining 26 cases. Of the aberrations identified by FISH, 30/33 (90%) and 26/33 (79%) were also seen by aCGH using low-stringency and high stringency settings, respectively. In the 4 FISH+/aCGH− discordant cases, the aberrations were present in 9, 10, 13, 14, and 16% of the interphase nuclei by FISH (Table 3). As in the pilot study, no false-positive aberration calls were identified within the five chromosomal loci assessed by multiprobe FISH using our custom-designed, high-density aCGH.
Table 3.
Comparisons between aCGH and FISH Studies in Blinded Validation Study
| aCGH match by case | aCGH match by aberration | Comment | |
|---|---|---|---|
| FISH− | 10/10 | 0/0 | No false positive calls by aCGH |
| FISH+ | 22/26 | 28/33 | See listing of “false-negative” aCGH cases below |
| Discordances | |||
| Case | FISH chromosomal abnormality | FISH % | aCGH results* |
| 1 | del (13q14.3) | 10* | Deletion not seen in the 3 analysis settings |
| 2 | Trisomy 12 | 72 | +12 identified, del (13q14) missed on all 3 settings |
| del (13q14) | 13* | ||
| 3 | del (13q14.3) | 14* | del (13q14) identified on low stringency CGH-A setting, missed by other 2 settings |
| 4 | del (17p13.1) | 97 | del (17p13) identified, del (13q14.3) and del (13q34) missed on all 3 analysis settings |
| del (13q34) | 9* | ||
| del (13q14.3) | 16* | ||
All cases analyzed by low and high stringency setting in CGH Analytics (CGH-A) and in Nexus. See Materials and Methods section for setting.
Incidence of Chromosomal Aberrations Identified in the Custom Designed aCGH
The incidence of aberrations seen within 12/15 genomic loci augmented with high density probe tiling was calculated for the entire patient cohort using Nexus analysis software (Table 4). The incidences of aberrations at 14q32 and 6q21–27 are the subject of additional manuscripts that provide more detailed analysis of aCGH and FISH aberrations in these loci.
Table 4.
Incidence of aCGH Aberrations Detected in High Density Probe Coverage
| Genomic areas with augmented probe density included in the multi-probe FISH panel | Incidence (%) of aberrations |
|---|---|
| Chr 11q14.3–q23.3 | 41 |
| Chr 12q13–q15 | 25 |
| Chr 13q12–13q14.3 | 48 |
| Chr 13q34.3 | 7 |
| Chr 17p13 | 21 |
| Additional genomic areas with augmented probe density | |
| Chr 1q23.3 | 15 |
| Chr 3q27.3 | 6 |
| Chr 6q21–q23 | * |
| Chr 6q25–q27 | * |
| Chr 9p24 | 7 |
| Chr 9p24.1 | 3 |
| Chr 13q21.33 | 11 |
| Chr 14q22–q24 | 5 |
| Chr 14q32.13 | * |
| Chr 18q21.33 | 7 |
Incidence for aberrations at these genomic loci are being addressed in separate manuscripts.
Discussion
CLL is unique among the B-cell lymphoproliferative disorders in that it mostly lacks reciprocal chromosomal translocations.29 Instead, it typically shows a characteristic set of chromosomal deletions or gains that have prognostic and diagnostic utility, and is, therefore, an ideal tumor type for genomic profiling by CGH. Our study demonstrates that a custom-designed oligonucleotide array with high tiling on specific genomic loci can be used clinically as an alternative method for the evaluation of genomic aberrations with prognostic significance in CLL. In the initial and follow-up blinded study, aCGH calls showed a high degree of concordance with parallel FISH studies, except where the FISH aberration was present in fewer than 25% of analyzed cells. There were no false-positive calls at these loci by aCGH using FISH and/or G-banded karyotyping as the reference method.
The need for better genomic profiling in CLL was revealed by studies that showed conventional cytogenetic analyses (G-banded karyotype) could only detect cytogenetic aberrations in about 40% to 50% of CLL cases, and miss most cases with chr 11q22/ATM alterations,30 as well as the vast majority of cases with chr 13q14 deletions.31 Although FISH has increased this detection rate to over 80%,21 aCGH provides some distinct advantages including the potential for comprehensive genomic profiling and the ability to delimit the boundaries of specific genomic aberrations (Figure 4 and Table 5). The latter is also a significant advantage of oligonucleotide array over bacterial artificial chromosome arrays that have been recently evaluated for use in the genomic profiling of CLL.32,33
Figure 4.
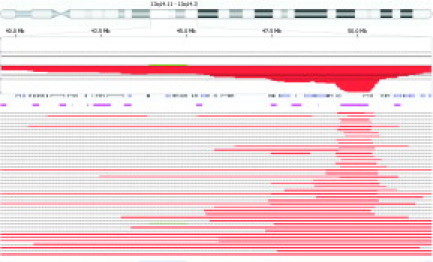
Mapping of the extent of deletions at chr 13q14 in CLL. Penetrance plot of the 41 cases in both the pilot and validation studies that had detectable deletions spanning the D13S319 locus at chr 13q14.3. Using Nexus software settings detailed in the Materials and Methods, variable sized deletions are observed. The area of analysis spans chromosome 13 from 13q14.11 to 13q14.3. The percentage penetrance for all cases within the area of analysis is illustrated by the solid red area. The open boxes and solid bars below the percentage penetrance represent genes within the area of analysis. The horizontal pink lines represent copy number variants within the area of analysis. The horizontal red lines at the bottom of the figure represent the extent of deletion within the area of analysis for each individual case. Please refer to Table 5 for the genomic coordinates and deletion size for each individual case.
Table 5.
Genomic Coordinates and Deletion Sizes for Chromosome 13q14.3
| Start position of deletion | End position of deletion | Length of deletion (Mb) |
|---|---|---|
| 49,405,061 | 50,208,737 | 0.8 |
| 49,501,120 | 50,424,347 | 0.9 |
| 49,476,068 | 50,424,347 | 0.9 |
| 49,405,061 | 50,392,213 | 1.0 |
| 49,436,492 | 50,424,347 | 1.0 |
| 49,387,564 | 50,409,837 | 1.0 |
| 49,451,769 | 50,501,307 | 1.0 |
| 49,451,769 | 50,515,006 | 1.1 |
| 49,365,400 | 50,436,419 | 1.1 |
| 49,381,480 | 50,492,804 | 1.1 |
| 49,356,850 | 50,562,696 | 1.2 |
| 49,501,120 | 50,841,240 | 1.3 |
| 49,078,554 | 50,599,518 | 1.5 |
| 49,069,080 | 50,599,518 | 1.5 |
| 49,476,068 | 51,164,892 | 1.7 |
| 48,705,916 | 50,599,518 | 1.9 |
| 48,724,292 | 50,645,329 | 1.9 |
| 48,748,579 | 50,841,240 | 2.1 |
| 47,835,987 | 50,290,882 | 2.5 |
| 47,867,284 | 50,580,197 | 2.7 |
| 47,482,652 | 50,580,197 | 3.1 |
| 48,788,008 | 51,922,968 | 3.1 |
| 47,389,008 | 50,618,635 | 3.2 |
| 47,451,635 | 51,702,809 | 4.3 |
| 45,810,460 | 50,501,307 | 4.7 |
| 45,523,386 | 50,392,213 | 4.9 |
| 45,579,985 | 50,501,307 | 4.9 |
| 43,095,667 | 51,493,841 | 8.4 |
| 47,558,907 | 58,112,775 | 10.6 |
| 45,682,948 | 56,419,004 | 10.7 |
| 43,382,098 | 58,112,775 | 14.7 |
| 48,829,431 | 64,316,460 | 15.5 |
| 47,648,041 | 64,316,460 | 16.7 |
| 47,311,944 | 64,316,460 | 17.0 |
| 46,207,217 | 64,316,460 | 18.1 |
| 46,107,467 | 64,316,460 | 18.2 |
| 45,957,343 | 64,316,460 | 18.4 |
| 45,938,586 | 64,316,460 | 18.4 |
| 33,791,609 | 52,264,233 | 18.5 |
| 37,041,698 | 56,891,733 | 19.9 |
| 40,534,399 | 64,316,460 | 23.8 |
| 34,574,745 | 64,316,460 | 29.7 |
| 18,601,703 | 51,824,768 | 33.2. |
aCGH provides the ability to delimit the boundaries of the variably sized deletions of chromosome 13q14.3 observed in the CLL cases in Figure 4.
Disadvantages of aCGH compared with FISH include its semiquantitative nature and a lower intrinsic sensitivity. The lower limit of sensitivity of multiprobe FISH, in our laboratory and in most published studies, for most aberrations is 5% to 7%.34,35 In our study, the custom array sensitivity was 10–25% aberration-bearing cells and similar to that seen in other studies.32 Given the high tumor burden in most untreated CLL cases and the high intratumoral level of most aberrations, this sensitivity of a high-tiled oligonucleotide array appears adequate to generate the needed prognostic data in CLL. The qualitative call and higher cutoff for detection of del ATM/11q 22.3 and TP53/17p13 for aCGH compared with FISH may also be useful in establishing more standardized categorical risk prediction models (ie, aberration present/absent). Nonetheless, for samples where tumor cells comprise less than 25% of the population, enrichment for CD5/CD19+ cells before DNA extraction may be required for accurate aberrancy detection by aCGH.
Among currently recognized CLL biomarker studies, genomic profiling by aCGH is one of the most adaptable to routine testing. For example, although immunoglobulin heavy chain variable region gene mutational status permits risk stratification in CLL patients independent of their disease stage,4,5,6,7,10,11,13,14,36,37 this type of analysis is labor intensive, expensive and beyond the capabilities of many clinical laboratories. Similarly, intracellular levels of the tyrosine kinase ZAP70 measured by flow cytometry has been shown to be a predictor of outcome or need for therapy that parallels immunoglobulin heavy chain variable region gene mutational status.2,12,15,16,38,39 However, levels of ZAP70 expression do not always correlate with mutational status, and it has proven difficult to standardize reagents and methodologies for its detection.40 Laboratory studies to detect genetic aberrations in CLL thus have been easier to validate and standardize41,42 and provide correlations with other biomarkers, such as the strong association of del ATM/11q22.3 cases with unmutated/ZAP70+ status.21,43,44
We present a model for routine application of aCGH methodology in the clinical laboratory. By pre-screening samples before analysis and implementing a more streamlined workflow, we were able to reduce the likelihood of expensive, wasteful testing of inadequate/borderline samples and reduce overall assay turnaround time. This approach can be used in coordination with FISH testing and/or prior cell sorting to obtain reportable data on nearly all CLL patients. In addition, the routine use of aCGH for genomic profiling will permit the incorporation and analysis of additional genomic loci, as their prognostic and/or diagnostic significance becomes apparent,45,46 without increasing costs.
Footnotes
Supported in part by a Cancer Center Core Grant from the National Cancer Institute, Department of Health and Human Services (CA16672).
D.J. and R.L. have disclosure related to intellectual property interest in array design.
The data in part was presented at the United States and Canadian Academy of Pathology Annual Meeting, March, 2008; Denver, Colorado.
References
- 1.Jaffe EHN, Stein H, editors. Tumours of Haematopoietic and Lymphoid Tissues. IARC Press; Lyon, France: 2001. pp. 127–131. [Google Scholar]
- 2.Crespo M, Bosch F, Villamor N, Bellosillo B, Colomer D, Rozman M, Marce S, Lopez-Guillermo A, Campo E, Montserrat E. ZAP-70 expression as a surrogate for immunoglobulin-variable-region mutations in chronic lymphocytic leukemia. N Engl J Med. 2003;348:1764–1775. doi: 10.1056/NEJMoa023143. [DOI] [PubMed] [Google Scholar]
- 3.Damle RN, Wasil T, Fais F, Ghiotto F, Valetto A, Allen SL, Buchbinder A, Budman D, Dittmar K, Kolitz J, Lichtman SM, Schulman P, Vinciguerra VP, Rai KR, Ferrarini M, Chiorazzi N. Ig V gene mutation status and CD38 expression as novel prognostic indicators in chronic lymphocytic leukemia. Blood. 1999;94:1840–1847. [PubMed] [Google Scholar]
- 4.Fais F, Ghiotto F, Hashimoto S, Sellars B, Valetto A, Allen SL, Schulman P, Vinciguerra VP, Rai K, Rassenti LZ, Kipps TJ, Dighiero G, Schroeder HW, Jr, Ferrarini M, Chiorazzi N. Chronic lymphocytic leukemia B cells express restricted sets of mutated and unmutated antigen receptors. J Clin Invest. 1998;102:1515–1525. doi: 10.1172/JCI3009. [DOI] [PMC free article] [PubMed] [Google Scholar]
- 5.Hamblin TJ, Davis Z, Gardiner A, Oscier DG, Stevenson FK. Unmutated Ig V(H) genes are associated with a more aggressive form of chronic lymphocytic leukemia. Blood. 1999;94:1848–1854. [PubMed] [Google Scholar]
- 6.Hamblin TJ, Orchard JA, Ibbotson RE, Davis Z, Thomas PW, Stevenson FK, Oscier DG. CD38 expression and immunoglobulin variable region mutations are independent prognostic variables in chronic lymphocytic leukemia, but CD38 expression may vary during the course of the disease. Blood. 2002;99:1023–1029. doi: 10.1182/blood.v99.3.1023. [DOI] [PubMed] [Google Scholar]
- 7.Hashimoto S, Dono M, Wakai M, Allen SL, Lichtman SM, Schulman P, Vinciguerra VP, Ferrarini M, Silver J, Chiorazzi N. Somatic diversification and selection of immunoglobulin heavy and light chain variable region genes in IgG+ CD5+ chronic lymphocytic leukemia B cells. J Exp Med. 1995;181:1507–1517. doi: 10.1084/jem.181.4.1507. [DOI] [PMC free article] [PubMed] [Google Scholar]
- 8.Ibrahim S, Keating M, Do KA, O'Brien S, Huh YO, Jilani I, Lerner S, Kantarjian HM, Albitar M. CD38 expression as an important prognostic factor in B-cell chronic lymphocytic leukemia. Blood. 2001;98:181–186. doi: 10.1182/blood.v98.1.181. [DOI] [PubMed] [Google Scholar]
- 9.Jelinek DF, Tschumper RC, Geyer SM, Bone ND, Dewald GW, Hanson CA, Stenson MJ, Witzig TE, Tefferi A, Kay NE. Analysis of clonal B-cell CD38 and immunoglobulin variable region sequence status in relation to clinical outcome for B-chronic lymphocytic leukaemia. Br J Haematol. 2001;115:854–861. doi: 10.1046/j.1365-2141.2001.03149.x. [DOI] [PubMed] [Google Scholar]
- 10.Krober A, Seiler T, Benner A, Bullinger L, Bruckle E, Lichter P, Dohner H, Stilgenbauer S. V(H) mutation status. CD38 expression level, genomic aberrations, and survival in chronic lymphocytic leukemia. Blood. 2002;100:1410–1416. [PubMed] [Google Scholar]
- 11.Maloum K, Davi F, Merle-Beral H, Pritsch O, Magnac C, Vuillier F, Dighiero G, Troussard X, Mauro FF, Benichou J. Expression of unmutated VH genes is a detrimental prognostic factor in chronic lymphocytic leukemia. Blood. 2000;96:377–379. [PubMed] [Google Scholar]
- 12.Orchard JA, Ibbotson RE, Davis Z, Wiestner A, Rosenwald A, Thomas PW, Hamblin TJ, Staudt LM, Oscier DG. ZAP-70 expression and prognosis in chronic lymphocytic leukaemia. Lancet. 2004;363:105–111. doi: 10.1016/S0140-6736(03)15260-9. [DOI] [PubMed] [Google Scholar]
- 13.Oscier DG, Gardiner AC, Mould SJ, Glide S, Davis ZA, Ibbotson RE, Corcoran MM, Chapman RM, Thomas PW, Copplestone JA, Orchard JA, Hamblin TJ. Multivariate analysis of prognostic factors in CLL: clinical stage. IGVH gene mutational status, and loss or mutation of the p53 gene are independent prognostic factors. Blood. 2002;100:1177–1184. [PubMed] [Google Scholar]
- 14.Oscier DG, Thompsett A, Zhu D, Stevenson FK. Differential rates of somatic hypermutation in V(H) genes among subsets of chronic lymphocytic leukemia defined by chromosomal abnormalities. Blood. 1997;89:4153–4160. [PubMed] [Google Scholar]
- 15.Rassenti LZ, Huynh L, Toy TL, Chen L, Keating MJ, Gribben JG, Neuberg DS, Flinn IW, Rai KR, Byrd JC, Kay NE, Greaves A, Weiss A, Kipps TJ. ZAP-70 compared with immunoglobulin heavy-chain gene mutation status as a predictor of disease progression in chronic lymphocytic leukemia. N Engl J Med. 2004;351:893–901. doi: 10.1056/NEJMoa040857. [DOI] [PubMed] [Google Scholar]
- 16.Wiestner A, Rosenwald A, Barry TS, Wright G, Davis RE, Henrickson SE, Zhao H, Ibbotson RE, Orchard JA, Davis Z, Stetler-Stevenson M, Raffeld M, Arthur DC, Marti GE, Wilson WH, Hamblin TJ, Oscier DG, Staudt LM. ZAP-70 expression identifies a chronic lymphocytic leukemia subtype with unmutated immunoglobulin genes, inferior clinical outcome, and distinct gene expression profile. Blood. 2003;101:4944–4951. doi: 10.1182/blood-2002-10-3306. [DOI] [PubMed] [Google Scholar]
- 17.Zupo S, Isnardi L, Megna M, Massara R, Malavasi F, Dono M, Cosulich E, Ferrarini M. CD38 expression distinguishes two groups of B-cell chronic lymphocytic leukemias with different responses to anti-IgM antibodies and propensity to apoptosis. Blood. 1996;88:1365–1374. [PubMed] [Google Scholar]
- 18.Dohner H, Stilgenbauer S, Benner A, Leupolt E, Krober A, Bullinger L, Dohner K, Bentz M, Lichter P. Genomic aberrations and survival in chronic lymphocytic leukemia. N Engl J Med. 2000;343:1910–1916. doi: 10.1056/NEJM200012283432602. [DOI] [PubMed] [Google Scholar]
- 19.Binet JL, Auquier A, Dighiero G, Chastang C, Piguet H, Goasguen J, Vaugier G, Potron G, Colona P, Oberling F, Thomas M, Tchernia G, Jacquillat C, Boivin P, Lesty C, Duault MT, Monconduit M, Belabbes S, Gremy F. A new prognostic classification of chronic lymphocytic leukemia derived from a multivariate survival analysis. Cancer. 1981;48:198–206. doi: 10.1002/1097-0142(19810701)48:1<198::aid-cncr2820480131>3.0.co;2-v. [DOI] [PubMed] [Google Scholar]
- 20.Rai KR, Sawitsky A, Cronkite EP, Chanana AD, Levy RN, Pasternack BS. Clinical staging of chronic lymphocytic leukemia. Blood. 1975;46:219–234. doi: 10.1182/blood-2016-08-737650. [DOI] [PubMed] [Google Scholar]
- 21.Stilgenbauer S, Bullinger L, Lichter P, Dohner H. Genetics of chronic lymphocytic leukemia: genomic aberrations and V(H) gene mutation status in pathogenesis and clinical course. Leukemia. 2002;16:993–1007. doi: 10.1038/sj.leu.2402537. [DOI] [PubMed] [Google Scholar]
- 22.Bentz M, Huck K, du Manoir S, Joos S, Werner CA, Fischer K, Dohner H, Lichter P. Comparative genomic hybridization in chronic B-cell leukemias shows a high incidence of chromosomal gains and losses. Blood. 1995;85:3610–3618. [PubMed] [Google Scholar]
- 23.Dohner H, Fischer K, Bentz M, Hansen K, Benner A, Cabot G, Diehl D, Schlenk R, Coy J, Stilgenbauer S. p53 gene deletion predicts for poor survival and non-response to therapy with purine analogs in chronic B-cell leukemias. Blood. 1995;85:1580–1589. [PubMed] [Google Scholar]
- 24.Glassman AB, Hayes KJ. The value of fluorescence in situ hybridization in the diagnosis and prognosis of chronic lymphocytic leukemia. Cancer Genet Cytogenet. 2005;158:88–91. doi: 10.1016/j.cancergencyto.2004.08.012. [DOI] [PubMed] [Google Scholar]
- 25.Kalachikov S, Migliazza A, Cayanis E, Fracchiolla NS, Bonaldo MF, Lawton L, Jelenc P, Ye X, Qu X, Chien M, Hauptschein R, Gaidano G, Vitolo U, Saglio G, Resegotti L, Brodjansky V, Yankovsky N, Zhang P, Soares MB, Russo J, Edelman IS, Efstratiadis A, Dalla-Favera R, Fischer SG. Cloning and gene mapping of the chromosome 13q14 region deleted in chronic lymphocytic leukemia. Genomics. 1997;42:369–377. doi: 10.1006/geno.1997.4747. [DOI] [PubMed] [Google Scholar]
- 26.Karhu R, Knuutila S, Kallioniemi OP, Siltonen S, Aine R, Vilpo L, Vilpo J. Frequent loss of the 11q14–24 region in chronic lymphocytic leukemia: a study by comparative genomic hybridization. Tampere CLL Group. Genes Chromosomes Cancer. 1997;19:286–290. doi: 10.1002/(sici)1098-2264(199708)19:4<286::aid-gcc12>3.0.co;2-e. [DOI] [PubMed] [Google Scholar]
- 27.Stilgenbauer S, Bullinger L, Benner A, Wildenberger K, Bentz M, Dohner K, Ho AD, Lichter P, Dohner H. Incidence and clinical significance of 6q deletions in B cell chronic lymphocytic leukemia. Leukemia. 1999;13:1331–1334. doi: 10.1038/sj.leu.2401499. [DOI] [PubMed] [Google Scholar]
- 28.Zhang Y, Matthiesen P, Harder S, Siebert R, Castoldi G, Calasanz MJ, Wong KF, Rosenwald A, Ott G, Atkin NB, Schlegelberger B. A 3-cM commonly deleted region in 6q21 in leukemias and lymphomas delineated by fluorescence in situ hybridization. Genes Chromosomes Cancer. 2000;27:52–58. doi: 10.1002/(sici)1098-2264(200001)27:1<52::aid-gcc7>3.0.co;2-x. [DOI] [PubMed] [Google Scholar]
- 29.Haferlach C, Dicker F, Schnittger S, Kern W, Haferlach T. Comprehensive genetic characterization of CLL: a study on 506 cases analysed with chromosome banding analysis, interphase FISH. IgV(H) status and immunophenotyping. Leukemia. 2007;21:2442–2451. doi: 10.1038/sj.leu.2404935. [DOI] [PubMed] [Google Scholar]
- 30.Eclache V, Caulet-Maugendre S, Poirel HA, Djemai M, Robert J, Lejeune F, Raphael M. Cryptic deletion involving the ATM locus at 11q22.3 approximately q23.1 in B-cell chronic lymphocytic leukemia and related disorders. Cancer Genet Cytogenet. 2004;152:72–76. doi: 10.1016/j.cancergencyto.2003.10.010. [DOI] [PubMed] [Google Scholar]
- 31.Stockero KJ, Fink SR, Smoley SA, Paternoster SF, Shanafelt TD, Call TG, Zent CS, Van Dyke DL, Kay NE, Dewald GW. Metaphase cells with normal G-bands have cryptic interstitial deletions in 13q14 detectable by fluorescence in situ hybridization in B-cell chronic lymphocytic leukemia. Cancer Genet Cytogenet. 2006;166:152–156. doi: 10.1016/j.cancergencyto.2005.10.011. [DOI] [PubMed] [Google Scholar]
- 32.Patel A, Kang SH, Lennon PA, Li YF, Rao PN, Abruzzo L, Shaw C, Chinault AC, Cheung SW. Validation of a targeted DNA microarray for the clinical evaluation of recurrent abnormalities in chronic lymphocytic leukemia. Am J Hematol. 2008;83:540–546. doi: 10.1002/ajh.21145. [DOI] [PubMed] [Google Scholar]
- 33.Schwaenen C, Nessling M, Wessendorf S, Salvi T, Wrobel G, Radlwimmer B, Kestler HA, Haslinger C, Stilgenbauer S, Dohner H, Bentz M, Lichter P. Automated array-based genomic profiling in chronic lymphocytic leukemia: development of a clinical tool and discovery of recurrent genomic alterations. Proc Natl Acad Sci USA. 2004;101:1039–1044. doi: 10.1073/pnas.0304717101. [DOI] [PMC free article] [PubMed] [Google Scholar]
- 34.Reddy KS. Chronic lymphocytic leukaemia profiled for prognosis using a fluorescence in situ hybridisation panel. Br J Haematol. 2006;132:705–722. doi: 10.1111/j.1365-2141.2005.05919.x. [DOI] [PubMed] [Google Scholar]
- 35.Xu W, Li JY, Wu YJ, Yu H, Shen QD, Li L, Fan L, Qiu HX. Prognostic significance of ATM and TP53 deletions in Chinese patients with chronic lymphocytic leukemia. Leuk Res. 2008;32:1071–1077. doi: 10.1016/j.leukres.2007.10.009. [DOI] [PubMed] [Google Scholar]
- 36.Chiorazzi N, Ferrarini M. B cell chronic lymphocytic leukemia: lessons learned from studies of the B cell antigen receptor. Annu Rev Immunol. 2003;21:841–894. doi: 10.1146/annurev.immunol.21.120601.141018. [DOI] [PubMed] [Google Scholar]
- 37.Schroeder HW, Jr, Dighiero G. The pathogenesis of chronic lymphocytic leukemia: analysis of the antibody repertoire. Immunol Today. 1994;15:288–294. doi: 10.1016/0167-5699(94)90009-4. [DOI] [PubMed] [Google Scholar]
- 38.Chan AC, Iwashima M, Turck CW, Weiss A. ZAP-70: a 70 kd protein-tyrosine kinase that associates with the TCR zeta chain. Cell. 1992;71:649–662. doi: 10.1016/0092-8674(92)90598-7. [DOI] [PubMed] [Google Scholar]
- 39.Rosenwald A, Alizadeh AA, Widhopf G, Simon R, Davis RE, Yu X, Yang L, Pickeral OK, Rassenti LZ, Powell J, Botstein D, Byrd JC, Grever MR, Cheson BD, Chiorazzi N, Wilson WH, Kipps TJ, Brown PO, Staudt LM. Relation of gene expression phenotype to immunoglobulin mutation genotype in B cell chronic lymphocytic leukemia. J Exp Med. 2001;194:1639–1647. doi: 10.1084/jem.194.11.1639. [DOI] [PMC free article] [PubMed] [Google Scholar]
- 40.Roullet M, Sargent R, Pasha T, Cajiao I, Elstrom R, Smith T, Liebhaber S, Zhang P, Bagg A. ZAP70 expression assessed by immunohistochemistry on peripheral blood: a simple prognostic assay for patients with chronic lymphocytic leukemia. Appl Immunohistochem Mol Morphol. 2007;15:471–476. doi: 10.1097/01.pai.0000213152.41440.34. [DOI] [PubMed] [Google Scholar]
- 41.Bastard C, Raux G, Fruchart C, Parmentier F, Vaur D, Penther D, Troussard X, Nagib D, Lepretre S, Tosi M, Frebourg T, Tilly H. Comparison of a quantitative PCR method with FISH for the assessment of the four aneuploidies commonly evaluated in CLL patients. Leukemia. 2007;21:1460–1463. doi: 10.1038/sj.leu.2404727. [DOI] [PubMed] [Google Scholar]
- 42.Haferlach C, Rieder H, Lillington DM, Dastugue N, Hagemeijer A, Harbott J, Stilgenbauer S, Knuutila S, Johansson B, Fonatsch C. Proposals for standardized protocols for cytogenetic analyses of acute leukemias, chronic lymphocytic leukemia, chronic myeloid leukemia, chronic myeloproliferative disorders, and myelodysplastic syndromes. Genes Chromosomes Cancer. 2007;46:494–499. doi: 10.1002/gcc.20433. [DOI] [PubMed] [Google Scholar]
- 43.Krober A, Bloehdorn J, Hafner S, Buhler A, Seiler T, Kienle D, Winkler D, Bangerter M, Schlenk RF, Benner A, Lichter P, Dohner H, Stilgenbauer S. Additional genetic high-risk features such as 11q deletion, 17p deletion, and V3–21 usage characterize discordance of ZAP-70 and VH mutation status in chronic lymphocytic leukemia. J Clin Oncol. 2006;24:969–975. doi: 10.1200/JCO.2005.03.7184. [DOI] [PubMed] [Google Scholar]
- 44.Herling M, Patel KA, Khalili J, Schlette E, Kobayashi R, Medeiros LJ, Jones D. TCL1 shows a regulated expression pattern in chronic lymphocytic leukemia that correlates with molecular subtypes and proliferative state. Leukemia. 2006;20:280–285. doi: 10.1038/sj.leu.2404017. [DOI] [PubMed] [Google Scholar]
- 45.Tyybakinoja A, Vilpo J, Knuutila S. High-resolution oligonucleotide array-CGH pinpoints genes involved in cryptic losses in chronic lymphocytic leukemia. Cytogenet Genome Res. 2007;118:8–12. doi: 10.1159/000106435. [DOI] [PubMed] [Google Scholar]
- 46.La Starza R, Barba G, Matteucci C, Crescenzi B, Romoli S, Pierini V, Beacci D, Cantaffa R, Martelli MF, Mecucci C. Chronic lymphocytic leukaemia Is terminal del(14)(q24) a new marker for prognostic stratification? Leuk Res. 2006;30:1569–1572. doi: 10.1016/j.leukres.2006.03.019. [DOI] [PubMed] [Google Scholar]