Abstract
Gene co-expression analysis has been widely used in recent years for predicting unknown gene function and its regulatory mechanisms. The predictive accuracy depends on the quality and the diversity of data set used. In this report, we applied singular value decomposition (SVD) to array experiments in public databases to find that co-expression linkage could be estimated by a much smaller number of array data. Correlations of co-expressed gene were assessed using two regulatory mechanisms (feedback loop of the fundamental circadian clock and a global transcription factor Myb28), as well as metabolic pathways in the AraCyc database. Our conclusion is that a smaller number of informative arrays across tissues can suffice to reproduce comparable results with a state-of-the-art co-expression software tool. In our SVD analysis on Arabidopsis data set, array experiments that contributed most as the principal components included stamen development, germinating seed and stress responses on leaf.
Key words: singular value decomposition, gene expression, gene correlation, Arabidopsis
1. Introduction
Oligonucleotide microarrays such as Affymetrix GeneChip have opened opportunities for the high-throughput observation of gene expressions. For the model plant Arabidopsis thaliana (A. thaliana), >3000 gene-expression data have been measured by different research groups and stored in online repositories such as Gene Expression Omnibus (GEO),1 The Arabidopsis Information Resource (TAIR),2 and the Nottingham Arabidopsis Stock Centre Arrays (NASC).3 Also available are the functional prediction tools based on gene co-expression, such as AthCoR@CSB.DB,4 Genevestigator,5 ATTED-II6 and KAGIANA.7 Most of the prediction tools measure similarity of co-expression by Pearson’s or Spearman’s rank correlation with P-value across various biological and experimental conditions. Such similarity measure has been exploited to identify functioning genes among candidates otherwise indistinguishable from sequence annotations.8,9
Since correlation coefficient depends on the quality and the number of data sets, the selection of expression data is crucial for better prediction. For example, Pearson’s correlation results in bad estimates under the existence of outliers, or when the relationship between genes is nonlinear. Revealing complex gene-to-gene relationship such as in primary metabolism therefore requires a careful data pre-processing, i.e. selection of microarray data to delineate ‘true’ gene correlations. For example, Obayashi et al. used empirically weighted Pearson’s correlation in their ATTED-II server to reduce information redundancy in the 1388 GeneChip data from TAIR (see also the help page in the web site http://www.atted.bio.titech.ac.jp/). Wei et al.10 manually selected 486 so-called ‘high-quality’ GeneChip data from NASC so that computed correlation would be biologically meaningful. Although effectiveness of such strategies has been demonstrated in several studies,8,11 it is unclear how much data are required, or which data repository are to be used. Data bias such as tissue distribution in repositories is also unknown. We examined three major online repositories (TAIR, NASC and GEO) and confirmed the benefit of using different, but not necessarily all, GeneChip data. Our study is based on singular value decomposition (SVD)12,13 and AraCyc metabolic pathways for overall verification of gene co-expressions.
2. Materials and methods
2.1. Gene-expression data sources and pre-processing
In this study, we collected and merged data from three major online repositories for A. thaliana gene expressions: TAIR (http://www.arabidopsis.org/), NASC (http://affymetrix.arabidopsis.info/) and GEO (http://www.ncbi.nlm.nih.gov/geo/). After removing redundancy, the combined data set resulted in 2364 Affymetrix ATH1 GeneChip CEL files. (We used only ATH1 chips, which cover 80% of all genes with 23 000 probes. AG chips with 8000 probes were discarded). Each file was manually classified according to their sample tissue and experimental conditions. The classified data represented 133 experimental series, which are listed in Supplementary Table S1. The raw CEL files were pre-processed by the Robust Multi-chip Average (RMA) Algorithm,14 in which perfect match intensities of array probes are modeled as the sum of exponential and Gaussian distributions for the signal and background, respectively.
2.2. SVD compression of data matrix
SVD was used to reduce the dimension of signal data. Similar to principal component analysis, it produces the best lower rank approximation of the original data matrix. The technique decomposes a data matrix A (m × n matrix) into three matrices, U (m × m matrix), V (n × n matrix), and Σ (m × n diagonal matrix) as follows:
| 1 |
where T denotes transpose. The diagonal of Σ are called singular values (SVs) and their absolute values plotted against their sorted ranks often display a power-law distribution in real world problems. In our analysis, the distribution was modeled as y = x−0.88 (data not shown). In such cases, the original matrix can be well approximated by zeroing all SVs except k largest ones as in
| 2 |
where Σk is a m × n diagonal matrix with k largest elements only, and Ak is the reconstruction. The rank of Ak is exactly k, i.e. the original dimension n of A is reduced to k.
2.3. Rank calculation for pathway genes and its evaluation
Pearson’s correlation coefficient (r-value) and its significance (P-value) are used to measure the gene co-expression. A list of 1638 probe sets related to 219 pathways was first obtained from AraCyc dump file (ftp://ftp.arabidopsis.org/home/tair/Pathways/aracyc_dump_20070703), to form the m × n matrix A, where m is the number of AraCyc genes (m = 1638), and n the number of arrays (n = 2364), respectively. The computed SVs of the matrix were sorted and the largest k SVs were used to reconstruct the approximated matrix Ak as in Equation (2). Using approximated matrices, correlation coefficients between all AraCyc genes were calculated. Co-expressions that did not satisfy each threshold (r > 0.2, 0.3, 0.4, 0.5, 0.6, 0.7, 0.8 and 0.9, respectively) were discarded. The cutoff threshold was introduced to better separate inter- and intra-pathway correlations by removing majority of insignificant (low) correlations. For the remaining gene co-expressions, the average rank of intra-pathway co-expressions was calculated on 78 pathways that were associated with ≥10 metabolic genes in the database (see also Supplementary Table S2).
3. Results and discussion
3.1. Distribution of microarray experiments in public databases
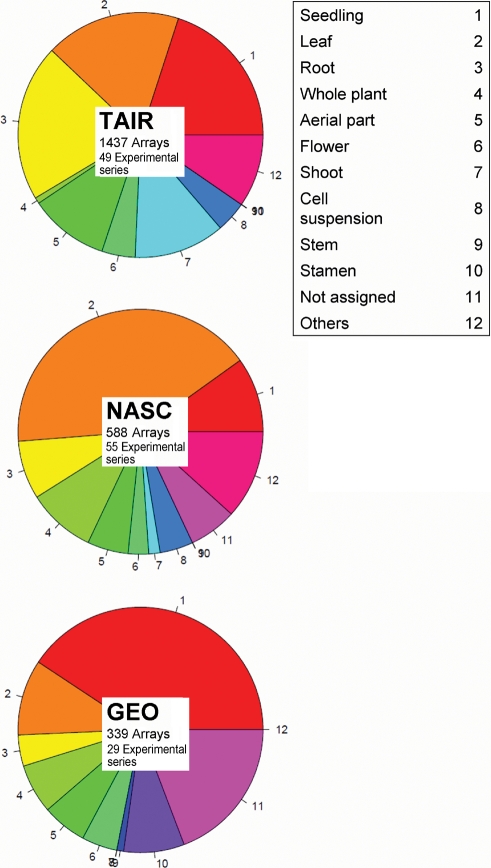
According to tissue types and experimental conditions, the 2364 array data were manually classified into 133 experimental series, whose complete listing is available as Supplementary Table S1. TAIR contains 49 experimental series (e.g. development, biotic- or abiotic-treatments, and hormone treatment), NASC provides 55 series (e.g. lignification, plant defense responses, and carbohydrate metabolism through the diurnal cycle and others), and GEO enlists 29 series (e.g. phenotypic diversity, altered environmental plasticity, stamen development and diurnal cycle effect in leaves).
There are notable differences among the three repositories. First is the tissue distribution in each repository as in Fig. 1. Data from shoot and cell suspension occupy >15% only in TAIR, and data from stamen exist only in GEO. Tissue distribution is almost balanced in TAIR, but significantly biased in NASC and GEO. Another difference is the number of GeneChip data. From this, we can at least conclude that data from all three repositories are necessary to accurately observe gene expressions in different tissue types. In the following study, we merged three data sets into a single collection without duplication.
Figure 1.
Pie chart of the biomaterials of array data in each data repository.
3.2. Dimensional compression by SVD
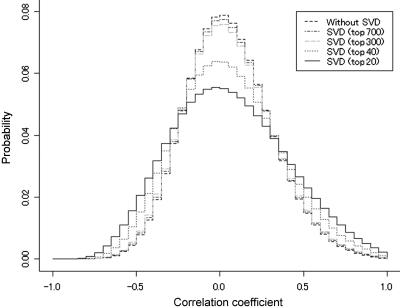
We saw that the tissue distribution of microarray data is biased. Another source of bias is hundreds of ‘reference’ (or wild-type) data in the repositories. Even if data look biased, i.e. multiple microarrays seem to show highly similar expression patterns, it is not easy to tell whether they are indeed redundant. The SVD algorithm was employed to check this redundancy (See Materials and methods). Fig. 2 shows the distributions of correlation coefficient for all gene pairs calculated by matrix approximation reconstructed using largest 20, 40, 300, 700 SVs and without SVD. The distribution of correlations fitted well with the Gaussian distribution for all reconstructions, and the standard deviations (SD) were 0.34, 0.31, 0.27, 0.26, and 0.26, respectively. The top 20 or 40 SVs could already reproduce the original distribution, implying that we may disregard smaller SVs as noise. The number 20 (or 40) is not an optimal value, but serves as a rough estimate. The reason for choosing these values will be explained later.
Figure 2.
Distribution of correlation coefficient from five types of data matrices (with- and without-SVD compression) normalized by RMA. Data matrices were reconstructed by largest 20 SVs (solid line), 40 SVs (lower dotted line), 300 and 700 SVs (upper dotted lines), and without-SVD (outermost dotted line). The SD of each distribution are 0.34, 0.31, 0.27, 0.26 and 0.26, respectively.
To check the effect of dimensional reduction in detail, we first verified Pearson’s correlation coefficient (r), its rank and P-value (P) for two well-known gene regulatory mechanisms: negative feedback loop and transcription factor.
3.2.1. Feedback loop: the central circadian clock
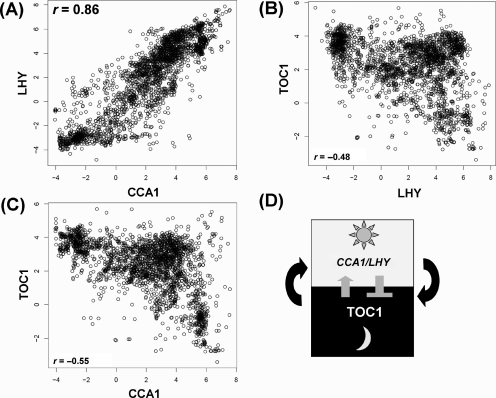
The central circadian clock (Fig. 3) is a typical non-metabolic regulatory mechanism. When we used all 2364 arrays, strong positive correlation between two Myb-like transcription factor genes, Circadian Clock Associated 1 (CCA1) and Late Elongated Hypocotyl (LHY) was observed, as well as weak negative correlation between Timing Of Cab expression 1 (TOC1) and LHY, and between TOC1 and CCA1 (Fig. 3A–C and Table 1). These values agreed well with known facts that TOC1 is a positive regulator of CCA1 and LHY, and that the two clock-associated genes form a negative–positive transcriptional feedback loop.15 Table 1 shows the trend of their correlations and ranks. The approximation kept the rank of interaction even for a small number of SVs such as 20.
Figure 3.
Scatter plots (with white circles) among three major central oscillator-related genes in Arabidopsis: (A) CCA1 versus LHY, (B) LHY versus TOC1 and (C) CCA1 versus TOC1. Highly overlapped parts look black. (D) The simplest model of the central mechanism of circadian oscillator. Co-expressions were calculated by Pearson’s correlation. See main texts for abbreviations.
Table 1.
Rank of correlations (in parentheses) between three basal genes (CCA1, LHY and TOC1) in the central circadian clock
| SVs used | CCA1–LHY | TOC1–LHY | TOC1–CCA1 |
|---|---|---|---|
| 20 | r = 0.90 (1) | r = −0.63 (14) | r = −0.70 (4) |
| 40 | r = 0.90 (1) | r = −0.56 (15) | r = −0.63 (6) |
| 300 | r = 0.87 (1) | r = −0.49 (15) | r = −0.57 (3) |
| 700 | r = 0.87 (1) | r = −0.48 (11) | r = −0.56 (4) |
| 2364 | r = 0.86 (1) | r = −0.48 (12) | r = −0.55 (6) |
3.2.2. Transcription factor Myb28
To reconfirm the usefulness of the compressed data using small number of SVs, we checked the correlation values between a well-characterized transcription factor and its downstream genes using different numbers of SVs. Myb28 or R2R3-MYB transcription factor, is a positive regulator of aliphatic methionine-derived glucosinolates (GSL) investigated in the authors’ institution,8,16 offering a typical example of metabolic regulation by a non-metabolic gene. As in the clock case, the approximation kept the rank of interaction even for 20 SVs (Table 2). We also compared the correlation values with that of ATTED-II version 3 (1388 GeneChips from TAIR).6 ATTED-II is a widely known and regularly updated correlation analysis software tool for Arabidopsis. Table 2 demonstrates that correlation values obtained by using largest 20 SVs are comparable with those by ATTED-II.
Table 2.
Correlation coefficients and their ranks (in parentheses) among Myb28-regulated GSL biosynthetic genes [NS, not significant (P ≥ 1E−300)]
| Probe name | AGI code | Description | SVs used |
ATTED-II | ||||
|---|---|---|---|---|---|---|---|---|
| 20 | 40 | 300 | 700 | All | ||||
| 247549_at | At5g61420 | Myb family transcription factor (Myb28) | 1.00 | 1.00 | 1.00 | 1.00 | 1.00 | 1.00 |
| 266395_at | At2g43100 | Aconitase C-terminal domain-containing protein (AtLeuD1) | 0.89 (7) | 0.85 (7) | 0.80 (8) | 0.79 (8) | 0.79 (8) | 0.74 |
| 251524_at | At3g58990 | Aconitase C-terminal domain-containing protein (AtLeuD2) | 0.89 (6) | 0.86 (6) | 0.83 (5) | 0.82 (5) | 0.82 (4) | 0.78 |
| 254687_at | At4g13770 | Cytochrome P450 family protein (CYP83A1) | 0.95 (1) | 0.93 (1) | 0.90 (1) | 0.89 (1) | 0.89 (1) | 0.80 |
| 249866_at | At5g23010 | 2-Isopropylmalate synthase 3 (IMS3) (MAM-1) | 0.88 (8) | 0.86 (5) | 0.82 (6) | 0.81 (6) | 0.81 (6) | 0.70 |
| 257021_at | At3g19710 | Branched-chain amino acid transaminase, putative (AtBCAT-4) (MAAT) | 0.86 (9) | 0.84 (8) | 0.8 (7) | 0.79 (7) | 0.79 (7) | 0.68 |
| 262717_s_at | At1g16410 | Cytochrome P450, putative (CYP79F1) | 0.85 (12) | 0.82 (11) | 0.76 (12) | 0.74 (12) | 0.74 (12) | 0.67 |
| At1g16400 | No entry (CYP79F2) | |||||||
| 260745_at | At1g78370 | glutathione S-transferase, putative (ATGSTU20) | 0.77 (29) | 0.75 (18) | 0.72 (16) | 0.71 (16) | 0.71 (15) | 0.52 |
| 263477_at | At2g31790 | UDP-glucoronosyl/UDP-glucosyl transferase family protein (UGT74C1) | 0.92 (3) | 0.89 (3) | 0.86 (2) | 0.85 (2) | 0.84 (2) | 0.72 |
| 255437_at | At4g03060 | 2-Oxoglutarate-dependent dioxygenase, putative (AOP2) | 0.61 (274) | 0.6 (156) | 0.52 (303) | 0.51 (332) | 0.5 (328) | 0.43 |
| 255773_at | At1g18590 | Sulfotransferase family protein (AtSOT17) | 0.8 (19) | 0.77 (16) | 0.73 (15) | 0.72 (15) | 0.71 (16) | 0.61 |
| 264873_at | At1g24100 | UDP-glucoronosyl/UDP-glucosyl transferase family protein (UGT74B1) | 0.61 (307) | 0.58 (249) | 0.53 (223) | 0.52 (257) | 0.52 (257) | 0.43 |
| 260385_at | At1g74090 | Sulfotransferase family protein (AtSOT18) | 0.90 (5) | 0.87 (4) | 0.84 (4) | 0.83 (4) | 0.82 (5) | 0.76 |
| 263706_s_at | At5g14200 | AtIMD1 | 0.77 (30) | 0.74 (23) | 0.70 (18) | 0.70 (18) | 0.69 (18) | NS |
| 249867_at | At5g23020 | 2-Isopropylmalate synthase 2 (IMS2) (MAM3) | NS | NS | NS | NS | NS | 0.41 |
| 263714_at | At2g20610 | Aminotransferase, putative (SUR1) | 0.73 (43) | 0.71 (33) | 0.67 (24) | 0.66 (25) | 0.66 (25) | 0.54 |
| 250633_at | At5g07460 | Peptide methionine sulfoxide reductase, putative (PMSR2) | NS | NS | NS | NS | NS | 0.44 |
| 258851_at | At3g03190 | Glutathione S-transferase, putative (ATGSTF11) | 0.8 (16) | 0.78 (13) | 0.73 (14) | 0.72 (14) | 0.72 (14) | 0.71 |
| 254742_at | At4g13430 | Aconitate hydratase family protein (AtLeuC1) | 0.68 (97) | 0.65 (64) | 0.60 (53) | 0.6 (55) | 0.59 (59) | 0.62 |
| 259343_s_at | At3g03780 | Cobalamin-independent methionine synthase, putative (AtMS2) | 0.54 (813) | NS | NS | NS | NS | NS |
| 252274_at | At3g49680 | Branched-chain amino acid transaminase 3 (AtBCAT-3) | 0.67 (106) | 0.65 (68) | 0.62 (48) | 0.62 (41) | 0.61 (44) | 0.53 |
The two regulatory examples suggest that blindly increasing the number of GeneChip data does not automatically lead to increased accuracy. By carefully choosing a smaller set of expression data, accurate functional prediction comparable with a state-of-the-art software tool becomes feasible.
3.3. Using AraCyc metabolic pathways to evaluate gene co-expressions
Next, we investigated the correlations among metabolic pathway genes. It is impossible to rigorously assess the effect of dimensional compression due to the absence of a set of ‘true’ gene–gene association inside metabolic pathways. As an alternative, we utilize a credible observation that, on an average, genes associated with the same metabolic pathway are highly co-expressed than genes from different pathways.10,17 For assessment, we first selected 78 pathways which were associated with ≥10 metabolic genes in the AraCyc database (Supplementary Table S2).
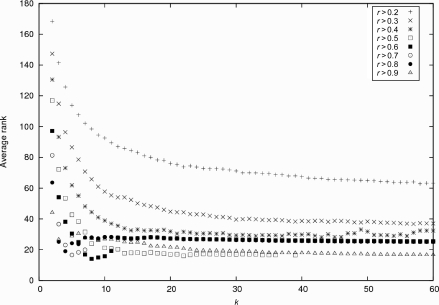
These pathways contained 1638 genes in total. We computed the co-expressions between all pairs of genes and obtained the average rank of intra-pathway co-expressions as in Wei et al.10 According to the pathway hypothesis, intra-pathway correlations are ranked lower (i.e. highly correlated) than inter-pathway correlations. Fig. 4 shows the trend of the average rank of intra-pathway correlations using reconstructed matrices of the SV index k for different threshold r (see Materials and methods). In the figure, the lowest average rank was achieved ∼20 SVs for most threshold values. In other words, 20 SVs are enough to separate intra-pathway co-expressions, and the set of arrays corresponding to these SVs is considered most informative among 2364 experiments. When r = 0.5, the lowest average rank runs between 15 and 35 and slightly jumps up at ∼40. This effect seems to be an artifact specific to the threshold 0.5 for unknown reason. Also, average ranks for different r look stabilized around k = 20. From these observations, we set the (roughly) minimum number of SVs as 20 (and 40) in our analysis.
Figure 4.
Evaluation of AraCyc genes in co-expression rankings against various thresholds (r = 0.2, 0.3, 0.4, 0.5, 0.6, 0.7, 0.8 and 0.9). Average ranks of intra-pathway correlations using reconstructed matrices were calculated across the 78 AraCyc pathways that contain ≥10 genes in ATH1 GeneChip.
3.4. Estimation of the number of informative arrays
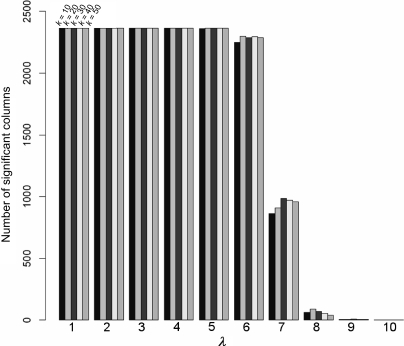
Having confirmed the effectiveness of reconstruction from a small number of SVs, we estimated the informative set of arrays, i.e. array information that are most amplified by the decomposition by regarding the SVs as the amplification factor of orthonormal basis vectors representing array experiments. The matrix Ak in Equation (2) was approximated by zeroing elements less than a threshold λ (let Bk = [Ak]>λ be this matrix), and the dimension of BkT corresponds to the number of significant arrays contributing to the k SVs in Ak. When the dimension was plotted against the increasing value of λ for different SVs, it rapidly decreased as the λ increased but the dimension was almost consistent for SVs ranging between 10 and 50 (Fig. 5). The result partially supported the dominance of large SVs as in Section 3.2, but we could not determine an appropriate λ to determine the size of informative arrays.
Figure 5.
The plot of the number of arrays (y-axis) against λ (x-axis from 1 to 10) for different SVs. Each bar corresponds to 10, 20, 30, 40 and 50 SVs from left to right. The number of significant columns rapidly decreases as the λ increases, and contributing arrays are independent of the number of SVs.
Most amplified array sets were the stamen development (GSE4733) and the Type III effectors on plant defense response (NASCarrays-59). Other significant arrays included profiles of early germinating seeds (ME00332), the response to bacterial-(LPS, HrpZ, Flg22) and oomycete-(NPP1) derived elicitors (ME00319), oxidative stress (GSE7211) and alternative oxidases (GSE4113 and GSE2406). These results indicated the importance of use of different tissue types in gene correlation analysis.
3.5. Correspondence between each SV and genes or experimental conditions
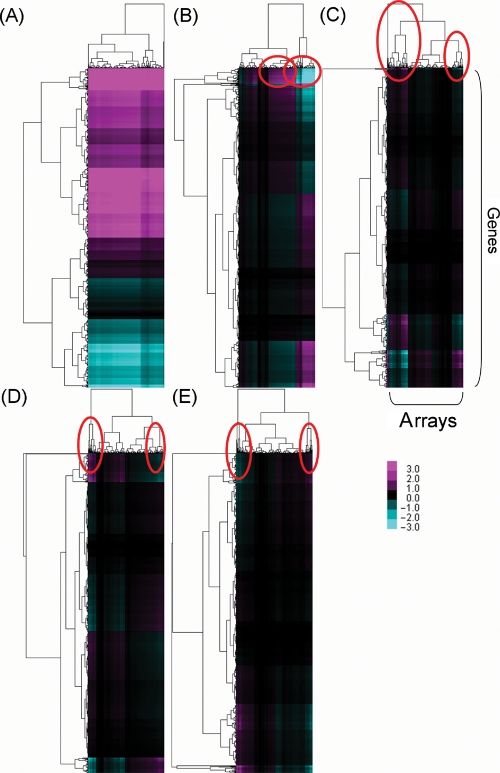
To evaluate the correspondence between a specific SV (δ) and genes or arrays, δ-dependent reconstructed expression data matrices with the gene sets of AraCyc were examined. The matrices were reconstructed according to the scheme in Supplementary Fig. S1. Briefly, we first performed SVD analysis on the data matrix and the resulting diagonal matrix Σ was transformed into δ-only Σ′. The diagonal elements of matrix Σ′ are zero values, except for the δ under focus. Using this Σ′, δ-reconstructed expression data matrix was obtained. To see which experimental conditions and genes most contributed to δ (Fig. 6), a hierarchical clustering approach was performed using the data matrix. Let us explain five largest SVs by denoting the ith largest SV as δi. In Supplementary Fig. S2, we provide breakdown charts of GO categories for each gene cluster corresponding to these SVs.
Figure 6.
Hierarchical clustering of the reconstructed data matrices using only one SV δ. (A–E) Show the matrix reconstructed by the largest SV δ1 to fifth largest value δ5. Columns are experimental series and rows are genes; both of which are hierarchically clustered in each figure. Magenta denotes the positive value of the reconstructed matrix Bk and the cyan the negative value.
The contribution of δ1 was not limited to any experimental condition or arrays but was related to specific gene clusters. Two clusters of highly positive values were formed (Fig. 6A and Supplementary Fig. S2). Supplementary Data 1 displays the full image of the hierarchical clusters of arrays marked in Fig. 6. The upper cluster in Fig. 6A (Group g1 of δ1 in Supplementary Fig. S2) contained genes associated with aerobic respiration pathway, carbonate dehydratase (in nitrogen metabolism) and photosynthesis. The middle cluster (Group g2) included genes related to glycolysis, aerobic respiration, glutamate metabolism and TCA cycle. The lower cluster (Group g3) included genes for (deoxy) ribose phosphate degradation, steroid biosynthesis, and diterpenoid biosynthesis (gibberellin inactivation). Therefore δ1 largely corresponded to a variety of major metabolic pathways in primary metabolism irrespective of experiments.
On the other hand, values from δ2 to δ5 were associated with specific experimental conditions. The δ2 was linked with two large experimental clusters shown in Fig. 6B. The magenta region in the left-hand side corresponded to the shoot data of stress series (heat, UV-B, salt, wound, cold, oxidative and drought; Group atr2 of δ2 in Supplementary Fig. S2) whereas the right-hand region contained the root data of the same experimental series (Group atr1 of δ2 in Supplementary Fig. S2. See also Supplementary Data1). Relevant genes were associated with photosynthesis and glycolysis/gluconeogenesis, but many genes show medium or low correlations. Notable observation was therefore the marked contrast between root and shoot irrespective of experimental series.
Likewise, δ3 corresponded to two biotic treatment conditions: response to virulent (accession, ME00331) and response to bacterial-(LPS, HrpZ, Flg22) and oomycete-NPP1 (accession, ME00332). The δ3 still depends on experimental series (vertical direction in Fig. 6), but high correlation in certain group of genes is also observed (horizontal direction in Fig. 6). The correspondences for δ4 and δ5 were obscurer, but as their commonly highlighted experimental conditions we could recognize stamen development data set (accession, GSE4733) with gene sets for cytokinins 9-N-glucoside biosynthesis and cytokinins 7-N-glucoside biosynthesis.
In summary, we could identify biological functions related to the largest five SVs, although each SV did not precisely correspond to specific experimental conditions or genes. We could again confirm the importance of the use of different tissue types (e.g. shoot/root under stress and stamen development).
Supplementary Data
Supplementary data are available online at www.dnaresearch.oxfordjournals.org.
Funding
This research was supported by Grant-in-Aid for Scientific Research on Priority Areas ‘Systems Genomics' from MEXT and BIRD, Japan Science and Technology Agency.
Supplementary Material
Acknowledgements
We thank Drs Yuji Sawada, and Masami Yokota-Hirai at RIKEN PSC for fruitful discussions. We also thank Yukiko Nakanishi, Hiroaki Osada, Kazuhiro Suwa, and Munehide Itoyama for assistance in classifying GeneChip data, and Tsuyoshi Kato for critical reading of our manuscript.
References
- 1.Edgar R., Domrachev M., Lash A. E. Gene Expression Omnibus: NCBI gene expression and hybridization array data repository. Nucleic Acids Res. 2002;30:207–210. doi: 10.1093/nar/30.1.207. [DOI] [PMC free article] [PubMed] [Google Scholar]
- 2.Zhang P. The Arabidopsis information resource (TAIR): a model organism database providing a centralized, curated gateway to Arabidopsis biology, research materials and community. Nucleic Acids Res. 2003;31:224–228. doi: 10.1093/nar/gkg076. [DOI] [PMC free article] [PubMed] [Google Scholar]
- 3.Craigon D. J., James N., Okyere J., Higgins J., Jotham J., May S. NASCArrays: a repository for microarray data generated by NASC’s transcriptomics service. Nucleic Acids Res. 2004;32:D575–D577. doi: 10.1093/nar/gkh133. [DOI] [PMC free article] [PubMed] [Google Scholar]
- 4.Steinhauser D., Usadel B., Luedemann A., Thimm O., Kopka J. CSB.DB: a comprehensive systems-biology database. Bioinformatics. 2004;20:3647–3651. doi: 10.1093/bioinformatics/bth398. [DOI] [PubMed] [Google Scholar]
- 5.Zimmermann P., Hirsch-Hoffmann M., Hennig L., Gruissem W. GENEVESTIGATOR. Arabidopsis microarray database and analysis toolbox. Plant Physiol. 2004;136:2621–2632. doi: 10.1104/pp.104.046367. [DOI] [PMC free article] [PubMed] [Google Scholar]
- 6.Obayashi T., Kinoshita K., Nakai K., Shibaoka M., Hayashi S., Saeki M., Shibata D., Saito K., Ohta H. ATTED II: a database of co-expressed genes and cis elements for identifying co-regulated gene groups in Arabidopsis. Nucleic Acids Res. 2007;35:D863–D869. doi: 10.1093/nar/gkl783. [DOI] [PMC free article] [PubMed] [Google Scholar]
- 7.Aoki K., Ogata Y., Shibata D. Approaches for extracting practical information from gene co-expression networks in plant biology. Plant Cell Physiol. 2007;48:381–390. doi: 10.1093/pcp/pcm013. [DOI] [PubMed] [Google Scholar]
- 8.Hirai M. Y., Sugiyama K., Sawada Y., Tohge T., Obayashi T., Suzuki A., Araki R., Sakurai N., Suzuki H., et al. Omics-based identification of Arabidopsis Myb transcription factors regulating aliphatic glucosinolate biosynthesis. Proc. Natl Acad. Sci. USA. 2007;104:6478–6483. doi: 10.1073/pnas.0611629104. [DOI] [PMC free article] [PubMed] [Google Scholar]
- 9.Lisso J., Steinhauser D., Altmann T., Kopka J., Mussig C. Identification of brassinosteroid-related genes by means of transcript co-response analyses. Nucleic Acids Res. 2005;33:2685–2696. doi: 10.1093/nar/gki566. [DOI] [PMC free article] [PubMed] [Google Scholar]
- 10.Wei H., Persson S., Mehta T., Srinivasasainagendra V., Chen L., Page G. P., Somerville C., Loraine A. Transcriptional coordination of the metabolic network in Arabidopsis. Plant Physiol. 2006;142:762–774. doi: 10.1104/pp.106.080358. [DOI] [PMC free article] [PubMed] [Google Scholar]
- 11.Persson S., Wei H., Milne J., Page G. P., Somerville C. R. Identification of genes required for cellulose synthesis by regression analysis of public microarray data sets. Proc. Natl Acad. Sci. USA. 2005;102:8633–8638. doi: 10.1073/pnas.0503392102. [DOI] [PMC free article] [PubMed] [Google Scholar]
- 12.Liu L., Hawkins D. M., Ghosh S., Young S. S. Robust singular value decomposition analysis of microarray data. Proc. Natl Acad. Sci. USA. 2003;100:13167–13172. doi: 10.1073/pnas.1733249100. [DOI] [PMC free article] [PubMed] [Google Scholar]
- 13.Wall M. E., Rechtsteiner A., Rocha L. M. Singular value decomposition and principal component analysis. In: Berrar D. P., et al., editors. A Practical Approach to Microarray Data Analysis. Norwell, MA: Kluwer; 2003. pp. 91–99. [Google Scholar]
- 14.Bolstad B. M., Irizarry R. A., Astrand M., Speed T. P. A comparison of normalization methods for high density oligonucleotide array data based on variance and bias. Bioinformatics. 2003;19:185–193. doi: 10.1093/bioinformatics/19.2.185. [DOI] [PubMed] [Google Scholar]
- 15.Alabadi D., Oyama T., Yanovsky M. J., Harmon F. G., Mas P., Kay S. A. Reciprocal regulation between TOC1 and LHY/CCA1 within the Arabidopsis circadian clock. Science. 2001;293:880–883. doi: 10.1126/science.1061320. [DOI] [PubMed] [Google Scholar]
- 16.Gigolashvili T., Yatusevich R., Berger B., Muller C., Flugge U. I. The R2R3-MYB transcription factor HAG1/MYB28 is a regulator of methionine-derived glucosinolate biosynthesis in Arabidopsis thaliana. Plant J. 2007;51:247–261. doi: 10.1111/j.1365-313X.2007.03133.x. [DOI] [PubMed] [Google Scholar]
- 17.Ihmels J., Levy R., Barkai N. Principles of transcriptional control in the metabolic network of Saccharomyces cerevisiae. Nat. Biotechnol. 2004;22:86–92. doi: 10.1038/nbt918. [DOI] [PubMed] [Google Scholar]
Associated Data
This section collects any data citations, data availability statements, or supplementary materials included in this article.


