Abstract
The purpose of this study is to explain the unplanned longitudinal dose modulations that appear in helical tomotherapy (HT) dose distributions in the presence of irregular patient breathing. This explanation is developed by the use of longitudinal (1D) simulations of mock and surrogate data and tested with a fully 4D HT delivered plan. The 1D simulations use a typical mock breathing function which allows for more flexibility to adjust various parameters. These simplified simulations are then made more realistic by using 100 surrogate waveforms all similarly scaled to produce longitudinal breathing displacements. The results include the observation that, with many waveforms used simultaneously, a voxel-by-voxel probability of a dose error from breathing is found to be proportional to the realistically random breathing amplitude relative to the beam width if the PTV is larger than the beam width and the breathing displacement amplitude. The 4D experimental test confirms that regular breathing will not result in these modulations because of the insensitivity to leaf motion for low frequency dynamics such as breathing. These modulations mostly result from a varying average of the breathing displacements along the beam edge gradients. Regular breathing has no displacement variation over many breathing cycles. Some low frequency interference is also possible in real situations. In the absence of more sophisticated motion management, methods that reduce the breathing amplitude or make the breathing very regular are indicated. However, for typical breathing patterns and magnitudes, motion management techniques may not be required with HT because typical breathing occurs mostly between fundamental HT treatment temporal and spatial scales. A movement beyond only discussing margins is encouraged for intensity modulated radiotherapy such that patient and machine motion interference will be minimized and beneficial averaging maximized. These results are found for homogeneous and longitudinal on-axis delivery for unplanned longitudinal dose modulations.
Keywords: Tomotherapy, Intra-fractional motion, Dose inhomogeneity
1. Introduction
The Hi-Art™ unit (TomoTherapy, Inc., Madison, WI, USA) is a helical tomotherapy (HT) device (Mackie et al 1993) that uses a 6MV fan beam, mounted on a computed tomography (CT) style gantry, to deliver radiation treatments. Because of this continuous motion and modulation, concerns have arisen regarding the management of the radiation delivery in the presence of patient motion. Methods have been devised to account for motion by resampling the delivery sinogram in accordance with the motion pattern during treatment (Lu et al 2007), as well as accounting for motion in the delivery sinogram by incorporating 4D-CT into the optimization process and synchronizing the delivery with the patient motion (Zhang et al 2007). Typical gating schemes are more complex with HT because the gantry and couch motion cannot be stopped during a treatment fraction. Some previous studies (Kissick et al 2005b, Kanagaki et al 2007) have implied that the breathing motion would only produce simple blurring. Breathing motion studies such as these have only used regular waveforms to represent the breathing motion or have only considered sinusoidal motions, or with other conditions that are far from typical treatment parameters, and these limitations have been shown to be significant. A recent inspiring presentation from Washington University in St. Louis (WUSTL) (Chaudhari et al 2007) clearly showed that realistic breathing functions with realistic parameters will produce significant unwanted longitudinal dose modulations in an apparent contradiction to previous studies with regular and sinusoidal based motion functions. This paper confirms and helps to explain these observations of Chaudhari et al 2007.
The longitudinal width of the HT fan beam, which is often 2.5 cm at isocenter, is controlled with a pair of adjustable collimator jaws. The beam intensity is modulated in the transverse direction with a 64-leaf binary multileaf collimator (MLC) (Olivera et al 1999), with leaves that project to a lateral width of 6.25 mm at the isocenter plane. During a treatment, the couch translates at a constant speed (usually less than 1 mm/s) in the longitudinal direction, while the gantry rotates at a constant speed with a period between 15 s to 20 s. The opening and closing times of the MLC leaves are on the order of milliseconds, and the time scale of the leaf motion staying open or staying closed is less than 1s, much faster than the couch translation through the beam. The map of leaf opening times for each of the 51 delivery segments per gantry rotation, called the delivery sinogram, is optimized by the TomoTherapy Treatment Planning System software (Olivera et al 1999). For HT deliveries with a pitch, defined as the fraction of the fan beam width that the couch translates per gantry rotation, of much less than unity, the helix is considered to be ‘tight’ (Kissick et al 2007a). The couch speed is therefore relatively slow: < 0.05cm/s is typical.
The intensity modulation scheme for HT beams delivered in tight helices can be dynamically separated into longitudinal and transverse components that are approximately independent. These separable dynamics are an important concept that will be reviewed below along with a pictorial description (see Fig. 1) of why it allows for a 1D simplification for longitudinal dynamics for HT. The average human breathing frequency, ∼ 0.2 Hz, occurs between two fundamental frequency scales of HT delivery: ∼ 0.02 Hz for the jaws/couch and ∼ 2 Hz for the leaves. These distinct time scales and dynamics are at the heart of this study. If one plots the magnitudes of the Fourier transform of a breathing surrogate waveform, the result is the ‘power spectrum,’ and it will peak around this average breathing frequency. The Fourier transform breaks up any signal into sinusoidal components, and if one then applies each of these component frequencies to the system separately and measures the output (response), then the response function is obtained. The Fourier transform of the response, the ‘response function’ will peak about a frequency that matches some dynamic of the system (such as the resonant frequency of a damped harmonic oscillator): the process is simple ‘interference.’ In the present case, the dose modulations from interference will arise from the overlap between the breathing power spectrum and the system response function (see Fig. 1). Drifts and other low breathing frequency components will produce some interference if there is enough magnitude or ‘power’ in the spectrum. This study however suggests that most of the observed dose modulations are due to the averaging of many breathing cycles and the variations or lack thereof of that average. As such, techniques that reduce the magnitude of the random breathing displacement are indicated in the absence of any more sophisticated motion management schemes.
Fig. 1.
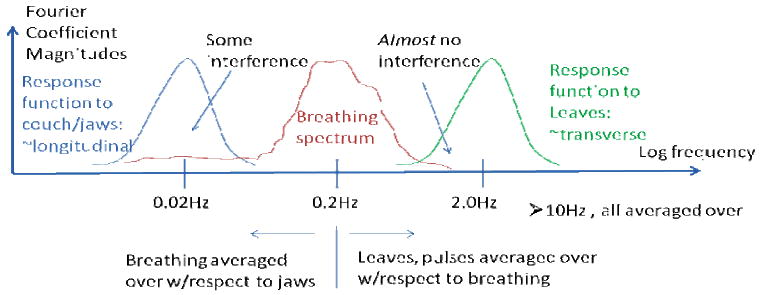
A pictorial overview of the basic interference and averaging physics of respiratory motion and helical tomotherapy.
In the delivery sinogram, the two frequency scales are apparent for typical low pitch treatments. Slice-to-slice or longitudinal modulations are produced with sinogram variations over many, hundreds of, projections (low frequency) versus within-a-slice or transverse modulations which are accomplished by variations within several or tens of projections. Evidence for longitudinal dynamics having approximately 1D dynamics separable in the frequency domain come from the fact that 1D longitudinal Gibbs ringing is produced irrespective of the transverse modulation (Kissick et al 2007b) and that the optimal pitches to minimize the thread effect (a 1D phenomenon) are very robust to many situations (Kissick et al 2005a). Further evidence is shown in this study with a test in a realistic 3D HT plan produces results fully consistent with the simplified treatment. This is also expected from the fact that the dominant breathing direction is longitudinal as well (Low et al 2005, Seppenwoolde et al 2002) and this study remains focused to on-axis behavior.
In this work, the 1D or simplified simulations first use mock breathing waveforms but then also consider surrogate breathing waveforms that have more accurate displacement distributions and accurate time behavior. Many surrogate waveforms are used for statistical reasons. The study is limited to approximately homogeneous situations since tissue composition between the beam entrance points and the tumor generally does not change significantly with patient motion. The study is also limited to situations where the tumor or PTV is large compared to the beam width and the breathing motion displacement.
2. Methods and Materials
2.1. Simulations
The HT dose, D, delivered to a point, y, on the axis of gantry rotation can be expressed as the following integral:
| (1) |
where Ψ(t) is the specified on-axis beam intensity at time, t, and B(y) is the beam profile per unit intensity, y(t) is the location of the beam center at time, t, and ttot is the total treatment time. The Ψ(t) function is obtained from the HT treatment planning system (TPS), and is designed such that D(y) meets the prescription goals of a particular case. Although methods that account for patient motion in the calculation of Ψ(t) are under development (Lu et al 2007, Zhang et al 2007), the standard TPS neglects patient motion. This study is important for understanding the basic nature of unwanted dose modulations that can result from these unplanned positional variations that come from breathing and are not accounted for in the TPS. The function, Ψ(t), was chosen to be a rectangular function, Π(y) that is unity for -1/2 < y < 1/2 and vanishes elsewhere.
The longitudinal profile of a HT beam of a=2.5 cm width, at isocenter and depth in water of 15 cm can be modeled as follows by fitting the profile derived from a stand-alone version of the TomoTherapy Hi-ART™ (Lu et al 2005) dose calculator (Kissick et al 2007b). A form very similar to that fit is used here:
| (2) |
for two components, where σp and σs is the spread associated with primary or scattered photons respectively: σp=0.4cm, and σs=20σp. The scatter and the primary are then added together and normalized with a constant C for the complete longitudinal beam profile. Because the HT device has no flattening filter, the beam profile has a sizable scatter tail.
For these simulations, without any modulation or optimization effects on a one dimensional grid of 4096 temporal and spatial steps, a function for a centrally located voxel position into the bore is specified as follows:
| (3) |
where ybreathing(t) is the breathing displacement projected onto the y-axis (into the bore), and vcouch is the couch speed. This ybreathing(t) breathing function produces unaccounted for positional variations. The constant couch speed relates time to position in the TomoTherapy TPS, but the breathing motion is not included which is why these simplified simulations are useful.
2.1.1. Mock breathing function
The useful aspect of using mock breathing displacement functions is the ability to separate the average amplitude from the varying amplitude, and likewise the varying period from the average period. The breathing function will generally have a complicated irregular form, but can be approximated in this study with a function parameterized as follows using the Lujan et al (1999) formulation extended to include time-dependent breathing amplitudes and offsets:
| (4) |
Note the factor two difference from a pure cosine wave in the period because of the even exponent. The period T(t) = μT + δT(t), the offset yoffset(t) = δyoffset(t), and the amplitude, A(t) = μA + δA(t) have random components that have a rect sampling distribution. The delta terms are breathing induced variations.
The value n=2 was chosen in the current work in order to model the situation for which more time is spent at exhale than inhale, which requires that n > 1. This choice of n was also somewhat arbitrary, however, as evidence exists suggesting that the use of n = 1, 2, or 3 will all result in similar correlations between measured breathing data and the model of equation 4 (George et al 2005).
One can, with appropriate choices in the parameters, simulate the randomness in the breathing displacement and period. The mock traces were used to uncover the qualitative trends that occurred as a result of varying the mean values independently of the varying values. One extreme was to set all the varying parameters to zero: regular function. In that situation, the spread in the Fourier spectrum (power spectrum) of ybreathing(t) would be zero. The spread in the Fourier spectrum of ybreathing(t) is defined as σf, and the frequency that corresponds to the mean period is μf (see Fig. 2).
Fig. 2.
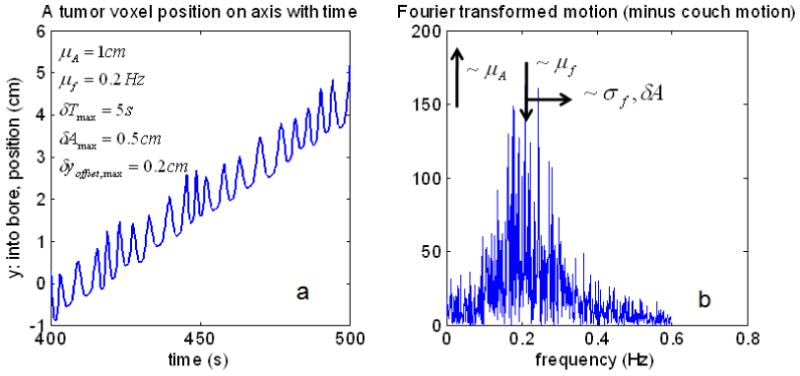
An example of a mock breathing function with parameters indicated, a. Its Fourier transform with parameters and their trends indicated, b.
2.1.2. Surrogate breathing function
Even without information connecting a surrogate breathing waveform to the actual tumor motion, the time dynamics and relationships between random and regular components are all retained in the waveform itself. In order to explore these realistic signals, breathing surrogate readings were used, again assuming 1D longitudinal dynamics. The waveforms are from Varian's Real-Time Position Management (RPM)™ optical tracking system. These data were provided to us from another group and another study (George et al 2005). We selected 100 surrogate waveforms from that dataset such that there were 20 randomly selected patients with 5 randomly selected waveforms per patient. These data were acquired via an infra-red reflective marker that was placed on the abdomen to measure the anterior-posterior motion for 4 min at a measurement frequency of 30Hz.
The amplitude distributions for all 100 waveforms were scaled such that the differences between the 3rd and 1st quartiles of the amplitude distributions were equal to the same value A. It was then assumed that the amplitudes are identical to the y-displacement. The parameter A was varied for a range of values, and the effects on the resulting dose distributions were assessed. The waveforms were too short in time, so they were repeated with a smooth connection. The boxplots of the displacement distributions from these data are provided in Fig. 3 which shows the method of scaling and the displacement distribution variations and similarities between waveforms.
Fig. 3.
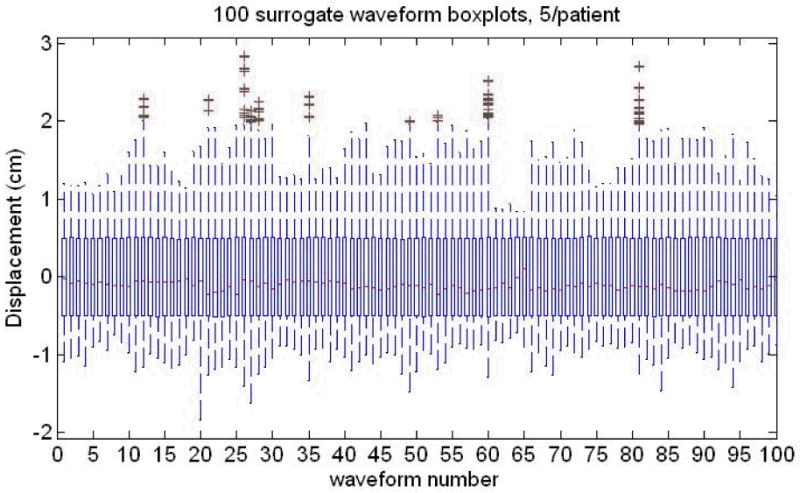
The Breathing surrogate waveforms from a large set of data provided to us [see text for more information]. The interquartile distance between the 3rd and 1st quartiles is varied but made the same, A, for all 100 waveforms, 5/patient, 20 patients. Note the large variation in outliers, medians (red lines inside the boxes) both within and between patients. The thin ‘box’ for each distribution is formed by the 1st and 3rd quartiles of the breathing displacement distribution.
2.2. Experiment
2.2.1. Motivation
The leaf motion cycling between being open and being closed for intensity values generated by an optimizer is of the order of a few Hz (Olivera et al 1999), and that rate is much faster than the typical breathing frequency. A Fourier transform of the breathing surrogate waveforms described in the previous section shows that there is very little magnitude in the spectrum above 1 Hz. A powerful test is to take a regular breathing function and send it through a realistic plan with realistic leaf motions. If the dose profiles are the same, both uniform inside the PTV, then the leaf motion was averaged through and is not a part of the breathing induced longitudinal dose modulations investigated here. This experiment provides validation of the 1D simulations used earlier. The motion input to the 4D phantom is described in section 2.1.1 and 2.2.2 below. The treatment plan that assumes no movement (3D) is defined in section 2.2.3. The 3D plan was delivered to the 4D phantom (section 2.2.5) containing the dosimetry film (section 2.2.4). The measurements were also repeated without motion.
2.2.2. Realistic mock breathing motion
A 4D Motion Phantom purchased from WUSTL (Malinowski et al 2007) was used for this experiment. We made realistic motion based on Eq. 4 with elliptical patterns (Low et al 2005, Seppenwoolde et al 2002) pictured in Fig. 4. The magnitude of the average displacements was designed to match the average values for a lower lobe tumor derived from values in (Seppenwoolde et al 2002) and are as follows: craniocaudal (longitudinal, y, into the bore) = 9.23mm, antereoposterior (transverse, z, up down) = 1.69mm, and lateral (transverse, x, patient left-right) = 1.23mm. There was more randomness in the inhale phase and less in the exhale. The pattern was constructed by using Eq. 4 for the longitudinal displacement and interpolating it onto an ellipse in the craniocaudal-antereoposterier plane, and it was just linearly angled in the lateral plane. The randomness is cycle-to-cycle. We used a rect sampling distributions with a value equal to the average extend of the motion at inhale (9.23mm longitudinally), and much smaller, offset sampling, of 0.5mm at exhale. The period was 5s with a rect sampling distribution for cycle-to-cycle period randomness also equal to 5s. We also compared this random function with a perfectly regular function (see Fig. 4) of the same magnitude and shape. Then these are compared with the case with no breathing motion at all. This motion amplitude along with its corresponding random component is much smaller than both the beam width (2.5cm) and the tumor size (several cm). The goal was to explore the dose modulations internal to the tumor, away from the PTV or tumor edges.
Fig. 4.
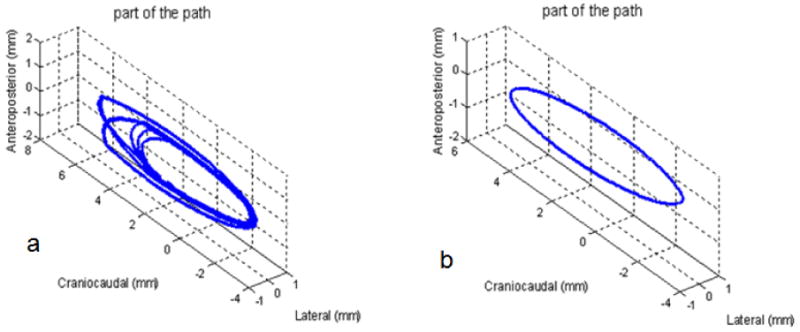
Example of the realistic motion paths used for the experiment. a. is the random motion and b. is purely regular motion. See text for more information on the parameters for each.
2.2.3. TomoTherapy plan
The HT plan was intended to represent a complex treatment with sufficient modulation in the delivery sinogram for a good test of the leaf dynamics which was not considered in the simulations of section 2.1. It does not represent any particular anatomical site. The plan was delivered to a homogeneous phantom since tissue composition between the beam entrance points and the tumor usually does not change significantly with patient motion. See Fig. 5 for a picture of the structures with the dose calculation in Gy shown for the transverse and sagittal slices. There is some distance at either end of the phantom to get a dose gradient on the film. The film was inserted at the horizontal midplane.
Fig. 5.
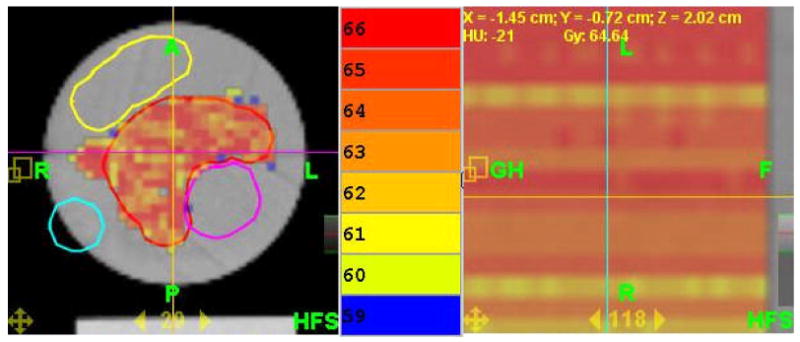
The TomoTherapy plan used in the experiment shown here with its calculated dose, transverse (left), and sagittal or longitudinal (right, note: expanded scale). The color bar is in the middle and note that the colors are separated by only 1 Gy. Also note that longitudinally in the PTV, the plan profile is very flat. The purple, yellow, and light blue structures are avoidance structures. See text for other details of the phantom and the plan.
The pitch was set at 0.287 to minimize the thread effect (Kissick et al 2005a) and the beam width was set at 2.5cm, a typical value. The prescription was 60 Gy for 15 fractions to 95% of the PTV. The actual mean dose was 64.16 Gy with a standard deviation of 2.86 Gy. The PTV volume was 155.85cc. The planning modulation factor was 3.0, providing an actual modulation factor of 1.619, and these values are typical. The uniformity was deemed acceptable, and as is shown in Fig. 5, the calculated dose variation longitudinally is nearly zero despite the presence of three avoidance structures (one embedded that makes the PTV have concavity) that produce a highly modulated delivery sinogram. Note the expanded scale for the sagittal part of Fig. 5.
2.2.4. Film Measurement
Because we wanted no change to the leaf motions from an actual delivery, Gafchromatic EBT™ radiochromic dosimetry film was used since it has a very nearly linear dose response that extends well into the typical fraction's dose range. It was allowed to develop for exactly one day, with orientations, temperature, light exposures all consistent. The film was scanned in the middle of an Epson 10000XL scanner in the red component. A light flattening correction was used, but was not needed for this large scanner – its already flat within 1% in the center for our 12 cm × 12 cm field. The cylindrical test film phantom is a cylinder 12 cm long and 12 cm diameter custom made of solid water cut for film placed horizontally.
2.2.5. Set-up
The cylindrical test phantom was suspended off the end of the couch coaxially (see Fig. 6) into the bore of the HT device. The image of the couch was removed from the CT dataset to approximate this irradiation condition. In order to do this, the y-offset from set-up position outside the gantry was modified so that the phantom can be irradiated off the end of the couch.
Fig. 6.
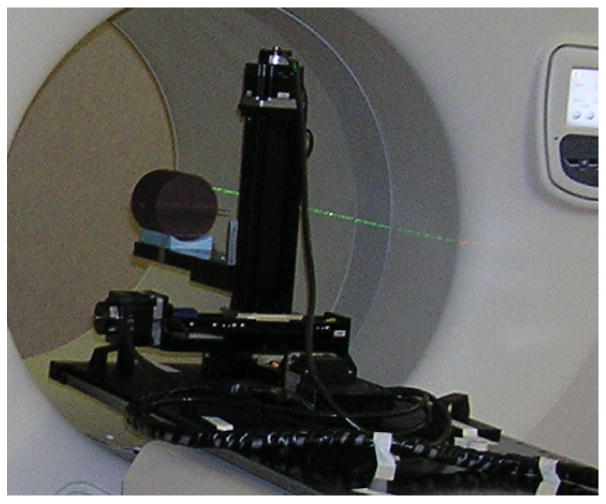
The set-up at the start of the experiment is shown.
3. Results
3.1. Simulations
3.1.1. Mock breathing function
The utility of the mock breathing function is the ability to specify a purely regular function – all the random components equal to zero. Without randomness, the dose modulations vanish (see Fig. 7). When the random components' sampling width are all set equal to the mean values, the pictures in Fig. 8 are the result. The upper right figure, b, in both is the dose as a function of position and time. If one chooses a position, y, and plots that dose(t), the lower left, c, picture results. This is a view of how the dose is accumulated in time at that position. If the function is random, then this picture, c, will be different from one y position to another leading to the dose modulations in d. If the function is regular, and there are a large number of breathing cycles involved, then phasing is not a issue as it would be for larger couch velocities (Kissick et al 2005b), and no dose modulations will be observed, especially with the addition of a scatter tail which these simulations include.
Fig. 7.
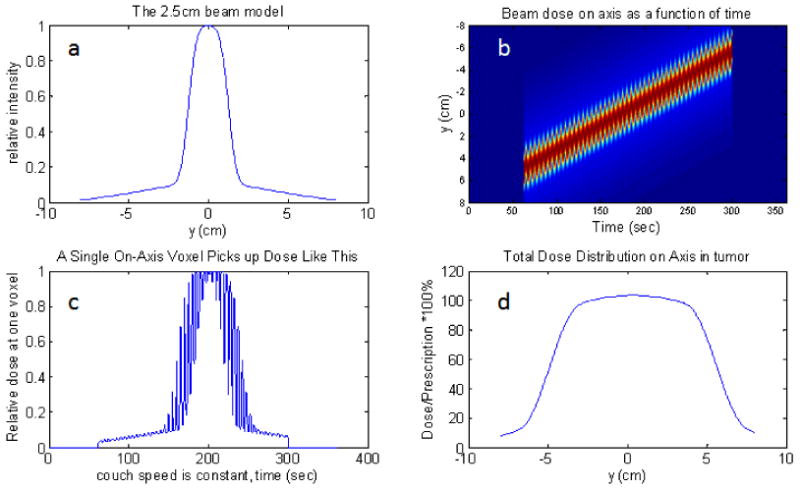
Purely regular motion, 1cm peak to peak amplitude on axis with a 2.5cm beam and all leaves open. The upper-left plot is the beam model, a. The upper-right is the dose(y,t) function, b. If one chooses a particular voxel in b, and plot its dose(t), then the lower left plot is obtained, c. If one time-integrates the dose for each position, then the dose profile is obtained: lower-right plot, d. Notice that there are no unwanted dose modulations in d.
Fig. 8.
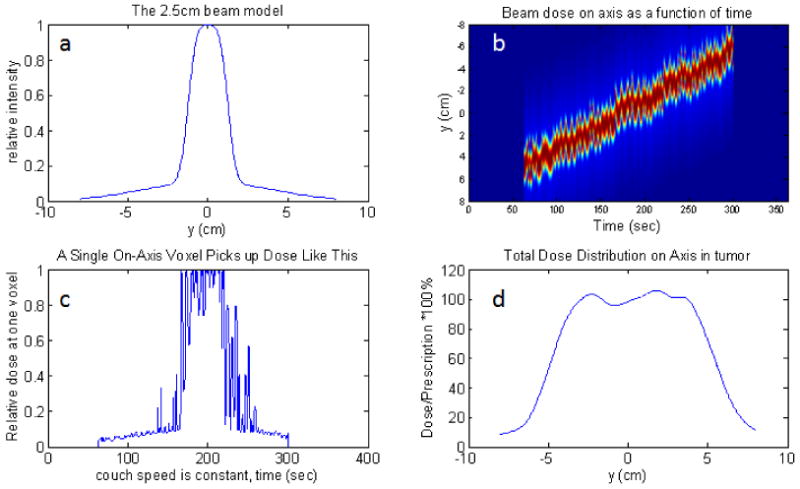
Irregular motion with full range sampling in each parameter, 1cm peak to peak amplitude on axis with a 2.5cm beam and all leaves open. The upper-left plot, a, is the beam model. The upper-right,b, is the dose(y,t) function. If one chooses a particular voxel, and plot its dose(t), then the lower left, c, plot is obtained. If one time-integrates the dose for each position, then the dose profile is obtained: lower-right plot, d.
The exact measure of the dose modulations and the quantitative trends produced with the mock functions are not as valuable because one should use an actual surrogate function from many real patients to get a useful result. People will breath with similar functions used here (George et al 2005). Parameter trends and their explanation, achieved in retrospect are displayed in Table 1.
Table 1.
Summary of the qualitative trends seen in the mock function simulations, and in retrospect, their interpretation.
| Increase in cycle-to-cycle random: (all else equal) | Gave a dose variation that: | Because: |
|---|---|---|
| Offset variation | Increased | positional variation increased |
| Mean amplitude | Decreased | more cycles were averaged in |
| Amplitude variation | Increased | positional variation increased |
| Mean Period | Increased | fewer cycles averaged in |
| Period variation | No change | no positional variation |
| Couch speed | Increased | fewer cycles were averaged in |
| Beam width | Decreased | more time in constant fluence |
It should be noted that the period variations produces almost no dose modulations. The reason is that if the variations are cycle to cycle and there are many cycles, then very little average positional variation along a dose gradient is produced. It should also be noted that if the mean amplitude of the variation is increased, with no increase in randomness, then the dose variations will decrease. This happens because, for a given couch motion or time, more breathing cycles are backing into and out of the beam since the ‘throw’ of the breathing position swing is larger. All of the trends relate to how many breathing induced cycles are getting averaged into total positional variation from one position to another along a strong dose gradient – the beam edge. To reduce dose modulations, one should decrease offset and amplitude variations with respect to the mean amplitude. One should be less concerned about period variations, though faster breathing is helpful. A higher beam width is also beneficial if it is possible from a longitudinal margin standpoint. Finally, the couch speed is usually tied to the gantry period (if > 15sec), but if possible, slower couch speeds are beneficial.
3.1.2. Surrogate breathing function
With realistic breathing waveforms, it is possible to be a bit more predictive. Even though the overall scaling is arbitrary without a 4D-CT, if we have assumed that the surrogate time function maps directly and linearly onto a longitudinal position function, then expected dose modulations can be calculated with these simplifying assumptions. See Fig. 9 for an example of the calculation for waveform number 97. The difference in Fig. 9 from Figs. 7 and 8 is the upper left panel, a, that displays the Fourier spectrum of this waveform instead of the beam profile which is the same. One can notice that the spectrum of this waveform is similar to the mock function in Fig. 2b.
Fig. 9.
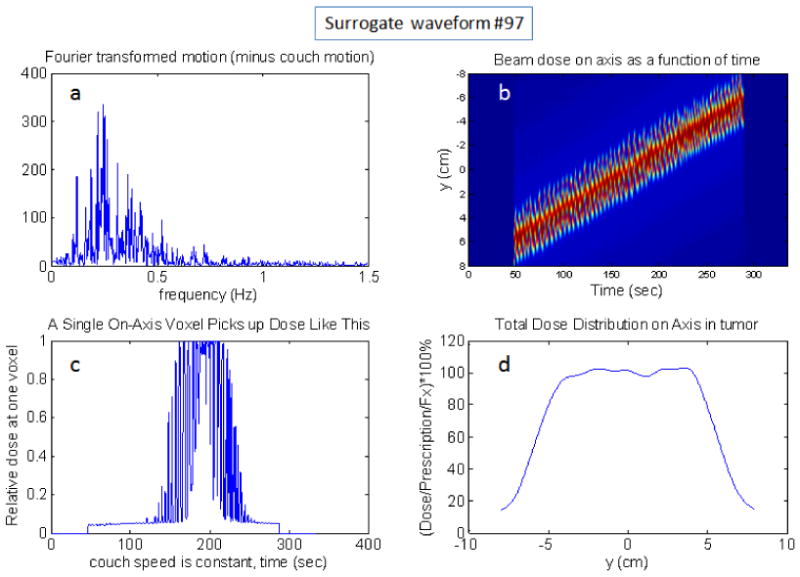
Example simulation using surrogate motion waveform number 97 with 1st to 3rd interquartile distance in the displacement histogram scaled to 1cm amplitude with a 2.5cm beam and all leaves open. The upper-left plot, a, is the Fourier transformed breathing motion (spectrum). The upper-right,b, is the dose(y,t) function. If one chooses a particular voxel, and plot its dose(t), then the lower left, c, plot is obtained. If one time-integrates the dose for each position, then the dose profile is obtained: lower-right plot, d.
When the dose profiles of 20 patients are summed and normalized and a histogram is created, then the distribution of the normalized dose per fraction is Gaussian. It is necessary to use many waveforms because each waveform's dose profile will have a very non-Gaussian distribution. The 20 waveforms were enough to make the dose histogram invariant to the particular choice of waveforms. With a Gaussian distribution, a standard deviation can be obtained (see Figs. 10 and 11) and used as a robust measure of the probability of certain dose errors at a certain voxel. The 1-cm beam is not considered because it is so small that the breathing motion is on the same order as the beam width: not recommended. The value of the trend line slope in Fig. 10 of ∼ 0.05 (units cancel) can be thought of as follows: for a 2.5cm beam, there is a potential 2% dose error per 1 cm of breathing amplitude per fraction. The end result of N fractions will likely be an N1/2 reduction of dose errors if each fraction's motion is independent.
Fig. 10.
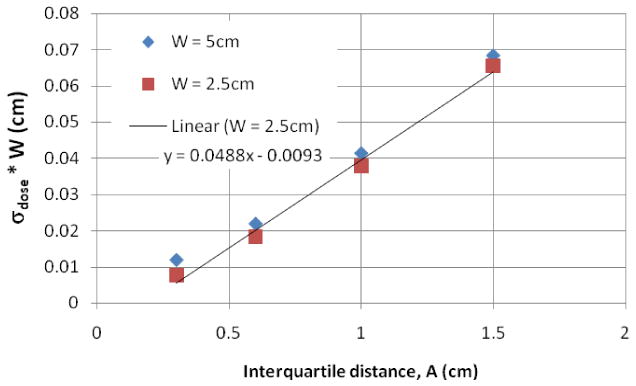
Results of the dose variation times the beam width of 20 breathing surrogate waveforms, one per patient. The amplitude is the interquartile distance between the 3rd and 1st quartiles of the longitudinal breathing displacement. Not shown is the 1cm beam which is the same size as the breathing motion and therefore all edge – not recommended. A linear trendline is also displayed for the W=2.5cm beam, but works equally well for the 5cm beam. The standard deviation has no units since it's a deviation from a dose normalized to the per fraction dose.
Fig. 11.
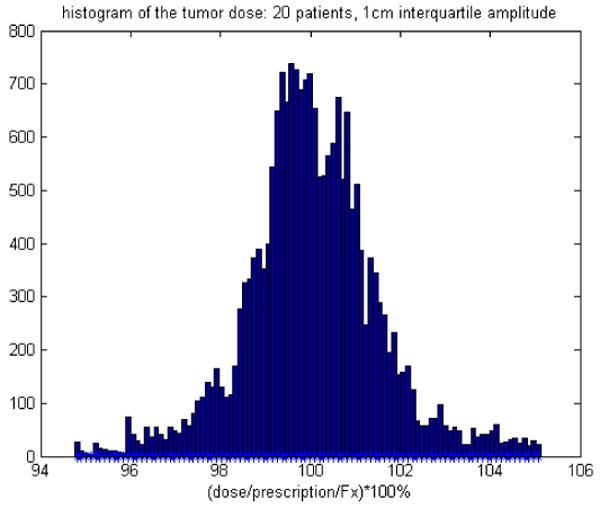
The histogram of 20 waveforms interquartile distance between the 3rd and 1st quartiles of the longitudinal breathing displacement are at 1cm=A.
The dose modulations are sensitive to the magnitude of the positional variations, both offset and amplitude. The dependency found from these data is as follows, based on the results in Figs. 10 and 11:
| (5) |
Here, the amplitude, A, is the interquartile distance between the 3rd and 1st quartiles of the longitudinal breathing displacement. In addition, for W = 2.5cm, and a typical couch speed of 0.478mm/s that matches a gantry period of 15s and a pitch of 0.287, a histogram of the dose variation relative to the planned dose per fraction is presented in Fig. 11. The standard deviation in dose of Eq. 5 is the standard deviation of Figs. 10 and 11. Fig. 11 is a useful way to view the chances of a particular voxel being off of the planned dose for a given set of machine parameters, given that one knows nothing about a particular patient, except that the patient is a member of a large set of similar patients. This probabilistic approach to dose errors was inspired by another, very original work (Unkelbach 2006). More elaborate functional dependencies are left for future work and should really be performed in the context of 4D-CT data.
It is interesting to note that Eq. 5 implies that there is a small advantage to significantly increasing the beam width from 2.5 cm to 5 cm instead of restricting diaphragm motion by < 7.5 mm. In the limit of very small relative changes in A or W, changes in these parameters are equally important (δσdose/σdose = δA/A − δW/W if and only if δA/A and δW/W ≪ 1 but an increase of W from 2.5cm to 5cm is not small). Of course, if a patient can be made to breath regularly, then adjustments to either A or W are not needed as long as A ≪ W.
3.2. Experiment
The lack of any unwanted dose modulations in the regular breathing film (see Fig. 12) is a striking demonstration of the averaging effects of the ∼178 beamlets averaged into each voxel for a pitch of 0.287 and 51 projections per rotation (178=51/0.287). The time required to traverse the beam is (∼15sec/rotation)/(pitch=0.287) = 52 sec, and this is much longer than a breathing period and very much longer than the leaf motions. In fact, the regular motion case provided only blurring and is even a bit better than the no motion case! The amount of edge blurring is minimal since the amplitude of the motion is about 1 cm versus the beam width which is 2.5 cm. Each is acting to smooth the profile longitudinally. The best way to explore how they relate is to consider a modulation transfer function approach for dose delivery, a ‘DTF’ which was explored for HT (Kissick et al 2007a).
Fig. 12.
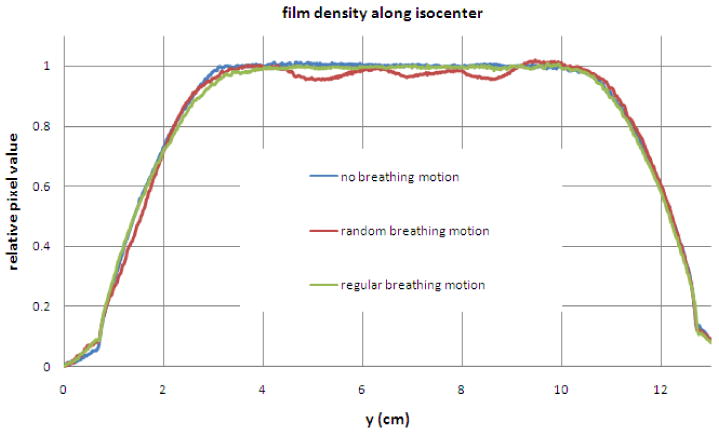
Profiles with about 5mm transverse average of pixel values. The regular motion provides only blurring and is even a bit better than the no motion case. The random motion case has obvious dose modulations which must not be caused by the complex leaf motion since the regular motion case shows such a smooth profile with identical leaf motions.
The random case film clearly shows the dose modulations. The only data manipulation was the use of a light field flattening correction, which was not really needed anyway for the large scanner used (Epson 10000XL), and the pixel values were averaged 5mm transverse to the profile to reduce the pixel noise in order to emphasize the trend in the profile.
4. Discussion
4.1. Theoretical view and dependencies
Neglecting interference effects from leaf motion and its modulation effects, the dose, D, into the bore, and near the axis for this problem can be modeled for tomotherapy simply by Eq. 1. Since the intensity instruction is binary, a simple rect function such as the following was used: Ψ(t) = Π(t/ton), where ton is the total time that the planned intensity is not zero. Then Eq. 1 can be written in a simpler form with constant integral limits. If one then does a linear perturbation (represented by a ‘∼’ character) of that simpler form to explore the first order, linearizable, variations, then the following is the resulting integral that relates the variations in dose to the variations in the beam profile's relative position:
| (6) |
The function B(y) is the longitudinal beam profile (see Eq. 2). It should be noted that the perturbation taken above is assumed to be small, and because the limits are constant, the perturbation of D is related to the perturbation of the integrand. If one is considering low frequency breathing components that would cause interference, then Eq. 6 will still hold, but the perturbation will be caused by the breathing displacement less than, or on the order of, a single breathing cycle moving through the beam.
Notice that the variations are related by an integral, essentially an average of the beam wobble from breathing at each position in the prescription, y. The variations in the beam profile can be related to variations in position by the chain rule: B̃ = (dB / dy)ỹ. The perturbation in the y position, ỹ, is just ybreathing(t) defined earlier. By substitution, Eq. 6 becomes:
| (7) |
The Eq. 7 is the intuitive result that explains the observation in the situation that dB / dy is finite (a beam with a penumbra). In the case of an idealized sharp beam edge: dB / dy ∼ ∞, one must remain with Eq. 6 which holds for all frequencies and beam shapes. If a voxel never leaves the beam, or never enters the beam, and dB / dy = 0 for all of its movements, then there will not be a dose variation. If a voxel either experiences a beam edge, or experiences any dB / dy ≠ 0 during its motion, then there will be a dose variation related to the average of its displacement weighted by that gradient. If the motion is regular, then the average will be close to zero if far from the interference condition that the positional variations are on the order of the couch speed relative to the beam dimensions. If there are drift motions or low frequency components to the breathing, then some interference will occur. If the couch speed is much faster than typical, then interference effects will also be observed (Kissick et al 2005b). However, by exploring the 100 RPM waveforms with frequency filtration, the major dose modulation effect from breathing in HT is from irregular breathing near the peak of the power spectrum, far from the interference frequency scales.
We are typically far from the interference time scale close to the region where W / vcouch, the beam width at isoceneter defined by the FWHM, relative to the couch speed. The value of this ratio is typically about 25mm/0.5mm/s ∼ 50s. This time scale is an order of magnitude larger than a typical breathing period, and is about the same time scale as it takes for a voxel to fully enter the beam during breathing since the breathing amplitude is on the order of the beam width, usually a factor of 2 smaller. The leaf motion, by stark contrast is on a time scale of the gantry period, 15-20s usually, divided by the number of projections, 51. In other words, leaves are opening and closing very quickly (they are called ‘binary’ MLCs), and they even stay open or closed on the order of much less than a second, much longer than the milliseconds that a leaf needs to either open or close (Olivera et al 1999). It is true serendipity that the breathing (∼0.2 Hz) occurs between these fundamental time scales of TomoTherapy delivery (∼0.02 Hz for the jaws/couch and ∼2 Hz for the leaves)! It is another demonstration of the relative seperability of directions described in (Kissick et al 2007a). The times scales are depicted in Fig. 13, and note that the integral of Fig. 13b is the dose at that y position. The variations in the dose(t) shown in Fig. 13b demonstrate visually the integrand of Eq. 7: (dB / dy) · ỹ(t). This can also be seen in Figs. 7c, 8c, and 9c. Notice that the breathing positional variations can be seen in the dose(t) where dB / dy is significant.
Fig 13.
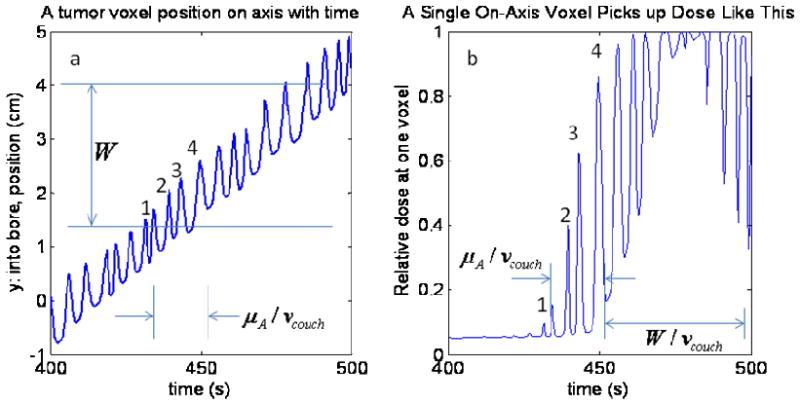
In this depicted example, the number of cycles experiencing the large gradient at the beam edge is on the order of 4 cycles and is proportional to the mean breathing displacement amplitude about the mean breathing frequency and inversely proportional to the couch velocity. If the beam had a square shape with no penumbra or scatter tail, then the only dose variation would be the variation in the 4 partially exposed voxels. However, the real beam has a gradient that spans much of its width. Therefore, a wide penumbra and scatter tail act to reduce the difference in roles of the beam width and the mean motion displacement amplitude. The conditions and parameters are the same as in Fig. 2.
There is one aspect of the delivery which is not so lucky. First consider that there is typical breathing, except that it is perfectly regular – just a delta function for the power spectrum. In this case, the average displacement experienced for the whole time a voxel is partially in the beam by any voxel in question relative to the vcouch · t position is only changed from one y position to another as result of the breathing phase shift and not any average of the amplitude or offset since only regular breathing it at issue. With a very large number of breathing cycles averaged in, the result will just be smeared edges, but no big change in the weighted average of the relative beam position: see Eq. 7.
When the breathing is irregular and therefore has a significant spread in the power spectrum, measured by the standard deviation of the breathing frequency spectrum as its projected onto the y-axis: σf, then the weighted average value of the relative beam position variation will be affected according to the number of cycles that come into this average.
4.2. Implications for treatment
The main result of this paper is the recognition of the importance of regular breathing in controlling unwanted dose modulations. Even with the use of motion management tools that will also require predictable breathing (Zhang et al 2007, Lu et al 2007), regular motion will be useful. However, if the breathing is the typically small value longitudinally, about 1cm, and is regular enough (and the exact value is yet to be determined), then motion management will likely not even be needed. In fact, for average breathing amplitudes, this work suggests that regular breathing could even provide a net beneficial smoothing effect (see Fig. 12)! The use of any coached breathing technique, if not too cumbersome, could prove to be very useful for HT.
A good approach to reduce these unwanted dose modulations is also to create faster and shallower breathing, and that is likely to happen with a device like the BodyFix™ (Medical Intelligence, Munich, Germany) (Zhang et al 2005). Since for a real patient, the average and the random will scale together, and since reducing the combined random and mean breathing amplitude had a beneficial effect (see Fig. 10 and Eq. 5), these techniques are expected to be very useful. The higher the mean breathing frequency is, the smaller the dose modulations as well. The most important thing is to avoid lots of variation in the lower frequency components and to not use the smaller 1cm beam width. The 1cm beam width is on the order of the breathing amplitude and provides for a much higher dose modulation as compared to the 2.5 cm beam. One could also use a breath-hold technique to reduce dose modulations, but then one would need to accelerate the delivery (Kim et al 2005).
In the future, one may be able to take a Fourier transform of the breathing for a particular patient, and determine the need for any motion management and even the risk of using it if the patient cannot be made to breath regularly. The spread in the spectrum and the overall shift in its mean, along with the magnitude of the displacement are likely the parameters of interest, but more work is required beyond this paper and with 4D-CT data to more accurately arrive at dependencies from all parameters. The details of the leaf motion that are on a much faster time scale, and with so many beamlets for each voxel, are not important concerns for these particular longitudinal motion dose modulations: power in the breathing spectra above 1Hz is usually negligible. It has been shown that rotational variations of output, also on a faster time scale than the couch motion, tend to average out much more than one might at first suspect, either without additional randomness (Fenwick et al 2005) or with such randomness (Flynn et al 2008).
Because the HT device that TomoTherapy, Inc. produces operates in a manner that delivers its modulated beamlets on two distinct spatial scales (∼2.5cm longitudinally and ∼6mm transverse) and two distinct time scales (∼10's of seconds longitudinally and less than a second transverse), its at a relative advantage with respect to interference effects with breathing that operates in the middle of these scales (∼1cm spatially and few seconds temporally).
When considering intrafractional motion, it is important to now broaden the discussion beyond margins (Van Herk 2004, Keall et al 2006), and into a more comprehensive approach related to the fundamental frequency and times scales that various devices are sensitive to. Then relate this machine specific information to patient specific motion information. As much as possible the machine and patient time scales should not interfere with each other, and any useful averaging to reduce sensitivities should be sought after.
5. Conclusion
The previously observed (Chaudhari et al 2007) unwanted dose modulations are shown in this study to be the result, not of the complex highly modulated helical nature of HT, but instead of the unmodulated simplification of HT that is possible because the pitch is tight. The tight pitch often used has the effect of separating the characteristic spatial and temporal machine scales away from the typical breathing temporal and spatial scales thereby actually minimizing interference effects.
The unwanted effect that does still come through is related to variation in the breathing position along the dose gradient of the beam profile as the couch is continuously moving. Typically a few to several breathing cycles will experience the gradient on one end of the beam, and that number is such that one will see a variation in the mean of these positional variations. If more breathing cycles can be made to average into the calculation, or if the variation can be made smaller, then the unwanted dose modulations will be negligible, and there are already successful techniques available to do that (Keall et al 2006). However, many patients may not need any special techniques and it is likely that many patients will have motion that shows no dosimetric difference with HT from the case in which they were completely rigid with respect to the couch motion: even with lots of complex modulation.
Acknowledgments
The authors are very grateful for the cooperation of TomoTherapy, Inc., and the support of the facilities and staff at the University of Wisconsin Paul P. Carbone Comprehensive Cancer Center. In particular, we thank Wolfgang Tomé and Amar Basavatia for help with the 4D Phantom acceptance, and the useful discussions and the 4D Phantom from Washington University in St. Louis, MO. We are grateful for the help of David Lewis and the staff at International Specialty Products for advice on the use of their EBT films. This work was supported by the United States National Institute of Health grants K25 CA119344, T32 CA09206, and also the P01 CA88960. In addition, the grant from the United States National Science Foundation, 0427689, and the Susan Komen Grant BCTR0504129 helped support this work. In particular, the breathing surrogate waveforms leant to us from Paul Keall were extremely useful for this work and other explorations. The authors T. Rock Mackie and Peter Hoban have ownership interests in TomoTherapy, Inc. which is commercializing helical tomotherapy. Last but certainly not least, the authors are very grateful to Scott Johnson for making a small solid water “minicheese” phantom.
References
- Chaudhari S, Rangaraj D, Goddu S, Malinowski K, Lu W, Parikh P, Low D. Breathing motion-induced dose delivery error evaluations as applied to Tomotherapy dose delivery - Talk TU-D-M100F-09. Med Phys; American Association of Physicists in Medicine, 49th Annual Meeting; Minneapolis MN, USA. July 22-26, 2007; 2007. p. 2561. [Google Scholar]
- Fenwick JD, Tomé WA, Kissick MW, Mackie TR. Modelling Simple Helically Delivered Dose Distributions. Phys Med Biol. 2005;50:1505–17. doi: 10.1088/0031-9155/50/7/013. [DOI] [PubMed] [Google Scholar]
- Flynn RT, Kissick MW, Mehta MP, Olivera GH, Jeraj R, Mackie TR. The Impact of Linac Output Variations on Dose Distributions in Helical Tomotherapy. Phys Med Biol. 2008;53:417–30. doi: 10.1088/0031-9155/53/2/009. [DOI] [PMC free article] [PubMed] [Google Scholar]
- George R, Vedam SS, Chung TD, Ramakrishnan V, Keall PJ. The Application of the Sinusoidal Model to Lung Cancer Patient Respiratory Motion. Med Phys. 2005;32:2850–61. doi: 10.1118/1.2001220. [DOI] [PubMed] [Google Scholar]
- Kanagaki B, Read PW, Molley JA, Larner JM, Sheng K. A Motion Phantom Study on Helical Tomotherapy: the Dosimetric Impacts of Delivery Technique and Motion. Phys Med Biol. 2007;52:243–55. doi: 10.1088/0031-9155/52/1/016. [DOI] [PubMed] [Google Scholar]
- Keall PJ, Mageras GS, Balter JM, Emery RS, Forster KM, Jiang SB, Kapatoes JM, Low DA, Murphy MJ, Murray BR, Ramsey CR, Van Herk MB, Vedam SS, Wong JW, Yorke E. The Management of Respiratory Motion in Radiation Oncology Report of AAPM Task Group 76. Med Phys. 2006;33:3874–900. doi: 10.1118/1.2349696. [DOI] [PubMed] [Google Scholar]
- Kim B, Kron T, Battista J, Van Dyk J. Investigation of Dose Homogeneity for Loose Helical Tomotherapy Delivery in the Context of Breath-hold Radiation Therapy. Phys Med Biol. 2005;50:2387–404. doi: 10.1088/0031-9155/50/10/014. [DOI] [PubMed] [Google Scholar]
- Kissick MW, Boswell SA, Jeraj R, Mackie TR. Confirmation, Refinement, and Extension of a Study in Intrafraction Motion Interplay With Sliding Jaw Motion. Med Phys. 2005b;32:2346–50. doi: 10.1118/1.1935774. [DOI] [PubMed] [Google Scholar]
- Kissick MW, Flynn RT, Westerly DC, Mackie TR, Hoban PW. On the Making of Sharp Longitudinal Dose Profiles with Helical Tomotherapy. Phys Med Biol. 2007b;52:6497–510. doi: 10.1088/0031-9155/52/21/011. [DOI] [PMC free article] [PubMed] [Google Scholar]
- Kissick MW, Fenwick J, James JA, Jeraj R, Kapatoes JM, Keller H, Mackie TR, Olivera GH, Soisson ET. The Helical Tomotherapy Thread Effect. Med Phys. 2005a;32:1414–23. doi: 10.1118/1.1896453. [DOI] [PubMed] [Google Scholar]
- Kissick MW, Mackie TR, Jeraj R. A Delivery Transfer Function (DTF) Analysis for Helical Tomotherapy. Phys Med Biol. 2007a;52:2355–65. doi: 10.1088/0031-9155/52/9/002. [DOI] [PubMed] [Google Scholar]
- Low DA, Parikh PJ, Lu W, Dempsey JF, Wahab SH, Hubenschmidt JP, Nystrom MM, Handoko M, Bradley JD. Novel Breathing Model For Radiotherapy. Int J Rad Onc Biol Phys. 2005;63:921–29. doi: 10.1016/j.ijrobp.2005.03.070. [DOI] [PubMed] [Google Scholar]
- Lu W, Olivera GH, Chen ML, Reckwerdt PJ, Mackie TR. Accurate Convolution / Superposition for Multi-resolution Dose Calculations Using Cummulative Tabulated Kernels. Phys Med Biol. 2005;50:655–80. doi: 10.1088/0031-9155/50/4/007. [DOI] [PubMed] [Google Scholar]
- Lu W, Chen M, Chen Q, Ruchala K, Olivera G. Real Time Motion Adaptive Tomotherapy Delivery. Proceedings of the 15th International Conference on the Use of Computers in Radiation Therapy; Toronto, CA. June 4-7, 2007; 2007. pp. 148–152. [Google Scholar]
- Lujan AE, Larsen EW, Balter JM, Ten Haken R. A Method for Incorporating Organ Motion Due to Breathing into 3D Dose Calculations. Med Phys. 1999;26:715–720. doi: 10.1118/1.598577. [DOI] [PubMed] [Google Scholar]
- Mackie TR, Holmes T, Swerdloff S, Reckwerdt P, Deasy JO, Yang J, Paliwal B, Kinsella T. Tomotherapy: a new concept for the delivery of dynamic conformal radiotherapy. Med Phys. 1993;20:1709–19. doi: 10.1118/1.596958. [DOI] [PubMed] [Google Scholar]
- Malinowski K, Noel C, Lu W, Lechleiter K, Hubenschmidt J, Low D, Parikh P. Development of the 4D Phantom for Patient-Specific End-to-End Radiation Therapy QA. In: Hsieh J, Flynn MJ, editors. Proceedings of SPIE – Vol. 6510, Medical Imaging 2007: Physics of Medical Imaging; 2007. 65100E (Mar. 16, 2007) [Google Scholar]
- Olivera GH, Shepard DM, Ruchala K, Aldridge JS, Kapatoes J, Fitchard EE, Reckwerdt PJ, Fang G, Balog J, Zachman J, Mackie TR. Tomotherapy. In: Van Dyk J, editor. The Modern Technology of Radiation Oncology: A Compendium for Medical Physics and Radiation Oncologist. chapter 15 Madison, WI: Medical Physics Publishing; 1999. pp. 521–87. [Google Scholar]
- Seppenwoolde Y, Shirato H, Kitamura K, Shimizu, Van Herk M, Lebesque JV, Miyasaka K. Precise and Real-Time Measurement of 3D Tumor Motion in Lung Due to Breathing and Heartbeat, Measured During Radiotherapy. Int J Rad Onc Biol Phys. 2002;53:822–34. doi: 10.1016/s0360-3016(02)02803-1. [DOI] [PubMed] [Google Scholar]
- Unkelbach J. PhD thesis. University of Heidelberg; Germany: 2006. Inclusion of Organ Motion in IMRT Optimization Using Probabilistic Treatment Planning. [Google Scholar]
- Van Herk M. Errors and Margins in Radiotherapy. Sem in Rad Onc. 2004;14:52–64. doi: 10.1053/j.semradonc.2003.10.003. [DOI] [PubMed] [Google Scholar]
- Zhang T, Orton NP, Tomé WA. On the Automated Definition of Mobile Target Volumes from 4D-CT Images for Stereotactic Body Radiotherapy. Med Phys. 2005;32:3493–502. doi: 10.1118/1.2106448. [DOI] [PubMed] [Google Scholar]
- Zhang T, Lu W, Olivera G, Keller H, Jeraj R, Manon R, Mehta M, Mackie TR, Paliwal B. Breathing Synchronized Delivery (BSD): A Potential Four Dimensional Tomotherapy Treatment Technique. Int J Radiat Oncol Biol Phys. 2007;68:1572–78. doi: 10.1016/j.ijrobp.2007.02.054. [DOI] [PMC free article] [PubMed] [Google Scholar]


