

Abstract
Oxidative stress and protein glycation can contribute to the development of insulin resistance and complications associated with type 2 diabetes mellitus. The antioxidant α-lipoic acid (ALA) reduces oxidative stress and the formation of advanced glycation end products (AGEs) and improves insulin sensitivity in skeletal muscle and liver. The AGE inhibitor pyridoxamine (PM) prevents irreversible protein glycation, thereby reducing various diabetic complications. The potential interactive effects of ALA and PM in the treatment of whole-body and skeletal muscle insulin resistance have not been investigated. Therefore, this study was designed to determine the effects of combined ALA and PM treatments on reducing muscle oxidative stress and ameliorating insulin resistance in prediabetic obese Zucker rats. Obese Zucker rats were assigned to either a control group or to a treatment group receiving daily injections of the R-(+)-enantiomer of ALA (R-ALA, 92 mg/kg) or PM (60 mg/kg), individually or in combination, for 6 weeks. The individual and combined treatments with R-ALA and PM were effective in significantly (P < .05) reducing plantaris muscle protein carbonyls (33%−40%) and urine-conjugated dienes (22%−38%), markers of oxidative stress. The R-ALA and PM in combination resulted in the largest reductions of fasting plasma glucose (23%), insulin (16%), and free fatty acids (24%) and of muscle triglycerides (45%) compared with alterations elicited by individual treatment with R-ALA or PM. Moreover, the combination of R-ALA and PM elicited the greatest enhancement of whole-body insulin sensitivity both in the fasted state and during an oral glucose tolerance test. Finally, combined R-ALA/PM treatments maintained the 44% enhancement of in vitro insulin-mediated glucose transport activity in soleus muscle of obese Zucker rats treated with R-ALA alone. Collectively, these results document a beneficial interaction of the antioxidant R-ALA and the AGE inhibitor PM in the treatment of whole-body and skeletal muscle insulin resistance in obese Zucker rats.
1. Introduction
Oxidative stress is the result of an imbalance between antioxidant activity and oxidant production within cells and plasma, in which oxidant production exceeds antioxidant activity. Oxidative stress is frequently associated with the multifactorial etiology of insulin resistance, characterized by a reduced ability of insulin to mediate glucose disposal, primarily in skeletal muscle [1-3]. This oxidative stress–associated insulin resistance in skeletal muscle likely develops because of oxidant-induced impairment of insulin signaling [4]. The oxidative stress and insulin resistance are associated with several other atherogenic risk factors, including hypertension, dyslipidemia, atherosclerosis, and central obesity, a condition referred to as the syndrome X, [5,6] the insulin resistance syndrome, [7] or the cardiometabolic syndrome [8].
Conditions of increased oxidative stress, such as diabetes and aging, are hallmarked by increased tissue levels of advanced glycation end products (AGEs), the result of nonenzymatic chemical modification of protein by reducing sugars in the so-called Maillard reaction [9,10]. The accumulation of AGEs and related products is thought to be important in the development of diabetic complications [9,10]. Pyridoxamine (PM) is an inhibitor of AGE formation, at least in part via its ability to trap intermediates in AGE formation [11,12]. When administered continuously to a rodent model of type 1 diabetes mellitus characterized by overt hyperglycemia and marked elevations of plasma lipids, PM reduces plasma triglycerides and total cholesterol, which correlates with a diminution of AGEs and an improvement of renal function [13,14]. In addition, when given continuously to a rodent model of prediabetes that displays marked dyslipidemia, the obese Zucker rat, PM causes a reduction in the formation of AGE in tissues such as skin, elicits a diminution of plasma triglycerides and total cholesterol, prevents the development of hypertension, and improves renal function [15]. However, no study to date has rigorously examined the effects of PM to modulate insulin-dependent glucose metabolism in a model of defective insulin action.
α-Lipoic acid (ALA) is a nutriceutical compound that displays antioxidant properties [16] and, like PM, can reduce the formation of AGEs [17]. The positive metabolic actions of this antioxidant have been demonstrated in a variety of experimental models. The ALA can positively modulate glucose metabolism in both insulin-sensitive [18-20] and insulin-resistant [21-24] muscle tissues, with the R-(+)-enantiomer (R-ALA) displaying a greater effect than the S-enantiomer [19,23]. Furthermore, continuous in vivo treatment with R-ALA elicits improvements in whole-body glucose tolerance and insulin sensitivity as well as insulin action in skeletal muscle glucose transport of insulin-resistant obese Zucker rats [25,26]. The increased insulin action after R-ALA treatment in obese Zucker rats is associated with reductions of oxidative stress and dyslipidemia and with an enhancement of upstream insulin signaling in skeletal muscle [25,26].
It is currently unknown whether a combined PM and ALA treatment could facilitate a beneficial interaction to decrease markers of oxidative stress, ameliorate dyslipidemia, or enhance whole-body and skeletal muscle insulin action in a condition of oxidative stress and insulin resistance. In this context, the purpose of the present investigation was to assess the interactions of R-ALA and PM at individually maximally effective doses on whole-body glucose tolerance, insulin-stimulated glucose transport in skeletal muscle, markers of oxidative stress, and plasma and muscle lipids in the obese Zucker rat, a model of obesity-associated insulin resistance, dyslipidemia, and oxidative stress.
2. Materials and methods
2.1. Animals and treatments
Female lean Zucker (Fa/−) rats and female obese Zucker (fa/fa) rats were obtained at 5 to 6 weeks of age, and treatments began 1 week later. All animals were housed in a temperature-controlled room (20°−22°C) with a 12-hour/12-hour light/dark cycle at the Central Animal Facility of the University of Arizona. They were given free access to chow (4% fat mouse/rat diet; Teklad, Madison, WI) and water throughout the period of the study. All procedures were approved by the University of Arizona Animal Care and Use Committee.
Lean Zucker rats were used as vehicle-treated controls (LV group), whereas obese Zucker rats were randomly assigned to receive by intraperitoneal injections vehicle (100 mmol/L Tris buffer, pH 7.4) (OV group), PM HCl (60 mg/kg body weight; Calbiochem, La Jolla, CA) (OP group), the purified R-enantiomer of ALA (R-ALA, 92 mg/kg, trometamol salt; BASF, Ludwigshafen, Germany) (OR group), or PM and R-ALA in combination (OPR group) daily for 6 weeks. Body weights were obtained every other day to adjust each animal's treatment dose.
2.2. Assessment of glucose tolerance and plasma variables
At the end of the 6-week treatment period, animals were food-restricted overnight (chow was restricted to 4 g at 5:00 pm and was consumed immediately) and subjected to an oral glucose tolerance test (OGTT) using a 1-g/kg glucose feeding by gavage. Blood (∼0.25 mL) was collected from a cut at the end of the tail immediately before and at 15, 30, 60, and 120 minutes after glucose administration. Whole blood was then thoroughly vortexed with EDTA (18 mmol/L final concentration) and centrifuged at 13 000g for 30 seconds to isolate the plasma. The plasma was then removed and stored at −80°C until analysis. After the blood collection, animals were administered 2.5 mL of 0.9% saline solution subcutaneously to compensate for plasma loss during the OGTT.
Plasma was analyzed for glucose (Thermo Electron, Pittsburgh, PA), insulin (Linco Research, St Charles, MO), and free fatty acids (FFA) (Wako, Richmond, VA.). Fasting whole-body insulin sensitivity was estimated using the homeostasis model assessment of insulin resistance (HOMA-IR) by using the following formula: [fasting plasma glucose (in milligrams per deciliter) × fasting plasma insulin (in microunits per milliliter)]/405 [27].
2.3. Measurement of glucose transport activity
After the OGTT, treatment of the animals was continued for 3 additional days. After the third day, animals were again food-restricted overnight (4 g of chow at 5:00 pm). At 8:00 am, animals were deeply anesthetized with pentobarbitol sodium intraperitoneally (50 mg/kg Nembutal; Abbott Laboratories, North Chicago, IL). Tissues collected included plantaris muscle, soleus muscle, and liver. All tissues were immediately frozen between aluminum blocks cooled to the temperature of liquid nitrogen and stored at −80°C until analysis. Urine was also collected and stored at −80°C until analysis.
In addition, 2 strips (25−35 mg) from 1 soleus muscle were prepared for in vitro incubation in the unmounted state without tension (as previously described by Henriksen and Jacob [28]). Each soleus strip was incubated initially for 60 minutes at 37°C in 3 mL oxygenated (95% O2-5% CO2) Krebs-Henseleit buffer (KHB) supplemented with 8 mmol/L glucose, 32 mmol/L mannitol, and 0.1% bovine serum albumin (BSA) (radioimmunoassay grade; Sigma Chemical, St Louis, MO) in the absence or presence of a maximally effective concentration of insulin (5 mU/mL, Humulin R; Eli Lilly, Indianapolis, IN). Muscles were then transferred to flasks containing 3 mL of oxygenated KHB, 40 mmol/L of mannitol, 0.1% BSA, and insulin (if present in the previous step) to rinse the muscles of glucose for 10 minutes. After the rinse step, muscles were transferred to flasks containing 2 mL of oxygenated KHB, 0.1% BSA, 1 mmol/L 2-deoxy [1,2-[3H] glucose (2-DG) (300 μCi/mmol, Sigma), 39 mmol/L [U-14C] mannitol (0.8 μCi/mmol; ICN Radiochemicals, Irvine, CA), and insulin (if present in the previous step) and incubated for 20 minutes.
After the final incubation step, muscles were trimmed of fat, extraneous muscle, and connective tissue; frozen between aluminum blocks cooled to the temperature of liquid N2; weighed; and dissolved in 0.5 mL of 0.5 N NaOH. Five milliliters of scintillant was added, and the specific intracellular accumulation of 2-DG was determined as described previously [28]. This method for assessing glucose transport activity in isolated muscle has been validated [29].
2.4. Biochemical assays
Pieces (30−40 mg) of plantaris muscle and liver were used for the measurement of proteincarbonyl levels, a biomarker for tissue oxidant status, using the spectrophotometric assay of Reznick and Packer [30]. Triglyceride concentrations were determined in the plantaris muscle, soleus muscle, and liver tissue using the extraction method of Folch et al [31] and the processing method of Frayn and Maycock [32], as modified by Denton and Randle [33]. Pieces of tissue (30−40 mg) were homogenized in extraction buffer (20:10:3 mixture of chloroform-methanol-butylated hydroxytoluene) and incubated at 4°C for 16 hours. Separation of phases was obtained after addition of 0.9% saline, with centrifugation at 3000g for 60 minutes. The lower (organic) phase was evaporated to dryness under N2 gas at 60°C for 60 to 90 minutes. The sample was reconstituted in extraction buffer, and triglyceride concentration was determined spectrophotometrically using an enzymatic colorimetric assay (Sigma Chemical).
Conjugated fatty acid dienes were analyzed in the urine samples by reversed-phase high-performance liquid chromatography (HPLC)–diode array detection at a wavelength of 234 nm after lipid extraction according to Folch et al [31]. The HPLC separation was performed on an RP-18 (C-18 Nucleosil 120 nm, 5 μm; Macherey Nagel, Düren, Germany) stainless-steel column (4.6 × 250 nm, 1.0 mL/min) as part of an HPLC system (Bio-Tek Instruments, Eching, Germany) consisting of 2 pumps (type 422), a gradient mixer (M800), a Rheodyne injector (100-μL loop), and a diode array detector (diode array detector type 540+). The solvent gradient started with 100% aqueous trifluoroacetic acid (0.1% trifluoroacetic acid), followed by increasing amounts of acetonitrile (0.1% trifluoroacetic acid in acetonitrile) up to 80% within 30 minutes, finally reaching 100% within the ensuing 10 minutes. The amounts of conjugated pentadienes were calculated from the area under the curve, which was normalized for the content of total lipids analyzed by using a commercial kit (Randox, Krefeld, Germany).
2.5. Statistical analysis
All values are expressed as means ± SE. The significance between the obese vehicle-treated group and the respective obese groups treated with PM, R-ALA, or the combination of PM and R-ALA was assessed by 1-way analysis of variance with a post hoc Dunnett test using SPSS computer software (version 15.0; SPSS, Chicago, IL). The significance between the obese vehicle-treated group and lean vehicle-treated group was assessed by using an independent Student t test. A level of P less than .05 was set for statistical significance.
3. Results
3.1. Body and abdominal fat weights
The average initial body weights did not differ among the various obese Zucker groups, and the average final body weights of the obese groups treated individually with PM (OP group) or R-ALA (OR group) were also not different compared with those of the obese vehicle-treated group (OV) (Fig. 1A). However, the average final body weight of the obese animals treated with the combination of PM and R-ALA (OPR group) was approximately 38 g or 9% less (P < .05) compared with that of the OV group. Both the initial and final body weights of the vehicle-treated lean Zucker rats (LV group) were significantly less (P < .05) compared with those of the OV group.
Fig. 1.
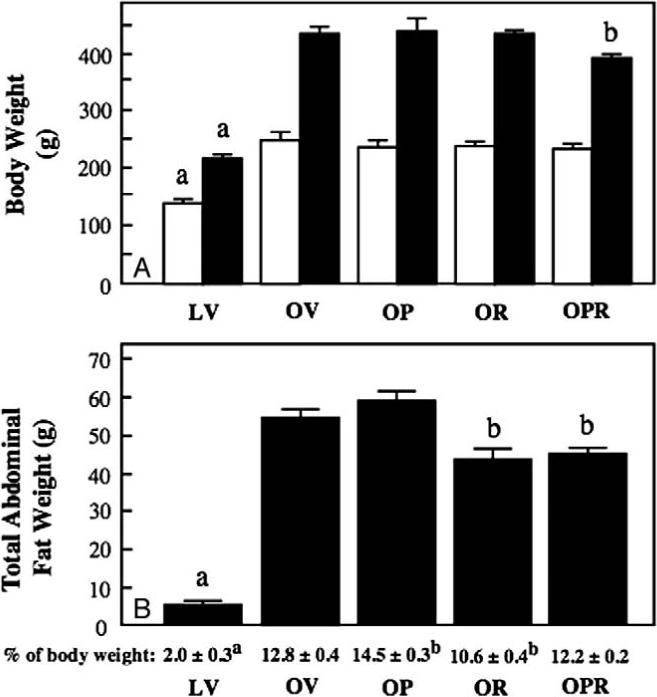
Effects of individual and combined treatments of obese Zucker rats with PM and R-ALA on body weight and total abdominal fat. A, Body weights assessed at the onset of treatment (open bars) and at the termination of the 6-week treatment period (filled bars). B, Total abdominal fat, both in absolute terms (filled bars) and as a percentage of the final body weight (text under the bars). Values are means ± SE for 6 to 7 animals per group. aP < .05, LV vs OV group; bP < .05, obese compound-treated group vs OV group.
Total abdominal fat was assessed at the end of the 6-week treatment period both in absolute terms and as a percentage of body weight (Fig. 1B). In absolute terms, at the end ofthe 6-week treatment period, total abdominal fat was 11 g or 20% less in the OR group and approximately 10 g or 16% less in the OPR group (both Ps < .05) compared with that in the OV group. As a percentage of total final body weight, total abdominal fat was actually increased (P <.05) in the OP group compared with the OV group, whereas this variable was less than the OV group only in the OR group. Total abdominal fat in the LV group, regardless of whether it was expressed in absolute terms or as a percentage of body weight, was substantially less (P < .05) than that in the OV group.
3.2. Biomarkers of oxidative stress
Protein carbonyls in skeletal muscle and conjugated dienes in urine were measured to evaluate the effectiveness of the interventions to reduce oxidative stress in tissue and systemically (Fig. 2). Compared with the OV group, protein carbonyls in plantaris muscle were reduced (P < .05) in the OP (35%), OR (41%), and OPR (40%) groups (Fig. 2A). Skeletal muscle protein carbonyls were substantially less (61%, P < .05) in the LV group compared with those in the OV group. Likewise, conjugated dienes in the urine of the obese animals were reduced (P < .05) by the treatments with PM (27%), R-ALA (22%), and PM combined with R-ALA (38%) compared with those in the control group (Fig. 2B). Urine-conjugated dienes were 15% less (P < .05) in the LV group compared with the OV group.
Fig. 2.

Effects of individual and combined treatments of obese Zucker rats with PM and R-ALA on markers of oxidative stress. Protein carbonyls were assessed in the plantaris muscle (A) and conjugated dienes were measured in the urine (B) at the termination of the 6-week treatment period. Values are means ± SE for 6 to 7 animals per group. aP <.05, LV vs OV group; bP <.05, obese compound-treated group vs OV group.
3.3. Fasting plasma glucose, insulin, and FFA
Fasting plasma values for glucose, insulin, and FFA are presented in Table 1. Compared with that in the OV group, fasting plasma glucose was not altered in the OP and OR groups, whereas this variable was significantly reduced (23%, P < .05) in the OPR group. Plasma glucose in the LV group tended to be somewhat less than that in the OV group, although this difference did not reach statistical significance. Similarly, fasting plasma insulin in the obese groups was significantly diminished compared with that in the OV group only in the obese animals that received the combination of PM and R-ALA (16%, P < .05). Fasting plasma FFA were reduced in the obese animals by the R-ALA intervention (14%, P < .05) and to the greatest extent by the combined PM/R-ALA treatments (24%, P < .05). Fasting plasma insulin and FFA were substantially less in the LV group compared with the OV group, reflecting the marked states of hyperinsulinemia and dyslipidemia in the obese Zucker rat.
Table 1.
Effects of PM and R-ALA treatments on fasting plasma variables in female obese Zucker rats.
| Group | Plasma glucose (mg/dL) | Plasma insulin (μU/mL) | Plasma FFA (mmol/L) | HOMA-IR (U) |
|---|---|---|---|---|
| Lean vehicle-treated | 116 ± 5 | 9 ± 1* | 0.76 ± 0.04* | 2.5 ± 0.1* |
| Obese vehicle-treated | 127 ± 5 | 154 ± 10 | 1.62 ± 0.07 | 48.3 ± 3.9 |
| Obese PM-treated | 127 ± 4 | 147 ± 8 | 1.51 ± 0.06 | 46.1 ± 3.0 |
| Obese R-ALA–treated | 123 ± 4 | 148 ± 3 | 1.39 ± 0.07† | 44.1 ± 1.4 |
| Obese PM + R-ALA–treated | 98 ± 3† | 130 ± 8† | 1.23 ± 0.04† | 31.2 ± 1.2† |
Values are means ± SE for 6 animals in the vehicle-treated groups and 7 animals in all other groups. HOMA-IR units are in milligrams per deciliter × microunits per milliliter.
P < .05, lean vehicle-treated group vs obese vehicle-treated group.
P < .05, obese compound-treated group vs obese vehicle-treated group.
The HOMA-IR value, which is inversely associated with whole-body insulin sensitivity in the fasting state [27], was significantly reduced (35%, P < .05) only in the OPR group compared with the OV group (Table 1), indicating that continuous treatment with the combination of PM and R-ALA enhanced fasting whole-body insulin sensitivity. The HOMA-IR in the LV group was only approximately 5% of the value in the OV group, reflecting the enormous difference in fasting insulin sensitivity between the lean and obese Zucker rats.
3.4. Glucose tolerance and insulin sensitivity
The glucose and insulin responses during the oral glucose tolerance test for the various groups are shown in Fig. 3. Compared with that in the OV group, the glucose value for the OP group was reduced (P < .05) only at the 30-minute time point (14%) (Fig. 3A). In contrast, for the OR group, glucose was diminished relative to the OV group at the 15-minute (17%), 30-minute (18%), and 60-minute (20%) time points. The greatest reduction in the glucose response relative to the OV group was demonstrated in the OPR group, with values being 29%, 27%, 30%, and 30% less at the 15-, 30-, 60-, and 120-minute time points, respectively. The glucose response in the LV group was reduced compared with that in the OV group at the 30-minute (15%), 60-minute (16%), and 120-minute (20%) time points. The total integrated area under the curve for glucose (AUCg) was reduced, compared with the OV group, in the OR group (17%), with the greatest reduction for AUCg induced in the OPR group (29%) (Fig. 3C). The AUCg in the LV group was 15% less than that in the OV group.
Fig. 3.

Effects of individual and combined treatments of obese Zucker rats with PM and R-ALA on glucose tolerance and whole-body insulin sensitivity. Responses of glucose (A) and insulin (B) to an oral glucose load were assessed after the 6-week treatment period. Integrated AUCs for glucose (C) and insulin (D) were derived from these responses. The glucose-insulin index (E) was calculated as the product of the glucose AUC and the insulin AUC. Error bars for the glucose and insulin responses are obscured by the symbols. Values are means ± SE for 6 to 7 animals per group. aP < .05, LV vs OV group; bP < .05, obese compound-treated group vs OV group.
The insulin responses during the oral glucose tolerance test were likewise significantly (P < .05) impacted by the interventions (Fig. 3B). In the OP group, compared with the OV group, insulin was reduced by 21% at the 30-minute time point. The R-ALA treatment caused a diminution of insulin values at the 15-minute (22%) and 30-minute (18%) time points compared with those in the OV group. The largest decrease in the insulin values relative to the OV group was shown in the OPR group, with the respective values being 31%, 28%, 24%, and 17% less at the 15-, 30-, 60-, and 120-minute time points. The insulin values in the LV group were markedly less than those in the OV group at all time points. The AUC for insulin (AUCi) was significantly reduced, compared with the OV group, in the OP group (18%) and in the OPR group (25%) (Fig. 3D).
The glucose-insulin index is defined as the product of the AUCg and the AUCi and is inversely related to whole-body insulin sensitivity under a glucose load [34]. Responses of the glucose-insulin index to the PM and R-ALA interventions are presented in Fig. 3E. Compared with the OV group, the glucose-insulin index was reduced (P < .05) by 27% in the OR group and to the greatest extent (47%) in the OPR group, indicating that these interventions significantly enhance whole-body insulin sensitivity, with the most marked effect elicited by the combination of PM and R-ALA in the obese rats. This parameter in the LV group was only 6% of the value in the OV group, consistent with the much greater insulin sensitivity in the lean Zucker rat compared with the obese Zucker rat.
3.5. Muscle glucose transport activity
Basal in vitro glucose transport in the soleus muscle of the various obese groups treated with PM or R-ALA, alone or in combination, was not altered relative to that of the OV group (Fig. 4). In the OP group, there was a small, nonsignificant reduction in the rate of insulin-stimulated 2-DG uptake (5%) and in the increase in 2-DG uptake above basal due to insulin (11%). In contrast, R-ALA induced an enhancement (P < .05) of insulin-dependent 2-DG uptake, whether expressed as the rate of 2-DG uptake in the presence of insulin (17%) or as the increase in 2-DG uptake above basal due to insulin (44%). The increases in these variables relative to the OP group were maintained in the obese group that received both PM and R-ALA (16% and 44%). Both basal and insulin-dependent 2-DG uptakes were markedly greater in the LV group compared with the OV group.
Fig. 4.

Effects of individual and combined treatments of obese Zucker rats with PM and R-ALA on glucose transport activity in soleus muscle. The 2-DG uptake in isolated soleus strips was measured in the absence of insulin (open bars) and in the presence of 5 mU/mL insulin (crosshatched bars). The increase in 2-DG uptake above basal due to insulin (filled bars) is also presented. Values are means ± SE for 6 to 7 animals per group. aP < .05, LV vs OV group; bP < .05, obese compound-treated group vs OV group.
3.6. Tissue triglyceride concentrations
The treatment with PM did not significantly alter the triglyceride concentration in the soleus (Fig. 5A) or the plantaris (Fig. 5B). In contrast, compared with that in the OV group, liver triglyceride in the OP group was significantly reduced (37%, P < .05). The R-ALA intervention caused a reduction in triglyceride concentration in the soleus (31%), plantaris (37%), and liver (23%), as did the combination of PM and R-ALA in all 3 tissues investigated (49%, 44%, and 31%, respectively). Triglycerides in the LV group were markedly lower than those in the OV groups in the soleus (72%) and liver (74%), whereas this difference in the plantaris (27%) did not reach statistical significance.
Fig. 5.

Effects of individual and combined treatments of obese Zucker rats with PM and R-ALA on triglyceride levels in skeletal muscle and liver. At the end of the 6-week treatment period, triglyceride concentrations were determined in soleus and plantaris muscles and in liver. Values are means ± SE for 6 to 7 animals per group. aP < .05, LV vs OV group; bP < .05, obese compound-treated group vs OV group.
4. Discussion
The most critical aspect of the present investigation is the identification of a novel interaction between the AGE inhibitor PM and the antioxidant R-ALA in a well-accepted rodent model of obesity-associated insulin resistance, the obese Zucker rat. The individual effects of continuous R-ALA administration to the obese Zucker rat were consistent with our previous studies and include reductions in plasma FFA [25,35], improvements in glucose tolerance [25,35], whole-body insulin sensitivity [25,35], insulin-dependent skeletal muscle glucose transport activity [23,25,26,35], and diminution of skeletal muscle triglyceride concentrations [26,35]. The combination of the PM and R-ALA treatments resulted in substantial reductions, compared with those of the obese vehicle-treated group, of the oxidative stress biomarkers, both systemically (urine-conjugated dienes) and locally (skeletal muscle protein carbonyls). However, this combination of PM and R-ALA did elicit the only significant amelioration of body weight gain; reversed the PM-induced increase in abdominal fat; caused the greatest reductions in fasting plasma glucose, insulin, and FFA; and brought about the only increase in fasting insulin sensitivity. Moreover, the PM/R-ALA combination resulted in the greatest improvement in glucose tolerance and whole-body insulin sensitivity during the glucose tolerance test. Finally, the combination of PM and R-ALA maintained the significant increase in insulin-mediated skeletal muscle glucose transport activity seen with the individual R-ALA treatment, despite the slight negative effect of PM alone on this parameter. A similar effect of the combination treatment to maintain the beneficial action of R-ALA was also seen for muscle and liver triglycerides.
The limited data set in the present investigation does allow for a possible explanation for this novel interaction between PM and R-ALA in improving whole-body glucose tolerance and insulin sensitivity in the obese Zucker rat. Oxidative stress has been shown to be one of several elements that can contribute to the multifactorial etiology of insulin resistance [1-3]. Both PM and R-ALA can impact the degree of oxidative stress in an organism by acting, directly or indirectly, as free radical scavengers [16] or by preventing molecular interactions that lead to the development of AGE and free radical production [36]. Both PM and R-ALA did reduce markers of oxidative stress, and these effects could explain some of the beneficial actions of these compounds on glucose tolerance and insulin sensitivity. However, mechanisms are possible for this interaction of PM and R-ALA that are independent of alterations in local and systemic oxidative stress. For example, R-ALA has the additional effect, not shared by PM, of reducing plasma FFA, which can negatively impact insulin action in tissues by activating novel protein kinase C isoforms and impairing insulin receptor substrate 1–dependent insulin signaling [37]. The greatest reduction in plasma FFA was clearly facilitated in the obese animals treated with the combination of PM and R-ALA; and this modulation of the dyslipidemic environment could explain, in part, the novel interaction between PM and R-ALA. It is clear, however, that other possible explanations exist and may require the collection of additional data.
This study also represents the first investigation of the metabolic consequences of the continuous administration of the AGE inhibitor PM in the prediabetic, insulin-resistant, obese Zucker rat. With regard to PM action alone, we have demonstrated that the continuous treatment of obese Zucker rats with this AGE inhibitor successfully reduced markers of oxidative stress. However, this decrease in oxidative stress appeared to be uncoupled from the regulation of most metabolic processes assessed. Although the PM treatments alone did induce a significant decrease in the insulin response to a glucose load and a diminution of liver triglyceride storage, it also caused a significant increase in abdominal fat (as a percentage of body weight) and elicited no increases in insulin action on skeletal muscle glucose transport activity. The increase in visceral fat associated with the PM treatment may help explain the limited usefulness of PM alone to facilitate increases in insulin action at the systemic level.
Previous investigations have provided the PM in the drinking water [14,15], and the dose of PM administered in the present study (60 mg/kg body weight) corresponds to that provided orally in the study of Alderson et al [15]. These previous studies have demonstrated the utility of PM in mitigating the development of diabetic complications, showing that continuous PM administration can successfully inhibit the development of retinal microvascular lesions in the streptozotocin-diabetic rat (a model of type 1 diabetes mellitus) [14] and can reduce the onset of the dyslipidemia, impaired renal function, hypertension, and vascular abnormalities in the heart and kidney associated with the prediabetic obese Zucker rat [15]. In the latter study, PM did not affect plasma glucose or hemoglobin A1C level, an index of long-term glycemic control [15], similar to the results of the present investigation. Although in vitro investigations using 3T3-L1 adipocytes have demonstrated a relationship between AGE and insulin resistance [38] and have elicited improvements in in vitro glucose transport activity with PM treatment [39], the present results from PM-treated obese Zucker rats do not support the utility of PM alone as an intervention for ameliorating skeletal muscle insulin resistance.
In conclusion, although the individual treatment of the prediabetic, insulin-resistant, obese Zucker rat with the AGE inhibitor PM did reduce markers of oxidative stress, it provided limited beneficial effects on metabolic regulation. The individual treatment of these prediabetic animals with the antioxidant R-ALA also reduced oxidative stress and did elicit significant improvements in glucose tolerance, insulin sensitivity, and dyslipidemia. Most importantly, this study documents the novel interactions between PM and R-ALA in the context of a combination treatment regimen provided to the obese Zucker rats, resulting in the greatest decreases in fasting plasma glucose, insulin, and FFA and causing the largest improvements in glucose tolerance and insulin sensitivity. Furthermore, the combination of PM and R-ALA maintained the R-ALA–induced enhancement of insulin-mediated glucose transport activity in skeletal muscle in the face of a slight negative effect of PM on this variable. Overall, combining the AGE inhibitor PM with the antioxidant R-ALA can be beneficial for providing substantial improvements in glucose tolerance and insulin sensitivity in obesity-associated insulin resistance. Future investigations should be undertaken to elucidate the underlying molecular mechanisms for these novel interactions and to gain a better understanding of the underlying mechanisms responsible for these interactions affecting insulin sensitivity of peripheral tissues in the insulin-resistant obese Zucker rat.
Acknowledgment
This work was supported by grants from BASF, Ludwigshafen, Germany, to EJH and VS.
Footnotes
Publisher's Disclaimer: This article appeared in a journal published by Elsevier. The attached copy is furnished to the author for internal non-commercial research and education use, including for instruction at the authors institution and sharing with colleagues. Other uses, including reproduction and distribution, or selling or licensing copies, or posting to personal, institutional or third party websites are prohibited. In most cases authors are permitted to post their version of the article (e.g. in Word or Tex form) to their personal website or institutional repository. Authors requiring further information regarding Elsevier's archiving and manuscript policies are encouraged to visit: http://www.elsevier.com/copyright
References
- 1.Henriksen EJ. Oxidative stress and antioxidant treatment: effects on muscle glucose transport in animal models of type 1 and type 2 diabetes. In: Packer LP, Rösen P, Tritschler HJ, King GL, Azzi A, editors. Antioxidants in diabetes management. Marcel Dekker; New York (NY): 2000. pp. 303–18. [Google Scholar]
- 2.Henriksen EJ. Exercise training and the antioxidant alpha-lipoic acid in the treatment of insulin resistance and type 2 diabetes. Free Rad Biol Med. 2006;40:3–12. doi: 10.1016/j.freeradbiomed.2005.04.002. [DOI] [PubMed] [Google Scholar]
- 3.Henriksen EJ. Effects of conjugated linoleic acid and lipoic acid on insulin action in the obese Zucker rat. In: Packer L, Obermueller-Jevic U, Sies H, editors. Oxidative stress and inflammatory mechanisms in obesity, diabetes, and the metabolic syndrome. CRC Press; Boca Raton (Fla): 2007. pp. 289–99. [Google Scholar]
- 4.Dokken BB, Saengsirisuwan V, Kim JS, Teachey MK, Henriksen EJ. Role of glycogen synthase kinase-3 in oxidative stress—induced insulin resistance in skeletal muscle. Am J Physiol Endocrinol Metab. 2008;294:E615–21. doi: 10.1152/ajpendo.00578.2007. [DOI] [PubMed] [Google Scholar]
- 5.Reaven GM. Role of insulin resistance in human disease. Diabetes. 1988;37:1595–607. doi: 10.2337/diab.37.12.1595. [DOI] [PubMed] [Google Scholar]
- 6.Reaven GM. Role of insulin resistance in human disease (syndrome X): an expanded definition. Annu Rev Med. 1993;44:121–31. doi: 10.1146/annurev.me.44.020193.001005. [DOI] [PubMed] [Google Scholar]
- 7.DeFronzo RA, Ferrannini E. Insulin resistance. A multifaceted syndrome responsible for NIDDM, obesity, hypertension, dyslipidemia, and atherosclerotic cardiovascular disease. Diabetes Care. 1991;14:173–94. doi: 10.2337/diacare.14.3.173. [DOI] [PubMed] [Google Scholar]
- 8.Hayden MR, Stump CS, Sowers JR. Introduction: organ involvement in the cardiometabolic syndrome. J Cardiometab Syndr. 2006;1:16–24. doi: 10.1111/j.0197-3118.2006.05454.x. [DOI] [PubMed] [Google Scholar]
- 9.Thorpe SR, Baynes JW. Role of the Maillard reaction in diabetes mellitus and diseases of aging. Drugs Ageing. 1996;9:69–77. doi: 10.2165/00002512-199609020-00001. [DOI] [PubMed] [Google Scholar]
- 10.Ulrich P, Cerami A. Protein glycation, diabetes, and aging. Recent Prog Horm Res. 2001;56:1–21. doi: 10.1210/rp.56.1.1. [DOI] [PubMed] [Google Scholar]
- 11.Metz TO, Alderson NL, Chachich ME, Thorpe SR, Baynes JW. Pyridoxamine traps intermediates in lipid peroxidation reactions in vivo. Evidence on the role of lipids in chemical modification of proteins and development of diabetic complications. J Biol Chem. 2003;278:42012–9. doi: 10.1074/jbc.M304292200. [DOI] [PubMed] [Google Scholar]
- 12.Metz TO, Alderson NL, Thorpe SR, Baynes JW. Pyridoxamine, an inhibitor of advanced glycation and lipoxidation reactions: a novel therapy for treatment of diabetic complications. Arch Biochem Biophys. 2003;419:41–9. doi: 10.1016/j.abb.2003.08.021. [DOI] [PubMed] [Google Scholar]
- 13.Degenhardt TP, Alderson NL, Arrington DD, et al. Pyridoxamine inhibits early renal disease and dyslipidemia in the streptozotocin-diabetic rat. Kidney Int. 2002;61:939–50. doi: 10.1046/j.1523-1755.2002.00207.x. [DOI] [PubMed] [Google Scholar]
- 14.Stitt A, Gardiner TA, Alderson NL, et al. The AGE inhibitor pyridoxamine inhibits development of retinopathy in experimental diabetes. Diabetes. 2002;51:2826–32. doi: 10.2337/diabetes.51.9.2826. [DOI] [PubMed] [Google Scholar]
- 15.Alderson NL, Chachich ME, Youssef NN, et al. The AGE inhibitor pyridoxamine inhibits lipemia and development of renal and vascular disease in Zucker obese rats. Kidney Int. 2003;63:2123–33. doi: 10.1046/j.1523-1755.2003.00027.x. [DOI] [PubMed] [Google Scholar]
- 16.Packer L, Witt EH, Tritschler HJ. a-Lipoic acid as a biological antioxidant. Free Rad Biol Med. 1995;19:227–50. doi: 10.1016/0891-5849(95)00017-r. [DOI] [PubMed] [Google Scholar]
- 17.Midaoui AE, Elimadi A, Wu L, et al. Lipoic acid prevents hypertension, hyperglycemia, and the increase in heart mitochondrial superoxide production. Am J Hypertens. 2003;16:173–9. doi: 10.1016/s0895-7061(02)03253-3. [DOI] [PubMed] [Google Scholar]
- 18.Haugaard N, Haugaard ES. Stimulation of glucose utilization by thioctic acid in rat diaphragm incubated in vitro. Biochim Biophys Acta. 1970;222:583–6. doi: 10.1016/0304-4165(70)90183-2. [DOI] [PubMed] [Google Scholar]
- 19.Estrada DE, Ewart ES, Tsakiridis T, et al. Stimulation of glucose uptake by the natural coenzyme a-lipoic acid/thioctic acid: participation of elements of the insulin signaling pathway. Diabetes. 1996;45:1798–804. doi: 10.2337/diab.45.12.1798. [DOI] [PubMed] [Google Scholar]
- 20.Henriksen EJ, Jacob S, Streeper RS, Fogt DL, Hokama JY, Tritschler HJ. Stimulation by a-lipoic acid of glucose transport activity in skeletal muscle of lean and obese Zucker rats. Life Sci. 1997;61:805–12. doi: 10.1016/s0024-3205(97)00562-6. [DOI] [PubMed] [Google Scholar]
- 21.Jacob S, Streeper RS, Fogt DL, et al. The antioxidant alpha-lipoic acid enhances insulin stimulated glucose metabolism in insulin-resistant rat skeletal muscle. Diabetes. 1996;45:1024–9. doi: 10.2337/diab.45.8.1024. [DOI] [PubMed] [Google Scholar]
- 22.Khamaisi M, Potashnik R, Tirosh A, et al. Lipoic acid reduces glycemia and increases muscle GLUT4 content in streptozotocin-diabetic rats. Metabolism. 1997;46:763–8. doi: 10.1016/s0026-0495(97)90120-7. [DOI] [PubMed] [Google Scholar]
- 23.Streeper RS, Henriksen EJ, Jacob S, Hokama JY, Fogt DL, Tritschler HJ. Differential effects of lipoic acid stereoisomers on glucose metabolism in insulin-resistant skeletal muscle. Am J Physiol Endocrinol Metab. 1997;273:E185–91. doi: 10.1152/ajpendo.1997.273.1.E185. [DOI] [PubMed] [Google Scholar]
- 24.El Midaoui A, de Champlain J. Prevention of hypertension, insulin resistance, and oxidative stress by alpha-lipoic acid. Hypertension. 2002;39:303–7. doi: 10.1161/hy0202.104345. [DOI] [PubMed] [Google Scholar]
- 25.Saengsirisuwan V, Kinnick TR, Schmit MB, Henriksen EJ. Interactions of exercise training and lipoic acid on skeletal muscle glucose transport in obese Zucker rats. J Appl Physiol. 2001;91:145–53. doi: 10.1152/jappl.2001.91.1.145. [DOI] [PubMed] [Google Scholar]
- 26.Saengsirisuwan V, Perez FR, Sloniger JA, Maier T, Henriksen EJ. Interactions of exercise training and R-(+)-alpha-lipoic acid on insulin signaling in skeletal muscle of obese Zucker rats. Am J Physiol Endocrinol Metab. 2004;287:E529–36. doi: 10.1152/ajpendo.00013.2004. [DOI] [PubMed] [Google Scholar]
- 27.Matthews DR, Hosker JP, Rudenski AS, Naylor BA, Treacher DF, Turner RC. Homeostasis model assessment: insulin resistance and beta-cell function from fasting plasma glucose and insulin concentrations in man. Diabetologia. 1985;28:412–9. doi: 10.1007/BF00280883. [DOI] [PubMed] [Google Scholar]
- 28.Henriksen EJ, Jacob S. Effects of captopril on glucose transport activity in skeletal muscle of obese Zucker rats. Metabolism. 1995;44:267–72. doi: 10.1016/0026-0495(95)90276-7. [DOI] [PubMed] [Google Scholar]
- 29.Hansen PA, Gulve ES, Holloszy JO. Suitability of 2-deoxyglucose for in vitro measurement of glucose transport activity in skeletal muscle. J Appl Physiol. 1994;76:979–85. doi: 10.1152/jappl.1994.76.2.979. [DOI] [PubMed] [Google Scholar]
- 30.Reznick AZ, Packer L. Oxidative damage to proteins: spectrophotometric method for carbonyl assay. Methods Enzymol. 1994;233:357–63. doi: 10.1016/s0076-6879(94)33041-7. [DOI] [PubMed] [Google Scholar]
- 31.Folch J, Lees M, Sloane Stanley JH. A simple method for the isolation and purification of total lipids from animal tissues. J Biol Chem. 1957;226:497–509. [PubMed] [Google Scholar]
- 32.Frayn KN, Maycock PF. Skeletal muscle triacylglycerol in the rat: methods for sampling and measurement, and studies of biological variability. J Lip Res. 1980;21:139–44. [PubMed] [Google Scholar]
- 33.Denton RM, Randle PJ. Concentration of glycerides and phospholipids in rat heart and gastrocnemius muscles: effects of alloxan-diabetes and perfusion. Biochem J. 1967;104:416–22. doi: 10.1042/bj1040416. [DOI] [PMC free article] [PubMed] [Google Scholar]
- 34.Cortez MY, Torgan CE, Brozinick JT, Ivy JL. Insulin resistance of obese Zucker rats exercise trained at two different intensities. Am J Physiol Endocrinol Metab. 1991;261:E613–9. doi: 10.1152/ajpendo.1991.261.5.E613. [DOI] [PubMed] [Google Scholar]
- 35.Teachey MK, Taylor ZC, Maier T, et al. Interactions of conjugated linoleic acid and alpha-lipoic acid on insulin action in the obese Zucker rat. Metabolism. 2003;52:1167–74. doi: 10.1016/s0026-0495(03)00145-8. [DOI] [PubMed] [Google Scholar]
- 36.Voziyan PA, Hudson BG. Review: pyridoxamine is a multifunctional pharmaceutical: targeting pathogenic glycation and oxidative damage. Cell Molec Life Sci. 2005;62:1671–81. doi: 10.1007/s00018-005-5082-7. [DOI] [PMC free article] [PubMed] [Google Scholar]
- 37.Yu C, Chen Y, Cline GW, et al. Mechanism by which fatty acids inhibit insulin activation of insulin receptor substrate 1 (IRS-1)—associated phosphatidylinositol 3-kinase activity in muscle. J Biol Chem. 2002;277:50230–6. doi: 10.1074/jbc.M200958200. [DOI] [PubMed] [Google Scholar]
- 38.Unoki H, Bujo H, Yamagishi S, Takeuchi M, Imaizumi T, Saito Y. Advanced glycation end products attenuate cellular insulin sensitivity by increasing the generation of intracellular reactive oxygen species in adipocytes. Diabetes Res Clin Pract. 2007;76:236–44. doi: 10.1016/j.diabres.2006.09.016. [DOI] [PubMed] [Google Scholar]
- 39.Unoki H, Bujo H, Yamagishi SI, et al. Possible participation of advanced glycation end products in the pathogenesis of obesity-associated insulin resistance. Diabetes. 2005;54(Suppl 1):A431. [Google Scholar]