Abstract
Previous experiments with mice have shown that repeated 1 hour daily exposure to an ambient magnetic field-shielded environment induces analgesia (antinociception). The exposures were carried out in the dark (less than 2.0×10¹⁶ photons s−1 m−2) during the mid-light phase of the diurnal cycle. However, if the mice were exposed in the presence of visible light (2.0×10¹⁸ photons s−1 m−2, 400–750 nm), then the analgesic effects of shielding were eliminated. Here, we show that this effect of light is intensity and wavelength dependent. Introduction of red light (peak at 635 nm) had little or no effect, presumably because mice do not have photoreceptors sensitive to red light above 600 nm in their eyes. By contrast, introduction of ultraviolet light (peak at 405 nm) abolished the effect, presumably because mice do have ultraviolet A receptors. Blue light exposures (peak at 465 nm) of different intensities demonstrate that the effect has an intensity threshold of approximately 12% of the blue light in the housing facility, corresponding to 5×10¹⁶ photons s−1 m−2 (integral). This intensity is similar to that associated with photoreceptor-based magnetoreception in birds and in mice stimulates photopic/cone vision. Could the detection mechanism that senses ambient magnetic fields in mice be similar to that in bird navigation?
Keywords: Earth's magnetic field, visible light, ultraviolet light, nociception, analgesia, ambient magnetic field shielding
1. Introduction
We have shown that 1 hour daily exposures to an ambient magnetic field-shielded environment produce an analgesic effect that peaks on the fifth day (Prato et al. 2005). This effect is naloxone reversible, and hence probably an opioid-mediated effect. As the initial exposures to the shielded environment were in the dark but during the mid-light phase of the diurnal cycle, we reintroduced white light into the shielded environment and the analgesic effect was eliminated. We have shown (Prato et al. 2000), as have others (Betancur et al. 1994), that light modulates the effects of the applied magnetic fields on the attenuation of opioid/opiate-induced analgesia in snails and mice. In all these experiments, the applied magnetic fields were either static or time changing (generally less than 300 Hz) and considerably greater than the ambient magnetic fields. Furthermore, it is known that geomagnetic field detectors in migratory birds (Wiltschko & Wiltschko 2006) and newts (Phillips et al. 2001) are dependent on light intensity and wavelength. Thalau et al. (2006) have presented data suggesting that ‘magnetic compass mechanisms of birds and rodents are based on different physical principles’, but in fact, the experiments were all performed on mole rats for which there is evidence that their visual system may be quite different from most rodents (Němec et al. 2004; Peichl et al. 2004). Hence, their work cannot be extrapolated directly to mice with full rod and cone vision (Jacobs et al. 2004; Umino et al. 2008). Interestingly, Muheim et al. (2006) have shown that mice can use a geomagnetic field as the sole method of finding their nest; however, it is still unclear whether the response is light dependent. Given these reports, we decided to investigate whether light intensity and wavelength can also affect the induction of analgesia by repeated ambient magnetic field (geomagnetic) shielding exposures.
We have shown that induction of analgesia (i) is reduced by white light exposure in an intensity-dependent fashion, (ii) may not be affected by red light, (iii) is modestly affected by green and yellow lights, (iv) is eliminated by ultraviolet light, and (v) is eliminated in a threshold fashion by blue light.
2. Material and methods
2.1 Animals
Adult male Swiss CD-1 mice (Charles River, Canada), two to four months old and weighing 25–35 g were used. Mice were housed individually in polyethylene cages under a 12 L : 12 D cycle at 21±2°C. Food and water were freely available. The animals were housed, and all experiments were conducted, according to the Canadian guidelines for laboratory animal care.
2.2 Assessment of nociception
Nociception (pain sensitivity) was measured as the latency of a foot lifting/lick to an aversive thermal stimulus (hot plate test; model HP AccuScan Instruments, Inc., Columbus, OH) at 50±0.5°C. The maximum individual latency observed was 45 s; hence, all mice were removed from the heated surface before the cut-off time of 60 s.
2.3 Magnetic exposure conditions
Extremely low-frequency magnetic fields inside the mu-metal box (0.20–0.35 μT static, less than 0.001 μT 60 Hz) were attenuated approximately 100 times (Choleris et al. 2002) in comparison with ambient fields and those inside the sham box (53 μT static, 0.15 μT 60 Hz). Magnetic fields were measured by a three-dimensional fluxgate magnetometer (MAG-03MS 1000; Bartington Instruments Ltd, Oxford, UK). The mu-metal box is identical to the one described by Koziak et al. (2006). The box (33×38×20 cm) was made of 1 mm thick mu-metal (Magnetic Shield Corp., Bensenville, IL), and it had magnetically shielded holes (diameter of 2.5 cm) at each of the four corners (1 cm off the sides) of both the base and top surfaces. A mu-metal cylinder (2.5 cm high) surrounded each hole, shielding the ambient magnetic field and light. The mu-metal box was laminated inside with black opaque polyethylene as it is impervious to virtually all solvents. Individual mice were placed in a 26×16×12 cm clean transparent polyethylene cage and covered by a clear polycarbonate (Lexan) top with ventilation holes (diameter of 8 mm). This cage was inserted into the mu-metal box. Sham boxes were constructed of opaque fibreglass material, identical to the dimensions of the mu-metal boxes. These sham boxes had no effect on the ambient magnetic field and were also lined with opaque polyethylene.
2.4 Light–dark procedures
Light levels were measured by a spectrophotometer (LightSpex; McMahan Research Laboratories, Chapel Hill, NC). Dark conditions were created through the use of normal exposure boxes (mu-metal and sham) where light levels were below the sensitivity of the spectrophotometer and certainly below 2.0×10¹⁶ photons s−1 m−2. One sham box and one mu-metal box were used for testing under dark conditions.
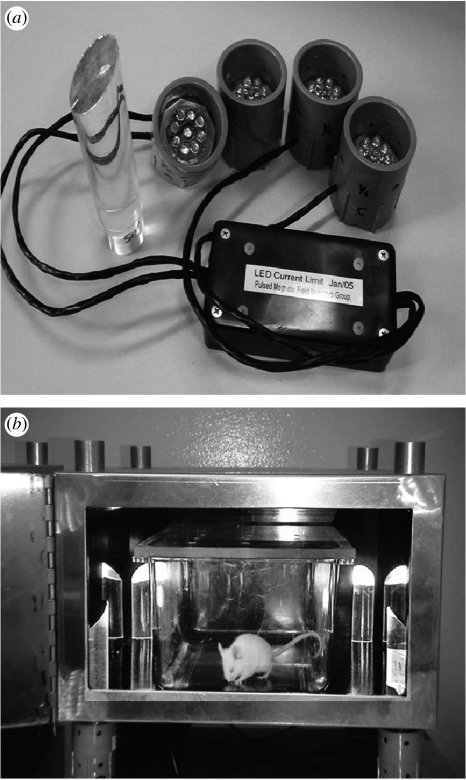
The light condition was created by four clusters of light emitting diodes (LEDs). As shown by Koziak et al. (2006), one of these clusters was placed on each of the metal cylinders on the bottom of the boxes. Each LED cluster contained nine LEDs arranged in a circular pattern mounted inside a 2.75 cm diameter irrigation ‘plug’, which was 2.5 cm high (figure 1a). In order to more securely fix the clusters to each corner, metal clips were used to create a tighter frictional fit. Figure 1b shows a mu-metal box and the location of the LEDs.
Figure 1.
(a) Top view of LED foot with array of nine LEDs. (b) LED feet placed on bottom cylinders of mu-metal box. A mouse ambulates in its polyethylene cage with the cage in the mu-metal box. The door of the box is open in the photograph, but is shut during the 1 hour of magnetic field shielding.
The LED clusters created a beam of light into the exposure box and created minimal temperature changes (less than 1°C) within the box. The four beams of light were guided into the light boxes via four light pipes, which are also shown in figure 1a,b. The light pipes are made from 25.4 mm clear acrylic rod cut at 45° to 111 mm total length. The base is reduced to 23.4 mm diameter and 22 mm long to fit the port in the enclosure. Both ends are polished and the upper angled edge acts as a reflector into the centre of the enclosure. The light intensity levels were measured with the LightSpex spectrophotometer plus a fixture to hold the emitter LED array at a constant distance of 25.4 mm from the cosine receptor. Light was measured again inside the boxes using the cosine receptor and fibre-optic probe. Two readings were taken at the centre of the enclosure, one facing the back and the other facing the corner, both 25 mm above the floor of the box. For some of the lower intensity exposures that were used to determine blue light threshold levels, measurements approached the limit of the spectrophotometer. Therefore, a ratio was calculated from the average intensity directly at the LED array to the light intensity inside the enclosure. This ratio was then used as a constant to calibrate light input for other lower intensity levels. Readings were taken in irradiance (μW cm−2 nm−1) and then converted to photons s−1 m−2 calculating both peak and integral values. Note that even at the lowest blue light intensity (2.6×10¹⁶ photons s−1 m−2 integral), the light in the interior of the boxes was perceived as blue by a human observer.
The LEDs were powered with a DC source. The three-dimensional fluxgate magnetometer was used to measure any production of magnetic fields from the LEDs or their power source. The magnetometer was placed as close as the mice could possibly get to the source. At the most, turning on the LEDs increased the static magnetic field in the box by 1 nT. As expected, there was no AC contributor to the magnetic fields that could be detected.
2.5 Experimental procedures
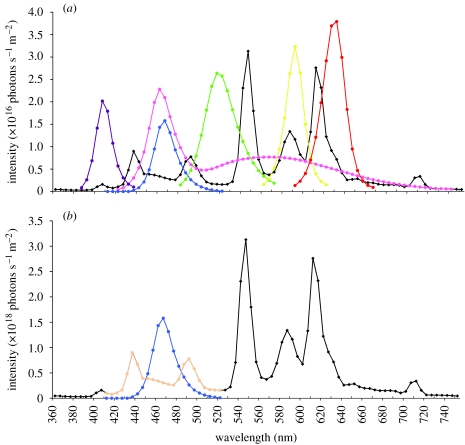
Experiments were conducted in London, Ontario, Canada (43°02′ N, 81°09′ W). Table 1 outlines the details of the six experiments that were performed on a total of 838 CD-1 mice (Charles River, Canada). Experiments 1b and 6b involved 10 consecutive days in which each mouse was exposed and tested. All other experiments were run for only 5 days. In each experiment, exposure order between experiments was randomized. One of us (D.D.H.), naive of any anticipated outcome, conducted all the measurements, but did not analyse the data. One of us (A.W.T.) analysed all the data. Animals were used in only one experiment and exposed to only one condition and were then killed. Details of the LEDs used are given in table 2. White, yellow, green, blue and ultraviolet A (UVA) LEDs were obtained from superbrightleds.com, St Louis, MO 63031, USA (tel.: 314-972-6200, fax: 314-972-6202). Red LEDs were obtained from HB Electronics Components, Hebei I. T. (Shanghai) Co. Ltd, no. 1 JiLong Road, Waigaoqiao, Shanghai, China (tel.: 0086/21/58526062, 0086/21/58525392, fax: 0086/21/58523251, USA: 801-938-6488). As shown in table 1, the light intensity of the white light in the box produced by the LEDs was scaled to be 100, 66 and 33% of the average light in the animal housing room when the light intensity was integrated from 420 to 740 nm (figure 2a). For all other coloured exposures, light intensities of the colour were scaled compared with the animal housing room light within the same range of wavelengths. Values given in table 1 and figure 2b demonstrate how these values of intensity were calculated, with blue light as an example. As there was no UVA in the animal facility lighting, the UVA irradiance in photons s−1 m−2 was normalized to the blue light irradiance. A comparison for all the colours is shown in figure 2a.
Table 1.
List of conducted experiments and the associated light exposure conditions. (UVA light level was set to match the same number of integral photons s−1 m−2 as was used in the blue light spectrum as there was very little UVA light present in the animal facility to obtain useful measurements. The labelling code used in the ‘description’ column is as follows. Mu or S (light colour, intensity, no. of days in experiment): Mu, mu-metal box; S, sham box; W, white light; G, green light; Y, yellow light; R, red light; B, blue light; UVA, ultraviolet A light; D, dark; Ø, no light.)
| exp no. (figure no.) | description | animals | wavelength (nm) | intensity (photons s−1 m−2) | % ambient | |||
|---|---|---|---|---|---|---|---|---|
| peak | FWHM | integral | peak | integral | ||||
| exp 1a (figure 3a) | Mu(W,100%,5d) | 28 | 460 | n.a. | 420–740 | 2.28×10¹⁶ | 1.87×10¹⁸ | 100 |
| Mu(W,66%,5d) | 28 | 460 | n.a. | 420–740 | 1.51×10¹⁶ | 1.23×10¹⁸ | 66 | |
| Mu(W,33%,5d) | 28 | 460 | n.a. | 420–740 | 7.52×10¹⁵ | 6.17×10¹⁷ | 33 | |
| exp 1b (figure 3b) | Mu(W,100%,10d) | 14 | 460 | n.a. | 420–740 | 2.28×10¹⁶ | 1.87×10¹⁸ | 100 |
| Mu(W,66%,10d) | 14 | 460 | n.a. | 420–740 | 1.51×10¹⁶ | 1.23×10¹⁸ | 66 | |
| Mu(W,33%,10d) | 14 | 460 | n.a. | 420–740 | 7.52×10¹⁵ | 6.17×10¹⁷ | 33 | |
| exp 2 (figure 4) | S(W,100%,5d) | 14 | 460 | n.a. | 420–740 | 2.28×10¹⁶ | 1.87×10¹⁸ | 100 |
| S(G,158%,5d) | 14 | 515 | 38 | 480–570 | 2.64×10¹⁶ | 1.08×10¹⁸ | 158 | |
| S(Y,103%,5d) | 14 | 590 | 15.59 | 560–620 | 3.23×10¹⁶ | 7.53×10¹⁷ | 103 | |
| Mu(W,100%,5d) | 28 | 460 | n.a. | 420–740 | 2.28×10¹⁶ | 1.87×10¹⁸ | 100 | |
| Mu(G,158%,5d) | 28 | 515 | 38 | 480–570 | 2.64×10¹⁶ | 1.08×10¹⁸ | 158 | |
| Mu(Y,103%,5d) | 28 | 590 | 15.59 | 560–620 | 3.23×10¹⁶ | 7.53×10¹⁷ | 103 | |
| exp 3 (figure 5) | S(W,100%,5d) | 14 | 460 | n.a. | 420–740 | 2.28×10¹⁶ | 1.87×10¹⁸ | 100 |
| S(R,170%,5d) | 14 | 635 | 20 | 595–670 | 3.79×10¹⁶ | 1.09×10¹⁸ | 170 | |
| S(B,106%,5d) | 14 | 465 | 25.46 | 410–520 | 1.58×10¹⁶ | 4.36×10¹⁷ | 106 | |
| Mu(W,100%,5d) | 28 | 460 | n.a. | 420–740 | 2.28×10¹⁶ | 1.87×10¹⁸ | 100 | |
| Mu(R,170%,5d) | 28 | 635 | 20 | 595–670 | 3.79×10¹⁶ | 1.09×10¹⁸ | 170 | |
| Mu(B,106%,5d) | 28 | 465 | 25.46 | 410–520 | 1.58×10¹⁶ | 4.36×10¹⁷ | 106 | |
| exp 4 (figure 6) | Mu(D,Ø,5d) | 20 | ||||||
| Mu(B,51%,5d) | 20 | 465 | 25.46 | 410–520 | 7.52×10¹⁵ | 2.08×10¹⁷ | 51 | |
| Mu(B,106%,5d) | 20 | 465 | 25.46 | 410–520 | 1.58×10¹⁶ | 4.36×10¹⁷ | 106 | |
| Mu(B,251%,5d) | 20 | 465 | 25.46 | 410–520 | 3.74×10¹⁶ | 1.03×10¹⁸ | 251 | |
| Mu(UVA,103%,5d) | 20 | 405 | 11.93 | 385–435 | 2.02×10¹⁶ | 4.23×10¹⁷ | 103 | |
| exp 5 (figure 7) | Mu(D,Ø,5d) | 30 | ||||||
| Mu(B,6.2%,5d) | 30 | 465 | 25.46 | 410–520 | 9.40×10¹⁴ | 2.60×10¹⁶ | 6.2 | |
| Mu(B,12.5%,5d) | 30 | 465 | 25.46 | 410–520 | 1.88×10¹⁵ | 5.19×10¹⁶ | 12.5 | |
| Mu(B,25.2%,5d) | 30 | 465 | 25.46 | 410–520 | 3.76×10¹⁵ | 1.04×10¹⁷ | 25.2 | |
| exp 6a (figure 8a) | Mu(D,Ø,5d) | 30 | ||||||
| Mu(B,6.2%,5d) | 30 | 465 | 25.46 | 410–520 | 9.40×10¹⁴ | 2.60×10¹⁶ | 6.2 | |
| Mu(B,9.3%,5d) | 30 | 465 | 25.46 | 410–520 | 1.41×10¹⁵ | 3.90×10¹⁶ | 9.35 | |
| Mu(B,12.5%,5d) | 30 | 465 | 25.46 | 410–520 | 1.88×10¹⁵ | 5.19×10¹⁶ | 12.5 | |
| exp 6b (figure 8b) | Mu(D,Ø,10d) | 30 | ||||||
| Mu(B,6.2%,10d) | 30 | 465 | 25.46 | 410–520 | 9.40×10¹⁴ | 2.60×10¹⁶ | 6.2 | |
| Mu(B,9.3%,10d) | 30 | 465 | 25.46 | 410–520 | 1.41×10¹⁵ | 3.90×10¹⁶ | 9.35 | |
| Mu(B,12.5%,10d) | 30 | 465 | 25.46 | 410–520 | 1.88×10¹⁵ | 5.19×10¹⁶ | 12.5 | |
Table 2.
Published LED specifications. (mcd, millicandela; mW, milliwatt; x, y, CIE chromaticity coordinates; FWHM, full width at half maximum.)
| colour | part number | output | angle (deg.) | wavelength (nm) | x, y or FWHM |
|---|---|---|---|---|---|
| white | RLW-18030 | 18 000 mcd | 30 | 460 | x=0.27, y=0.27 |
| UVA | RL5-UV2030 | 20 mW | 30 | 405 | 11.93 nm |
| blue | RL5-B5515 | 5500 mcd | 15 | 467 | 25.46 nm |
| green | RL5-G13008 | 13 000 mcd | 8 | 525 | 38 nm |
| yellow | RL5-Y5030 | 5000 mcd | 30 | 595 | 15.59 nm |
| red | 5T34VZ-EC-D2 | 4600 mcd | 40 | 625 | 20 nm |
Figure 2.
Light intensity in photons s−1 m−2 as a function of wavelength. (a) Composite of all different spectra introduced in the mu and sham boxes along with the average spectra of those measured in the animal housing facility shown in black. The introduced white spectrum is shown in pink, the UVA in purple and the spectra from the other LEDs shown in representative colours. In (b) is shown how the intensities for the blue spectrum were compared to the animal facility spectrum intensities by integrating between 410 and 520 nm. In a similar way, with the exception of the UVA, the spectra from the other LEDs were compared in intensity with the light in the animal facility. The UVA intensity was normalized to the blue light intensity as there was no measurable UVA in the animal facility.
2.6 Statistical analysis
We have previously shown that repeated shielding of 1 hour per day in the dark over 10 days during the light cycle shows a statistically decreased latency on day 1 and then a statistically increased latency on days 4–6. Note that the comparisons are after 1 hour exposure compared to pre-exposure on each day. In some experiments, increases in latency are seen on other days before day 4 and after day 6. Previous work, only using white light (Koziak et al. 2006), suggested that the first-day post-exposure drop is not affected by light exposure, whereas increased latencies on later days are light sensitive. Hence, in all experiments, we tested the hypothesis that light abolished the increased latency observed after the second day. In addition, for experiments 4, 5, 6a and 6b, in which we titrated the blue light intensity and had a positive control, we also tested the hypothesis that light intensity and wavelength do not affect the first-day post-exposure drop. Paired t-tests were used comparing same-day pre- and post-data, and significance was set at less than 0.05. All results are reported as means±s.e.m.
3. Results
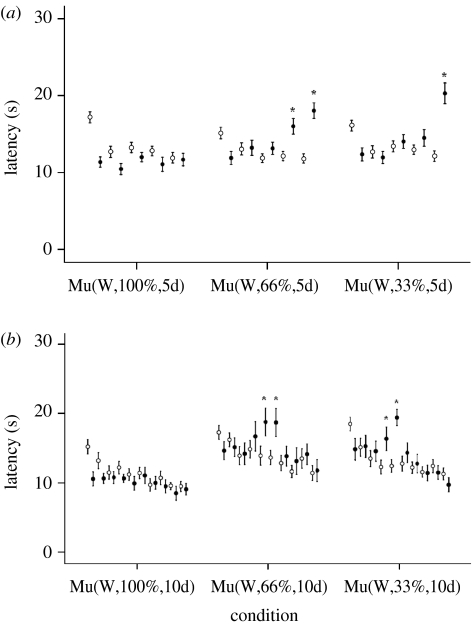
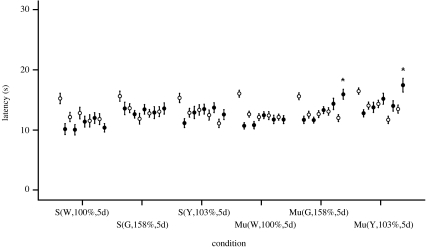
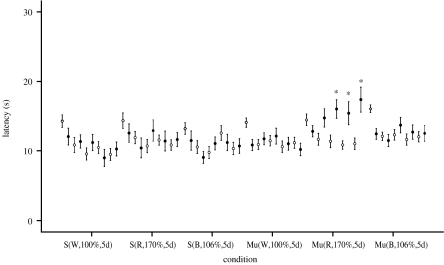
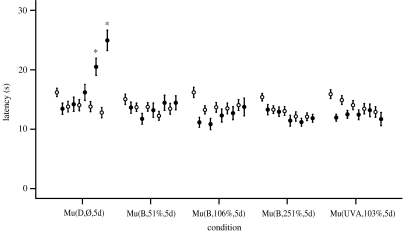
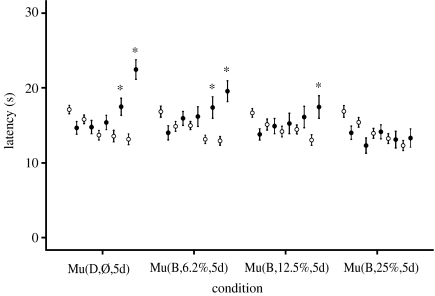
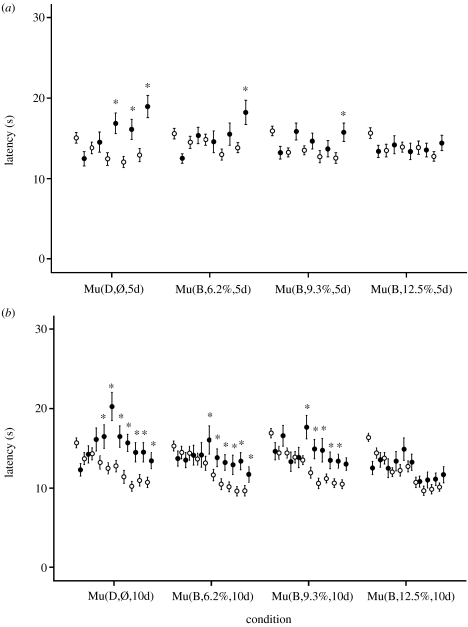
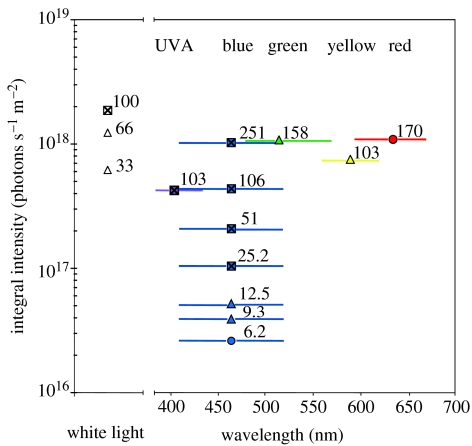
Figures 3–8 show the results for experiments 1–6, respectively. As reported by Koziak et al. (2006), 100% white light abolished the induction of analgesia (figure 3a,b), while a reduction to 66 and 33% gave mixed results. That is, at 66 and 33%, the effect could have returned, but because the experiment did not have a positive control, the effect could have been attenuated. Experiment 2 (figure 4) again demonstrated that 100% white light eliminated the effect, while yellow light at 103% and green light at 158% of the ambient had mixed results. Experiment 3 (figure 5) demonstrated again that 100% white light abolished the effect, and that 106% of blue light also abolished the effect, while an intense red light at 170% of ambient had little or no effect on induced analgesia. Results of experiment 4 (figure 6) demonstrated that UVA light of 103% abolished the effect, as did blue light at 51, 106 and 251%. In experiment 5 (figure 7), blue light of 25% intensity eliminated the effect, while the effect may be attenuated by 12.5%, but may not be affected at 6%. Experiment 6a (figure 8a) further titrates the effect to between 9.3 and 12.5%. In experiment 6b (figure 8b), the exposure intensities used in experiment 6a are re-examined using a 10-day experiment, and shows that when blue intensity exposures are compared to the positive control, the intensity threshold of blue light needed to attenuate/eliminate the induced attenuation effect lies between 9.3 and 12.5%, i.e. between approximately 3.9×10¹⁶ and 5.2×10¹⁶ photons s−1 m−2. Figure 9 summarizes the effect of light intensity and wavelength on the induction of analgesia by ambient magnetic field shielding, as determined in experiments 1–6.
Figure 3.
Mean latencies ±s.e.m. as a function of white light intensity. Open circles correspond to pre-exposure values and filled circles to post-exposure values. *Post-exposure values were statistically significantly different from the pre-exposure values of the same day (p<0.05). (a) There were 28 mice per light condition (100, 66 or 33% of ambient white light; experiment 1a). Mean latencies ±s.e.m. are shown for each of the 5 days both before (pre) introduction into the mu-metal box (Mu) and immediately following (post). (b) The same experiment was run except that the duration was 10 days and 14 mice per light condition were used (experiment 1b).
Figure 4.
Experiment 2 included 14 animals for each of the 3 sham (S) exposures and 28 for each of the 3 mu-metal box-shielded (Mu) exposures. On day 5 of the green (Mu(G,158%,5d)) and yellow (Mu(Y,103%,5d)) light exposures, significant increased latencies (mean±s.e.m.) were seen despite intensities of green and yellow lights that exceeded ambient housing intensities of the same wavelengths. Symbols and asterisk defined are the same as given in the caption of figure 3.
Figure 5.
Experiment 3 included 14 animals in each of the 3 sham (S) groups and 28 for the mu-metal box-shielded (Mu) exposures. Red light (Mu(R,170%,5d)) may have had no effect or had a small effect on the induced analgesia, whereas the blue light (Mu(B,106%,5d)) abolished it. Values are reported as mean±s.e.m. Symbols and asterisk defined are the same as given in the caption of figure 3.
Figure 6.
Experiment 4 included 20 animals in each of the five groups. The induction of analgesia is clearly evident in the positive control (Mu(D,Ø,5d)), whereas blue light intensities similar to that in the animal facility (Mu(B,106%,5d)), half of that intensity (Mu(B,51%,5d)) or two and a half times that intensity (Mu(B,251%,5d)) abolished the analgesia. UVA light (Mu(UVA,103%,5d)) similar in intensity to the Mu(B,106%,5d) condition also abolished the induced analgesia. Values are reported as mean±s.e.m. Symbols and asterisk defined are the same as given in the caption of figure 3.
Figure 7.
Experiment 5 included 30 animals in each of the four groups. The induction of analgesia is clearly evident in the positive control (Mu(D,Ø,5d)). Blue light of an intensity of 25% of that in the animal facility (Mu(B,25%,5d)) abolished the induced analgesia, whereas 6% (Mu(B,6.2%, 5d)) and 12.5% (Mu(B,12.5%,5d)) did not. Values are reported as mean±s.e.m. Symbols and asterisk defined are the same as given in the caption of figure 3.
Figure 8.
(a) Experiment 6a included 30 animals in each of the four groups. This experiment conducted over five consecutive days suggests that the intensity of blue light needed to abolish the induced analgesia was between 9.3 (Mu(B,9.3%,5d)) and 12.5% (Mu(B,12.5%,5d)) of the animal facility intensities in the blue part of the spectrum (410–520 nm). (b) The same experiment (30 animals per group) was carried out to 10 days confirming the results of the 5-day experiment. Values are reported as mean±s.e.m. (Note that the persistence of increased latencies beyond day 7 is not the usual pattern. A search for potential confounds to explain the persistence of analgesia beyond day 7 was negative.) Symbols and asterisk defined are the same as given in the caption of figure 3.
Figure 9.
Summary of results showing the dependence of wavelength and intensity on modulating the induced analgesia post 1 hour of shielded exposure on day 5 (5-day experiments). Squares indicate the abolishment of the induced analgesia, triangles indicate attenuation of the induced analgesia and circles indicate no apparent effect. Symbol colour is indicative of wavelength. Horizontal lines correspond to wavelengths over which the intensity is summed. For the white light experiments, the intensity was summed between 420 and 740 nm. The numbers by each symbol correspond to intensity in percentage when compared with the respective ambient light in the animal facility over the same wavelengths.
Analysis of the statistical significance of reduced latency values after the first day of exposure when compared with the pre-exposure values on the same day is shown for the blue light titration experiments (4, 5, 6a and 6b) in table 3. Note that each of these four experiments had a dark mu-metal box positive control. Of the 12 datasets with blue light exposures, all had reduced latencies after the 1 hour exposures on day 1, and 10 of those were significant and comparable to the positive controls. Of the two reductions that were not significant, the pre-values were the lowest of the 12 blue light exposure datasets. As the first-day reductions are thought to be due to an effect on stress-induced analgesia, it may be that pre-exposure stress levels were lower in these two experiments. As blue light intensities were at the lowest intensity (6.2%) and an intermediate value (51%) for these two sets, these first-day effects seem independent of the blue light intensity.
Table 3.
Significance of the reduction in day 1 post-exposure latencies for experiments 4, 5, 6a and 6b. (The labelling code used in the ‘description’ column is as follows. Mu (light colour, intensity, no. of days in experiment): Mu, mu-metal box; B, blue light; UVA, ultraviolet A light; D, dark; Ø, no light. n.s., not significant at p<0.05.)
| exp no. (figure no.) | description | mean latencies (±s.e.m.) on day 1 | statistical significance (p-value) | |
|---|---|---|---|---|
| pre-exposure | post-exposure | |||
| exp 4 (figure 6) | Mu(D,Ø,5d) | 16.20±0.69 | 13.45±0.93 | 0.006 |
| Mu(B,51%,5d) | 15.05±0.88 | 13.65±0.94 | 0.165 (n.s.) | |
| Mu(B,106%,5d) | 16.20±0.85 | 11.15±0.83 | <0.000 | |
| Mu(B,251%,5d) | 15.40±0.63 | 13.30±0.86 | 0.017 | |
| Mu(UVA,103%,5d) | 15.90±0.72 | 11.95±0.58 | <0.000 | |
| exp 5 (figure 7) | Mu(D,Ø,5d) | 17.00±0.56 | 14.50±0.84 | 0.006 |
| Mu(B,6.2%,5d) | 16.83±0.73 | 13.73±0.96 | 0.005 | |
| Mu(B,12.5%,5d) | 16.60±0.55 | 13.50±0.79 | 0.001 | |
| Mu(B,25.2%,5d) | 16.87±0.79 | 14.00±0.89 | 0.007 | |
| exp 6a (figure 8a) | Mu(D,Ø,5d) | 15.03±0.66 | 12.47±0.89 | 0.002 |
| Mu(B,6.2%,5d) | 15.57±0.68 | 12.50±0.59 | 0.003 | |
| Mu(B,9.3%,5d) | 15.90±0.62 | 13.20±0.78 | 0.002 | |
| Mu(B,12.5%,5d) | 15.63±0.64 | 13.37±0.76 | 0.019 | |
| exp 6b (figure 8b) | Mu(D,Ø,10d) | 15.67±0.63 | 12.27±0.79 | 0.001 |
| Mu(B,6.2%,10d) | 15.27±0.62 | 13.70±0.98 | 0.186 (n.s.) | |
| Mu(B,9.3%,10d) | 16.90±0.60 | 14.60±1.09 | 0.016 | |
| Mu(B,12.5%,10d) | 16.33±0.53 | 12.50±0.80 | <0.000 | |
4. Discussion
These experiments provide evidence that, in mice, the effects of light in modulating magnetic field-influenced behaviours are mediated by the visual system rather than another system, such as the pineal gland through non-visual stimulation or skin absorbance. Also, this result does not seem to be directly affected by ambient light conditions to which the animals are exposed in their housing. It has been established that mouse vision is conferred by two classes of cones having peak sensitivities at 360 and 509–512 nm, and that spectral detection is approximately 350–600 nm, with the sensitivity falling off precipitously above 550 nm (Jacobs et al. 2004). Hence, mice cannot ‘see’ the red light introduced into the boxes, which had little or no effect, and this is consistent with a visual input. Furthermore, mice see the UVA light introduced into the boxes that abolished the increased latencies and this is also consistent with a visual input. Note that blue and UVA light do not penetrate the tissue beyond a few millimetres, and hence in a hair-covered adult mouse it is unlikely that the light effect on magnetic behaviours was modulated by direct action on the pineal gland. Hence, it is probable that these light effects are input through the eyes of the mice as in birds (Wiltschko & Wiltschko 2006), rather than the pineal gland as in newts (Phillips et al. 2001). However, to properly support this suggestion, blind or transgenic mice with rod and/or cone and other receptor deficits (Umino et al. 2008) should be tested.
It is clear from the experiments (summarized in figure 9) that blue light abolishes the induced analgesia for intensities ranging from 251, 106, 51, 25 and probably 12.5% of the amount of ambient blue light in the animal housing facility. This also strongly suggests that the effect is not dependent on prior or habitat light exposure conditions. Also, the fact that the UVA light exposures (103% when compared with the blue) had results identical to those five blue intensity exposures, and that there was no UVA in the animal housing exposure conditions is also consistent with the suggestion that the effect is not dependent on prior conditioning. This is somewhat at odds with the bird literature, which suggests that different effects occur at different light intensities (Muheim et al. 2002) and that these light intensity-dependent effects in birds are related to prior light conditioning. Whether or not other magnetic field-related behaviours in mice (Muheim et al. 2006), such as orientation, are related to light intensity is still unknown.
The light threshold for the effect seen is different in the ‘white’ light experiments compared with the blue light experiments. In two separate experiments, one for five consecutive days (experiment 1a, figure 3a) and the other for 10 days (experiment 1b, figure 3b), the effect at least partially returned at white light intensities of 1.23×10¹⁸ photons s−1 m−2 (blue peak at 460 nm was 1.51×10¹⁶) compared with the blue 9.3% with 3.90×10¹⁶ (peak at 465 nm was 1.41×10¹⁵; experiments 6a and 6b, figure 8a,b). Even if we discount the intensity comparisons for the full spectrum arguing that the mouse receptors are more sensitive to blue light than to longer wavelength light, there is still a difference of a factor of 10 between the blue peaks. This may suggest that other wavelengths in the white light spectrum may have a confounding effect on the blue light effect. This has certainly been suggested in birds (Muheim et al. 2002). An examination of figure 2a shows that the white light exposure was heavily biased towards shorter wavelengths than the ambient animal housing light spectrum. This suggests that we try an experiment wherein we introduce white light with a greater relative intensity at the longer wavelength receptors of the mouse (509–512 nm). Note that the green and yellow light exposures (experiment 2, figure 4) are hard to interpret: there seems to be a modest tendency for the analgesia (i.e. antinociception) to return under these conditions but we did not have a positive control (mu-dark) for comparison. Note that green should have preferentially stimulated the longer wavelength mouse receptor (peak at 509–512 nm), while yellow was expected to give similar results to the red exposure, although yellow can still be seen by the longer wavelength receptor. Hence, the red light could not be seen and had no effect, and the green, and to a lesser extent the yellow light, could be seen but had little effect. This could be explained by the less sensitive longer wavelength receptor in the mouse having an antagonist action to the mouse's shorter wavelength receptor similar to that proposed in birds (Deutschlander et al. 1999). In figure 9, we summarize our results and present the material in a manner similar to that used by Muheim et al. (2002; figure 5), comparing the dependence of the effect on irradiance and wavelength.
Work done in mice (Jacobs et al. 2004) indicates that the intensities of light that we have used will stimulate both the short- and long-wavelength cone receptors, and hence during all our non-dark experiments, mice were exposed to photopic conditions. To our knowledge, it is unknown whether similar intensity exposures fall in the scotopic, photopic or the mesopic range separating the scotopic and photopic vision in birds. It is important to note that our suggestion of similar light intensity thresholds between mice and birds is based on irradiance values (photons s−1 m−2) rather than actual intensity at the retina (Jacobs et al. (2004) suggest using photons/s/sr, which allows for correction of differences in animal pupil area). However, it is still possible that the actual biophysical transduction mechanisms may be in another receptor besides the cones, and experiments using transgenic/knockout mice with deficient rods or cones (Umino et al. 2008) or deficient in other light-sensitive compounds (Sancar 2004) are needed to resolve this issue.
Since 1984, it has been shown by us and others (see review by Del Seppia et al. 2007) that single exposures of snails, mice and rats to static and time-changing magnetic fields well above ambient levels can attenuate opioid-induced antinociception and that repeated daily exposures can induce antinociception (i.e. analgesia). Furthermore, it has been shown that this effect is dependent on simultaneous exposure to light (Prato et al. 1996a), and that this is likely to occur at or near the magnetic field detection stage as it is not due to a direct effect of light on opioid-induced analgesia (Prato et al. 1998). Unfortunately to date, the light intensity and wavelength for this effect have not been investigated except for the evidence that exposure to red light does not modulate the magnetic field sense in these experiments (Betancur et al. 1994; Prato et al. 1998). By contrast, the work on magnetic field shielding suggests that repeated daily shielding of the ambient magnetic field during the day cycle can induce analgesia. We suggest that under those dark shielded conditions, mice can sense the loss of the ambient magnetic field, but above a certain intensity of short-wavelength light, the ability to detect the missing ambient fields is lost. Could it be that in birds and newts they similarly can no longer detect the ambient geomagnetic fields when light of a certain wavelength exceeds an intensity threshold? At least in mice, we suggest that light modulates the detection of both the weak ambient magnetic fields and the stronger artificial magnetic fields. Are there similar data for bird orientation? In a recent publication by Wiltschko et al. (2007a), turquoise light exposure (502 nm) shows perhaps similar effects on animal orientation behaviour, albeit at a static geomagnetic field. Normal orientation behaviour was observed at low-intensity turquoise light (8×10¹⁵ photons s−1 m−2) but was lost when the intensity was increased to 36×1015 photons s−1 m−2 (at this intensity orientation became axial) and then returned to a northerly ‘fixed direction’ when the intensity was increased even further to 54×1015 and 72×1015 photons s−1 m−2. At this higher light intensity, this northerly orientation did not change between autumn and spring, was not controlled by the inclination compass and could not be disrupted by applying an RF field like the normal orientation under low light levels. In a very recent publication by Stapput et al. (2008), orientation similar to that seen under high-intensity light was reported in birds in ‘total darkness’. Also, the Wiltschko et al. (2007a) report suggested that threshold light levels may increase with increasing wavelengths. These results taken together suggest experiments in mice, which have only two receptors and not four as in birds, wherein the modulation effect of light on the detection of both ambient and exogenous magnetic fields is investigated for different intensities and wavelengths which selectively stimulate only one set of cones at a time.
As we have shown that exogenous magnetic fields can induce analgesia in mice (Shupak et al. 2004) and potentially in humans (Thomas et al. 2007), it has not escaped us that an understanding of the role of light in modulating induced analgesia may be important for the effects of magnetic fields, shielded and exogenous, on opioid-like behaviours in humans. It may be that results reported in the substantial animal orientation literature may guide our understanding of the effects in mammals including humans.
It is of interest that there is growing evidence in animal orientation, including that in birds, that there is a magnetoreception behaviour that is modulated by light exposure and one that is not. Most recently, Wiltschko et al. (2007b) have shown this in European robins, wherein a topical analgesic applied to the bird's upper beak affected a fixed direction response while RF field exposure shown to disrupt a light-dependent magnetic field orientation mechanism did not. Note that in our previous work (Koziak et al. 2006), we did not see an effect of white light exposure on the drop in latency times seen on day 1 post-shielding, and this is consistent with the observation that a single exposure to magnetic field shielding can attenuate stress-induced analgesia (Del Seppia et al. 2000; Choleris et al. 2002). We examined the dependence of this drop of post-exposure day 1 latencies as a function of the blue light titration experiments, as shown in table 3. Within experimental error, this feature seen in all the positive controls (dark shielding exposures in figures 6–8) persists in the blue exposures independent of blue light intensity (figures 6–8). As in the animal orientation literature, this ‘mouse in the mu-metal box’ experimental protocol demonstrates magnetic field-related effects that are both light dependent and independent.
The mouse blue threshold that we have measured (3.9×10¹⁶ photons s−1 m−2 integral and 1.41×10¹⁵ peak) is consistent with the light intensities that have been shown to cause effects in birds when coloured light is used (i.e. approximately 1016–1017 photons s−1 m−2; Muheim et al. 2002). Given these similarities, it is suggested that our mouse in the mu-metal box protocol is an excellent way to further approach mechanistic questions being asked, such as (i) the role of the radical pair mechanism (Ritz et al. 2000; Mouritsen & Ritz 2005; Wiltschko et al. 2005; Wiltschko & Wiltschko 2006), (ii) the role of antagonistic receptors (Deutschlander et al. 1999; Muheim et al. 2002), (iii) the molecular and neuronal bases of detection (Mouritsen & Ritz 2005; Frost & Mouritsen 2006; Heyers et al. 2007), and (iv) light-dependent and -independent effects. However, experimental protocols developed for animal orientation will have to be carefully adapted to obtain meaningful results when applied to the mouse in the mu-metal box paradigm. For example, it has been suggested that RF exposures can be used to test the hypothesis of a radical pair mechanism (Ritz et al. 2004): normal ambient magnetic field-dependent behaviour is seen if the resonant RF-applied magnetic field is parallel to the static field but is abolished if the RF field is non-parallel. In these animal orientation experiments, the frequency of the applied RF must be proportional to the static field, while in the experiments reported here the static field is shielded (i.e. reduced to close to zero). Hence, it is not clear what RF frequency to use and how to interpret the results. For example, if an RF exposure eliminates the ability to detect the absence of the ambient field in the dark, then the RF exposure approach, as a means to identify a radical pair mechanism of ambient magnetic field detection, may be brought into question (Johnsen & Lohmann 2008).
In our previous publications regarding the modulation effects of light on magnetic field effects (Prato et al. 1996a, 1997, 1998; Kavaliers et al. 1998; Kavaliers & Prato 1999), we have repeatedly pointed out that there are light-dependent and -independent effects. We have suggested that the mechanisms may be similar to the one proposed by Lednev (1996), which has some similarities to the free radical mechanism but, as formulated, does not require optical pumping. The theory does predict a ‘zero’ field effect (Lednev et al. 1997), but has not been tested for light intensity or wavelength dependency. We have experimentally validated predictions of this theory suggesting that magnetic field effects in the land snail might not depend on magnetite or induced electric currents (Prato et al. 1996b). Furthermore, we have accumulated indirect evidence that the light effect probably occurs at the magnetic field detection stage (Prato et al. 1998) and the predictions of Lednev's theory are also light dependent (Prato et al. 1996a, 1997, 2000). We have proposed that Lednev's theory could be modified to include the need for photon excitation (Prato et al. 1996a). Rather than an electronic level being excited by a photon as in the current radical pair mechanism espoused for animal orientation, in Lednev's theory it is proposed that a metal ion such as calcium in a protein-generated potential well be excited by a photon. We have previously shown that a potential candidate for this protein well is the calcium well within the calmodulin-dependent nitric oxide synthase (Kavaliers et al. 1998; Kavaliers & Prato 1999). This ‘mouse in a box’ protocol may provide new opportunities to collect new data towards the development of a theory of magnetic field detection that explains both the animal orientation and non-orientation data.
Acknowledgments
This work was supported in part by a Canadian Institutes of Health Research operating grant (no. MOP 43874). All experiments were conducted according to the Canadian guidelines for laboratory animal care. The authors thank Dr Janice DeMoor for assistance in manuscript preparation, and Dr Gerald H. Jacobs and Mr Kris Krogh for discussions regarding mouse colour vision.
References
- Betancur C, Dell'Omo G, Alleva E. Magnetic field effects on stress-induced analgesia in mice: modulation by light. Neurosci. Lett. 1994;182:147–150. doi: 10.1016/0304-3940(94)90784-6. [DOI] [PubMed] [Google Scholar]
- Choleris E, Del Seppia C, Thomas A.W, Luschi P, Ghione S, Moran G.R, Prato F.S. Shielding, but not zeroing of the ambient magnetic field reduces stress-induced analgesia in mice. Proc. R. Soc. B. 2002;269:193–201. doi: 10.1098/rspb.2001.1866. [DOI] [PMC free article] [PubMed] [Google Scholar]
- Del Seppia C, Luschi P, Ghione S, Crosio E, Choleris E, Papi F. Exposures to a near zero hypogeomagnetic field or oscillating magnetic fields similarly reduce stress-induced analgesia in C57 male mice. Life Sci. 2000;66:1299–1386. doi: 10.1016/S0024-3205(00)00437-9. [DOI] [PubMed] [Google Scholar]
- Del Seppia C, Ghione S, Luschi P, Ossenkopp K.-P, Choleris E, Kavaliers M. Pain perception and electromagnetic fields. Neurosci. Behav. Rev. 2007;31:619–642. doi: 10.1016/j.neubiorev.2007.01.003. [DOI] [PubMed] [Google Scholar]
- Deutschlander M.E, Phillips J.B, Borland S.C. The case for light-dependent magnetic orientation in animals. J. Exp. Biol. 1999;202(Pt 8):891–908. doi: 10.1242/jeb.202.8.891. [DOI] [PubMed] [Google Scholar]
- Frost B.J, Mouritsen H. The neural mechanisms of long distance animal navigation. Curr. Opin. Neurobiol. 2006;16:481–488. doi: 10.1016/j.conb.2006.06.005. [DOI] [PubMed] [Google Scholar]
- Heyers D, Manns M, Luksch H, Gunturkun O, Mouritsen H. A visual pathway links brain structures active during magnetic compass orientation in migratory birds. PLoS ONE. 2007;2:e937. doi: 10.1371/journal.pone.0000937. [DOI] [PMC free article] [PubMed] [Google Scholar]
- Jacobs G.H, Williams G.A, Fenwick J.A. Influence of cone pigment coexpression on spectral sensitivity and color vision in the mouse. Vision Res. 2004;44:1615–1622. doi: 10.1016/j.visres.2004.01.016. [DOI] [PubMed] [Google Scholar]
- Johnsen S, Lohmann K.J. Magnetoreception in animals. Phys. Today. 2008;61:29–35. doi: 10.1063/1.2897947. [DOI] [Google Scholar]
- Kavaliers M, Prato F.S. Light-dependent effects of magnetic fields on nitric oxide activation in the land snail. Neuroreport. 1999;10:1863–1867. doi: 10.1097/00001756-199906230-00012. [DOI] [PubMed] [Google Scholar]
- Kavaliers M, Choleris E, Prato F.S, Ossenkopp K.-P. Evidence for the involvement of nitric oxide and nitric oxide synthase in the modulation of opioid-induced antinociception and the inhibitory effects of exposure to 60-Hz magnetic fields in the land snail. Brain Res. 1998;809:50–57. doi: 10.1016/S0006-8993(98)00844-0. [DOI] [PubMed] [Google Scholar]
- Koziak A.M, Desjardins D, Keenliside L.D, Thomas A.W, Prato F.S. Light alters nociceptive effects of magnetic field shielding. Bioelectromagnetics. 2006;27:10–15. doi: 10.1002/bem.20170. [DOI] [PubMed] [Google Scholar]
- Lednev V.V. Bioeffects of weak combined, constant and variable magnetic fields. Biophysics. 1996;41:241–252. [Google Scholar]
- Lednev V.V, Srebnitskaya L.K, Il'yasova Y.N, Rozhdestvenskaya Z.Y, Klimov A.A, Belova N.A, Tiras K.P. Magnetic parametric resonance in biosystems: experimental verification of the predictions of a theory using regenerating planarians Dugesia tigrina as a test system. Biophysics. 1997;41:825–835. [Google Scholar]
- Mouritsen H, Ritz T. Magnetoreception and its use in bird navigation. Curr. Opin. Neurobiol. 2005;15:406–414. doi: 10.1016/j.conb.2005.06.003. [DOI] [PubMed] [Google Scholar]
- Muheim R, Backman J, Akesson S. Magnetic compass orientation in European robins is dependent on both wavelength and intensity of light. J. Exp. Biol. 2002;205:3845–3856. doi: 10.1242/jeb.205.24.3845. [DOI] [PubMed] [Google Scholar]
- Muheim R, Edgar N.M, Sloan K.A, Phillips J.B. Magnetic compass orientation in C57BL/6J mice. Learn. Behav. 2006;34:366–373. doi: 10.3758/bf03193201. [DOI] [PubMed] [Google Scholar]
- Němec P, Burda H, Peichl L. Subcortical visual system of the African mole-rat Cryptomys anselli: to see or not to see? Eur. J. Neurosci. 2004;20:757–768. doi: 10.1111/j.1460-9568.2004.03510.x. [DOI] [PubMed] [Google Scholar]
- Peichl L, Němec P, Burda H. Unusual cone and rod properties in subterranean African mole-rats (Rodentia, Bathyergidae) Eur. J. Neurosci. 2004;19:1545–1558. doi: 10.1111/j.1460-9568.2004.03263.x. [DOI] [PubMed] [Google Scholar]
- Phillips J.B, Deutschlander M.E, Freake M.J, Borland S.C. The role of extraocular photoreceptors in newt magnetic compass orientation: parallels between light-dependent magnetoreception and polarized light detection in vertebrates. J. Exp. Biol. 2001;204:2543–2552. doi: 10.1242/jeb.204.14.2543. [DOI] [PubMed] [Google Scholar]
- Prato F.S, Kavaliers M, Carson J.J.L. Behavioural responses to magnetic fields by land snails are dependent on both magnetic field direction and light. Proc. R. Soc. B. 1996a;263:1437–1442. doi: 10.1098/rspb.1996.0209. [DOI] [Google Scholar]
- Prato F.S, Kavaliers M, Carson J.J.L. Behavioural evidence that magnetic field effects in the land snail, Cepaea nemoralis, might not depend on magnetite or induced electric currents. Bioelectromagnetics. 1996b;17:123–130. doi: 10.1002/(SICI)1521-186X(1996)17:2%3C123::AID-BEM6%3E3.0.CO;2-5. [DOI] [PubMed] [Google Scholar]
- Prato F.S, Kavaliers M, Cullen A.P, Thomas A.W. Light-dependent and -independent behavioral effects of extremely low frequency magnetic fields in a land snail are consistent with a parametric resonance mechanism. Bioelectromagnetics. 1997;18:284–291. doi: 10.1002/(SICI)1521-186X(1997)18:3%3C284::AID-BEM13%3E3.0.CO;2-P. [DOI] [PubMed] [Google Scholar]
- Prato F.S, Kavaliers M, Thomas A.W, Ossenkopp K.-P. Modulatory actions of light on the behavioural responses to magnetic fields by land snails probably occur at the magnetic field detection stage. Proc. R. Soc. B. 1998;265:367–373. doi: 10.1098/rspb.1998.0304. [DOI] [Google Scholar]
- Prato F.S, Kavaliers M, Thomas A.W. Extremely low frequency magnetic fields can either increase or decrease analgesia in the land snail depending on field and light conditions. Bioelectromagnetics. 2000;21:287–301. doi: 10.1002/(SICI)1521-186X(200005)21:4%3C287::AID-BEM5%3E3.0.CO;2-N. [DOI] [PubMed] [Google Scholar]
- Prato F.S, Robertson J.A, Desjardins D, Hensel J, Thomas A.W. Daily repeated magnetic field shielding induces analgesia in CD-1 mice. Bioelectromagnetics. 2005;26:109–117. doi: 10.1002/bem.20056. [DOI] [PubMed] [Google Scholar]
- Ritz T, Adem S, Schulten K. A model for photoreceptor-based magnetoreception in birds. Biophys. J. 2000;78:707–718. doi: 10.1016/S0006-3495(00)76629-X. [DOI] [PMC free article] [PubMed] [Google Scholar]
- Ritz T, Thalau P, Phillips J.B, Wiltschko R, Wiltschko W. Resonance effects indicate a radical-pair mechanism for avian magnetic compass. Nature. 2004;429:177–180. doi: 10.1038/nature02534. [DOI] [PubMed] [Google Scholar]
- Sancar A. Regulation of the mammalian circadian clock by cryptochrome. J. Biol. Chem. 2004;279:34 079–34 082. doi: 10.1074/jbc.R400016200. [DOI] [PubMed] [Google Scholar]
- Shupak N.M, Hensel J.M, Cross-Mellor S.K, Kavaliers M, Prato F.S, Thomas A.W. Analgesic and behavioural effects of a 100 μT specific pulsed extremely low frequency magnetic field on control and morphine treated CF-1 mice. Neurosci. Lett. 2004;354:30–33. doi: 10.1016/j.neulet.2003.01.001. [DOI] [PubMed] [Google Scholar]
- Stapput K, Thalau P, Wiltschko R, Wiltschko W. Orientation of birds in total darkness. Curr. Biol. 2008;18:602–606. doi: 10.1016/j.cub.2008.03.046. [DOI] [PubMed] [Google Scholar]
- Thalau P, Ritz T, Burda H, Wegner R.E, Wiltschko R. The magnetic compass mechanisms of birds and rodents are based on different physical principles. J. R. Soc. Interface. 2006;3:583–587. doi: 10.1098/rsif.2006.0130. [DOI] [PMC free article] [PubMed] [Google Scholar]
- Thomas A.W, Graham K, Prato F.S, McKay J.C, Morley Forster P, Moulin D.E, Chari S. A randomized, double-blind, placebo-controlled clinical trial using a low-frequency magnetic field in the treatment of musculoskeletal chronic pain. Pain Res. Manag. 2007;12:249–258. doi: 10.1155/2007/626072. [DOI] [PMC free article] [PubMed] [Google Scholar]
- Umino Y, Solessio E, Barlow R.B. Speed, spatial and temporal tuning of rod and cone vision in mouse. J. Neurosci. 2008;28:189–198. doi: 10.1523/JNEUROSCI.3551-07.2008. [DOI] [PMC free article] [PubMed] [Google Scholar]
- Wiltschko R, Wiltschko W. Magnetoreception. Bioessays. 2006;28:157–168. doi: 10.1002/bies.20363. [DOI] [PubMed] [Google Scholar]
- Wiltschko R, Ritz T, Stapput K, Thalau P, Wiltschko W. Two different types of light-dependent responses to magnetic fields in birds. Curr. Biol. 2005;15:1518–1523. doi: 10.1016/j.cub.2005.07.037. [DOI] [PubMed] [Google Scholar]
- Wiltschko R, Stapput K, Bischof H.-J, Wiltschko W. Light-dependent magnetoreception in birds: increasing intensity of monochromatic light changes the nature of the response. Front. Zool. 2007a;4:5. doi: 10.1186/1742-9994-4-5. [DOI] [PMC free article] [PubMed] [Google Scholar]
- Wiltschko R, Stapput K, Ritz R, Thalau P, Wiltschko W. Magnetoreception in birds: different physical processes for two types of directional responses. HFSP J. 2007b;1:41–48. doi: 10.2976/1.2714294/10.2976/1. [DOI] [PMC free article] [PubMed] [Google Scholar]


