Preface
The Wellcome Trust Sanger Institute is one of the world’s largest genome centres, and a substantial amount of our sequencing is performed on ‘next generation’ massively parallel sequencing technologies: in June 2008 the quantity of purity filtered sequence data generated by our Genome Analyzer (Illumina) platforms reached 1 terabase, and our average weekly Illumina production output is currently 64gigabases (Gb). Here we describe a set of improvements we have made to the standard Illumina protocols to make the library preparation more reliable in a high throughput environment, to reduce bias, tighten insert size distribution, and reliably obtain high yields of data.
Introduction
Next-generation DNA sequencers, such as the 454-FLX (Roche; http://www.454.com), SOLiD (Applied Biosystems; http://solid.appliedbiosystems.com) and Genome Analyzer (Illumina; http://www.illumina.com/pages.ilmn?ID=204) have transformed the landscape of genetics through their ability to produce hundreds of megabases of sequence information in a single run. This has enabled us to design genome-wide and ultra-deep sequencing projects that, because of their enormity, would not otherwise have been possible (for reviews see references 1 and 2, and for an evaluation of the performance of these three platforms see 3).
At the Wellcome Trust Sanger Institute we currently have all three of these sequencing platforms, though the Genome Analyzer is the platform we have invested most heavily in: we have 28 machines on site, all capable of generating paired end data. The Illumina data analysis pipeline performs “Purity Filtering” of this data, to eliminate sequence data from clusters that appear to be mixed as a consequence of their proximity on the flowcell. We typically generate 4-5Gb filtered sequence data, with an error rate of <0.9%, per seven day, 36-cycle paired end run, making us one of the world’s largest and most productive user of Illumina sequencers.
Main text
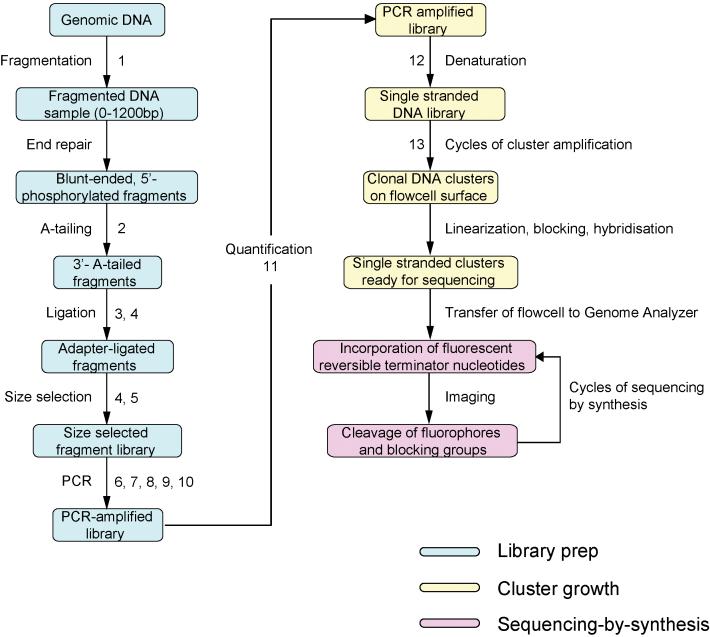
Sequencing library preparation involves the production of a random collection of adapter-modified DNA fragments, with a specific range of fragment sizes, which are ready to be sequenced. We have found the standard Illumina sequencing library preparation protocols (Fig 1.) to be suboptimal in several respects, and our output has been enhanced by developing and implementing many modifications and improvements to these protocols, all with the aim of obtaining the maximum number of high quality sequence reads per run from the lowest mass of starting DNA, in a robust and reproducible way. The modifications and improvements described in this article can be adopted en masse as an alternative library preparation pipeline, though because some steps are additional rather than alternative, we tend to select different modifications for different sequencing projects, depending upon the specific requirements of that project (Supplementary Table 1 online). Here we have attempted to describe each modification in the order in which it would fit in to the standard library preparation pipeline.
Figure 1. Illumina sequencing workflow.
Stages in the library prep. Steps accompanied by numbers are those for which we suggest alternatives to the standard Illumina protocols and numbers correspond to those given in Supplementary Protocols 1-13 online.
Fragmentation
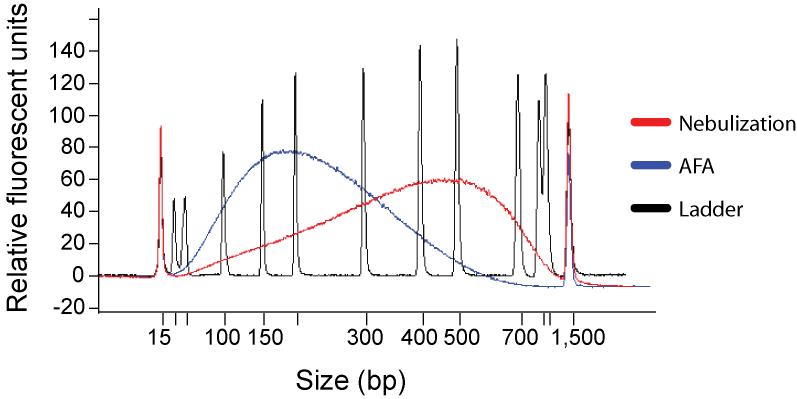
The first stage in a standard genomic DNA library preparation for the Genome Analyzer is DNA fragmentation by nebulisation (in 30-60% glycerol at 30-35psi). This generates fragments with a typical size range of 0-1200bp and a peak around 5-600bp. Nebulisation is a fairly reproducible technique, is sequence-independent and is rapid and inexpensive 4. However, the wide size distribution of generated fragments is uneconomical: by mass, 200bp +/- 20bp fragments represent only ∼10% of the total DNA after nebulisation. Moreover, approximately half of the DNA vaporises during nebulisation, meaning that only 5% of the original DNA is used for subsequent library generation. Even under much more extreme nebulisation conditions (e.g. 90psi for 18 minutes) it is not possible to move the fragment size peak below around 400bp, and doing so still does not improve the yield at 200bp (reference 4 and personal observation). Thus we have evaluated alternative methods of sample fragmentation.
Adaptive Focused Acoustics
We now routinely fragment DNA samples using Adaptive Focused Acoustics technology in a 24-well format (AFA, Covaris). In this process, acoustic energy is controllably focused into the aqueous DNA sample by a dish-shaped transducer, resulting in cavitation events within the sample. The collapse of bubbles in the suspension creates multiple, intense, localized jets of water, which disrupt the DNA molecules in a reproducible and predictable way.
Following disruption, 200bp fragments comprise 17% of the total fractionated DNA by mass, but in contrast to nebulisation, very little DNA is lost during the fragmentation process, generating a 4-5-fold higher yield of the intended fragment size range (Supplementary Protocol 1 online and Fig. 2). Additionally, because of its high-throughput capability, AFA has enabled highly multiplexed sequencing using indexing tags, where each sample needs to be processed separately until after PCR amplification (Fig. 1). In addition, because the size distribution of DNA fragmented by AFA is narrow, for some applications, such as array enrichment of targeted loci 5,6, we are able to omit the gel size selection step altogether from the library preparation, decreasing the workload and increasing yields further.
Figure 2. Sample Fragmentation.
Comparison of fragmentation by nebulization with AFA technology. 4.5μg of human genomic DNA was fragmented by nebulization and AFA, purified with a spin column, eluted in 30μl of 10mM Tris pH8.5 and 1μl of each eluate was run on an Agilent Bioanalyzer 2100 DNA 100 chip. For a 200bp library +/- 20bp, the yield produced by AFA is four- to fivefold greater than that produced by nebulization.
A-tailing, ligation and size selection
After close scrutiny of paired end reads obtained from the Genome Analyzer, i.e. those in which each cluster was sequenced in both forward and reverse directions, we discovered a number of artefacts that could be attributed to the standard library preparation protocol:
bias in the base composition of sequences
high frequency of chimeric sequences
imperfect distribution of insert sizes.
These have all been overcome by the use of several protocol modifications, described in the following sections:
Paired End oligos
We no longer use the Illumina single end adapters or PCR primers because paired end oligos generate sequencing libraries that are compatible with both single and paired end flowcells. The adapters themselves are modified to confer protection from digestion at the 3′ T-overhang. Though we do not have the details of the modification used by Illumina, we have obtained comparable results using our own adapters and PCR primers modified with a phosphorothioate between the two bases at the 3′ end (Supplementary Protocol 2 online).
Gel extraction
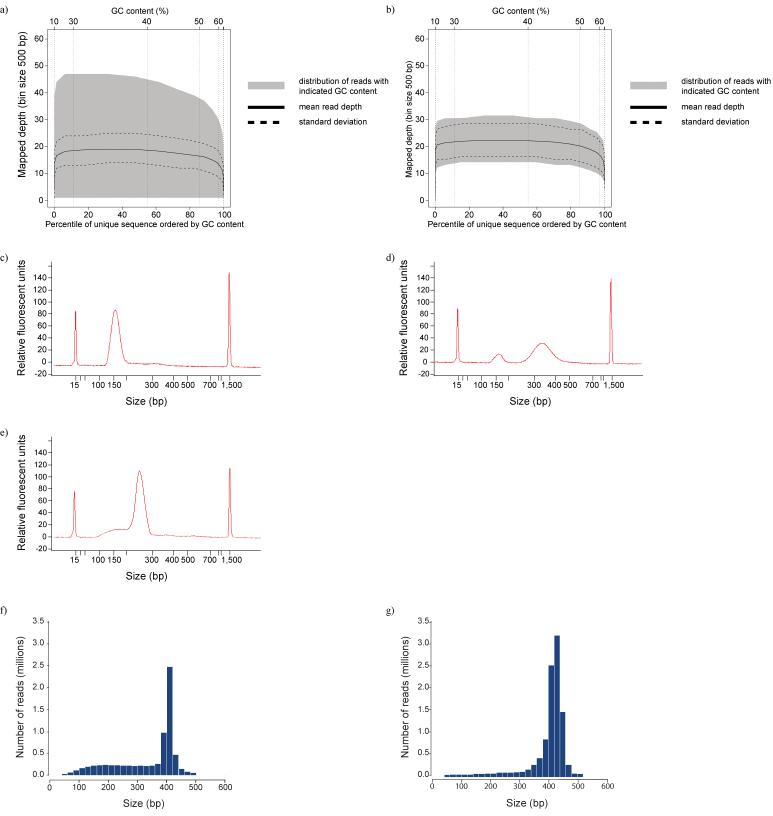
During the size selection step of the standard library prep protocol, a gel slice is taken and the DNA extracted. We identified that melting this gel slice by heating to 50°C in chaotropic buffer decreased the representation of A/T-rich sequences, possibly reflecting a higher affinity of spin columns for double stranded DNA, as strands with a high A/T content will be most likely to become denatured during this step, and may not reanneal. To improve the representation of these A/T rich sequences we modified the gel extraction protocol, melting agarose gel slices in the supplied buffer at room temperature. This reduces GC bias considerably (Supplementary Protocol 3 online; Fig. 3 a and b).
Figure 3. A-tailing, ligation and size selection.
GC plots before (a) and after (b) optimisation of gel extraction. The figures show the total area in which reads with a particular GC content are distributed, with the mean and standard deviation. The greater width of shaded area in plot a) indicates a wider dispersion of coverage for all values of GC content for which sequences were obtained.
Agilent traces Bioanalyzer 2100 traces for two suboptimal libraries c) 60bp insert library, with optimised PCR, d) the same 60bp library with excess DNA in PCR e) 200bp insert library, showing shoulder of small fragments.
Insert size distribution from sequenced human DNA using f) the standard and g) modified paired end library prep protocols
Double size selection
Partially complementary adapters, which essentially consist of the sequences to which the sequence primers hybridise during the sequencing reaction, are ligated onto the A-tailed fragments 7 via a T-overhang (Fig. 1). Their structure ensures that each template strand receives different sequences at the opposite ends (D. Smith & J. Malek, US patent 0172839, 2007), and works in much the same way as a vectorette 8.
Inefficient end-repair or A-tailing reactions will result in a lower concentration of template to which adapters can be successfully ligated, and so the relative concentration of adapters is increased, which will promote the formation of adapter dimers. If these dimers are not removed, they will ultimately be sequenced along with the intended template, wasting the capacity of the flowcell. Additionally, inefficient A-tailing will result in a high proportion of blunt ended template molecules, which can self-ligate, generating chimeric sequences.
It is likely that the efficiency of the A-tailing step will be improved by the use of alternative polymerases and higher concentrations of magnesium ions. Additionally, the efficiency of the ligation step appears to be improved by the use of ultra pure ligases, such as those from Enzymatics (http://www.enzymatics.com), which are virtually free from the contaminating exonuclease activity generally found in standard commercial preparations of ligases. Using this enzyme we have achieved a 20-30% increase in yield of successfully ligated fragments (as determined by qPCR - see below; Supplementary Protocol 4 online), presumably because the reduced exonuclease activity regenerates fewer blunt ended fragments after A-tailing.
However, although the steps described above may reduce the formation of blunt ended ligation concatemers, enzymatic reactions are rarely 100% efficient, and so a small proportion of template strands will still be chimeric. In many applications, a low frequency of chimeric sequences will present no problem, and can simply be removed informatically. In other applications, such as detection of infrequent de novo recombinant molecules, chimeric sequences will generate false positives, so their frequency needs to be reduced, to minimize the amount of subsequent confirmatory work.
Chimeric templates will be longer than the singletons, which provides a way of preventing them from contaminating the DNA fraction: for applications where a low frequency of chimeric templates is required we perform an additional size selection, after shearing but before ligation (Supplementary Protocol 5 online). This results in a narrow size range being available for ligation. Any blunt ended concatemers are appreciably longer than the singletons and we remove these in the post-ligation size selection step. This additional size selection reduces the incidence of chimeras to 0.02%, compared to up to 5% with the standard library prep protocol, and we have found this step to have the added benefit of reducing the shoulder of small insert sizes, giving a tighter insert size distribution of the desired fraction (Fig. 3c-e), which leads to clusters with more uniform diameter.
Paired end size selection
Using standard protocols, we found single end library preparations, using single or paired end adapters, to be considerably more robust at the size selection gel step than their paired end counterparts. With single end preps, we excise a band of 50bp or larger, which generally yields more than enough DNA to give a high yield of PCR products. However, for the paired end protocol, a scalpel is inserted into the gel at the desired position, the blade is washed with Tris buffer, and this buffer acts as the template for the PCR amplification. We found this practice to yield enough DNA to give successful amplification only in approximately 30-40% of attempts. To overcome this, we now excise a 2mm wide gel slice containing DNA of the desired size and extract that following the Illumina protocol, though with no heating step during the melting step, as discussed earlier (Supplementary Protocol 3 online). In our hands this typically yields 10-20 times more DNA than the standard protocol, has an almost 100% success rate and generates an acceptably narrow size distribution of paired end reads (Fig. 3f and g).
PCR
As well as increasing robustness, extracting more DNA from gel slices enables the DNA to be quantified more accurately prior to PCR amplification. The PCR step introduces to the adapter ligated template molecules the oligonucleotide sequences required for hybridisation to the flowcell surface.
Template quantity
By using optimized quantities of template in the PCR, we can ensure a clean library, free of adapter dimer or single stranded DNA. We routinely analyse our sequencing libraries after PCR by microfluidic capillary electrophoresis and have noticed that the quality of the library obtained decreases with increasing concentration of template DNA: too much template DNA often results in the accumulation of an apparently higher molecular weight peak (Fig. 3d) which may represent a single stranded template product that accumulates as primers become depleted. Conversely, the lower the mass of DNA used in the PCR, the fewer the number of template strands for the same fragment size, and the greater the incidence of PCR duplicates in the resulting sequences: we have observed libraries from which as many as 60% of sequences were PCR duplicates. Thus it is essential to choose the appropriate set of conditions for each PCR (Supplementary Protocol 6 online).
PCR yield
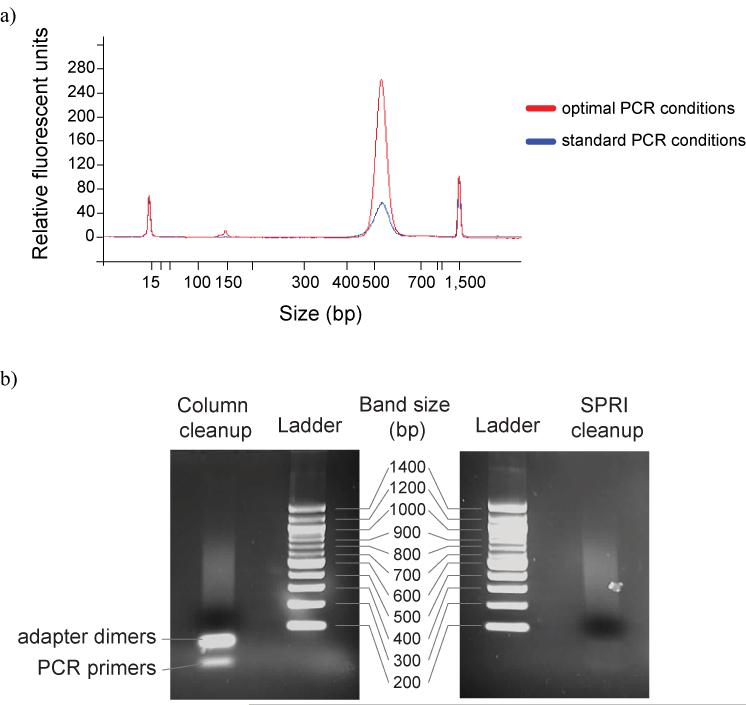
By the use of alternative high fidelity polymerases in a more optimized reaction, we have found it possible to increase the yield of the enrichment PCR reaction five- to tenfold (Supplementary Protocol 7 online; Fig. 4a), which allows fewer cycles of amplification to be performed.
Figure 4. PCR.
a) A ∼200bp fragment library was prepared, and 10ng was amplified for 18 cycles using standard Illumina conditions, and with more optimal PCR conditions.
A comparison of methods of PCR amplicon purification. We prepared a paired end library with phiX DNA using conditions that would promote the formation of adapter dimers and unextended PCR primers. After PCR we divided the library into two: half was purified following the standard Illumina protocol, through a Qiaquick PCR cleanup column, whereas the other was purified using SPRI technology. Each was then run on an agarose gel alongside a 100bp ladder to view the DNA species that remained.
PCR cleanup
Surplus PCR primers may interfere with quantification and will compete with the amplicon for hybridisation to the flowcell surface. Consequently, it is necessary to remove surplus oligos after amplification. We have found that solid-phase reversible immobilization (SPRI) technology 9 is capable of removing a higher proportion of primers and adapter dimers than spin columns, while producing a comparable yield of amplicon DNA, and allows elution in a wider variety of buffers (Supplementary Protocol 8 online; Fig. 4b).
Sequencing without PCR
We have found that it is unnecessary to retain the PCR step to enrich for properly ligated fragments, so long as only those fragments with an adapter at either end can be quantified, as only they will yield clusters capable of being sequenced. This can be done by quantitative PCR, discussed below. Thus we can eliminate the PCR step entirely, simply by ligating on appropriate adapters after A-tailing (Supplementary Protocol 9 online). For this purpose we use HPLC-purified, partially non-complementary oligos with a phosphorothioate linkage between the two bases at the 3′ end of one strand. From a starting amount of 5μg DNA (and fractionation by AFA) we can obtain sufficient paired end DNA for > 400 lanes of high density clusters, or 100 lanes if nebulisation is used to fragment the DNA. The obvious benefits of this are that PCR duplicates are absent: the observed duplication rate in mapped gorilla sequences prepared without PCR was approximately 0.5%. This frequency is caused by noise in the cluster detection and sequence analysis software.
Direct sequencing of short amplicons
To avoid unnecessary PCR amplification steps, which would potentially exacerbate biases, we can perform extremely deep sequencing of short amplicons using locus-specific primers that possess tails that are capable of hybridisation to the oligos tethered to the flowcell surface. The tailless forward and reverse oligos are then used as primers in the sequencing steps (Supplementary Protocol 10 online).
Quantification
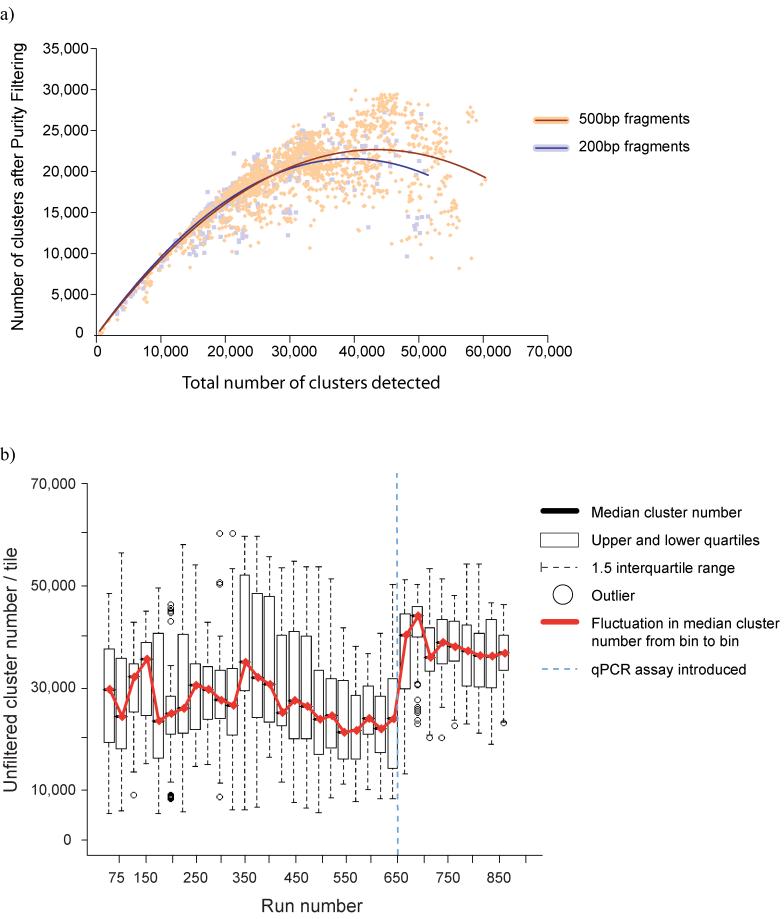
At close to neutral pH, the concentration of DNA going onto the flowcell governs the number of clusters produced. Thus, for different fragment sizes undergoing a given number of cycles of cluster amplification, there is an optimal concentration range of DNA that will yield clusters in the optimal density range, enabling the maximum amount of data to be obtained. For fragments with a mean insert size of 500bp or lower we aim for 40-44,000 clusters per imaged area (= tile) on the Genome Analyzer model 1, giving an average of 20,000 -25,000 filtered clusters per tile, equating to 2.0 - 2.4Gb per single end run (150-170,000 clusters per tile for the Genome Analyzer model 2; Fig. 5a).
Figure 5. Quantification.
a) Cluster throughput as a function of total clusters for 200 and 500bp inserts. The 500bp inserts underwent fewer cycles of cluster amplification (28, compared to 35 for the 200bp libraries), resulting in smaller clusters, and so a cluster density of 40-44k / tile (GA1) will produce the maximum yield from either insert size. b) Standardisation of cluster density with qPCR quantification. Runs were grouped into 25-run bins and a boxplot plotted. After some initial problems with degradation of standards, cluster number has levelled out at ∼35-40k / tile.
Overestimation of DNA concentration results in too few clusters, which may make the flowcell uneconomical to sequence. Underestimation results in too high a cluster density, which can greatly reduce the amount of data obtained, due to cluster overlap. Quantification of DNA prior to sequencing is thus one of the key factors in the process.
Electrophoresis
We found the accuracy of spectrophotometry to be inadequate for quantification: cluster density based on this method tended to be inconsistent, but typically five- to tenfold lower than anticipated, presumably because spectrophotometry measures not only the intended amplicon but also adapter dimers and unextended primers, with no way of distinguishing between them, and also struggles to measure low DNA concentrations accurately. By quantifying libraries electrophoretically, with an Agilent Bioanalyzer, we have been able to achieve a much more consistent cluster density. Additionally, because electrophoresis is able to distinguish between DNA species on the basis of size, it provides a way to check the quality of the library preparation. However, for a small proportion of libraries, we obtained far higher cluster densities, and consequently far less useful data, than anticipated. We assume that this is a result of single stranded DNA generated in the PCR that cannot be easily quantified when mixed with double stranded DNA.
Quantitative PCR (qPCR)
This led us to develop a qPCR quantification assay (for discussion see 10), because such an approach should be capable of detecting and quantifying all amplifiable molecules. We designed amplification primers and a dual-labeled probe to target the Illumina paired end adapter sequences (Supplementary Protocol 11 online). We quantify unknown libraries against standard libraries that have been sequenced previously, and for which we know the accurate cluster number, and how this relates to the Agilent concentration of that library. Because amplification in the qPCR with these primers is not perfectly efficient, we use 3 dilutions of standard libraries (100, 10 and 1pM), and dilute the unknown library to 10pM, based on the Agilent concentration. With this assay, we take the Agilent concentration values to be arbitrary, allowing us to dilute unknowns to a concentration that lies within the 100-1pM range, but Agilent values also provide a useful double-check. We have found that cluster density can be predicted reliably in this way (Fig. 5b).
We have found that the ability to quantify DNA in the picomolar concentration range also opens up the opportunity for sequencing much lower DNA concentrations than those permitted by the standard protocol, such as unamplified array eluates from a sequence capture experiment 5,6.
Denaturation 11
Being single stranded, array eluates require no particular steps to denature the DNA prior to sequencing. However, for low concentrations (< 1nM) of double stranded DNA it is more problematic: denaturation by heating has the potential both to damage the DNA and to introduce anti-GC bias 12.
Modified hybridisation buffers
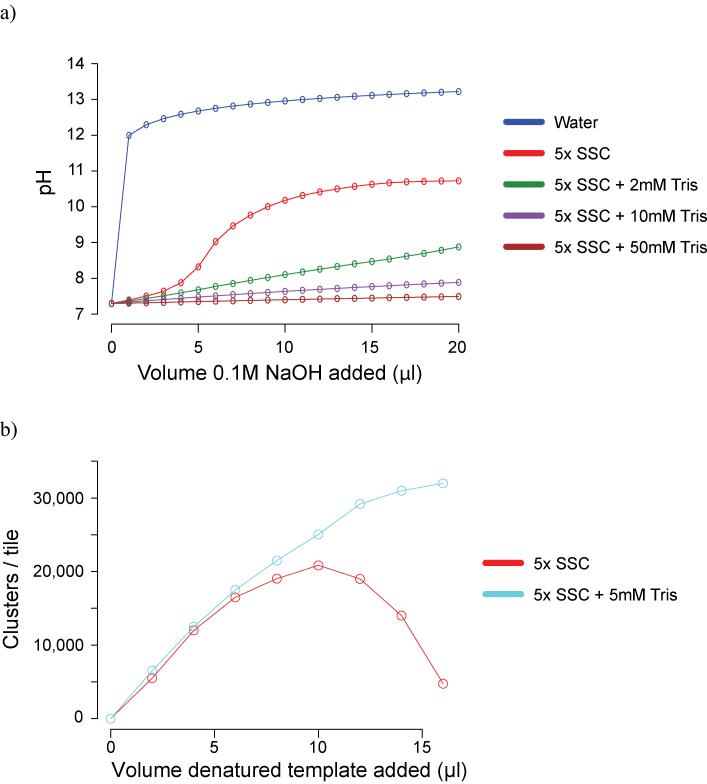
For all denaturation we prefer the use of 0.1M NaOH to heating, though for sub-nanomolar libraries this requires an alternative hybridisation buffer to be used (Supplementary Protocol 12 online). We have found the addition of Tris to the standard Illumina Hybridisation Buffer to be beneficial to the robustness of the initial hybridisation of DNA to the flowcell for all libraries, because it can counteract pipetting errors during the denaturation stage that would otherwise raise the pH to a level that would prevent efficient hybridisation (Fig. 6a and b). Additionally, diluting the supplied 2M NaOH and adding a greater volume to the 20ul denaturation reaction helps to reduce fluctuation in cluster number due to pipetting errors (Supplementary Protocol 12 online).
Figure 6. Denaturation.
a) pH titration of hybridisation buffers. Following denaturation, the concentration of NaOH in DNA templates is 0.1M NaOH. Adding more than 8μl of this denatured template to the 1ml of Hybridisation Buffer (5x SSC, 0.1% Tween-20), prior to loading DNA onto the flowcell, increases the pH to above 10. This prevents efficient hybridisation, and thus the cluster density falls. The addition of Tris-HCl pH7.3 to the supplied bottles of Hybridisation Buffer dramatically increases buffering capacity, making template hybridisation more robust.
b) the addition of 5mM Tris-HCl pH 7.3 to Illumina Hybridisation Buffer allows a greater volume of denatured template to be added before high pH prevents effective annealing of templates to the oligos on the flowcell surface. This increases the robustness of cluster generation, by counteracting pipetting errors in the denaturation step.
Amplification QC
Following cluster amplification, DNA on the flowcell is double stranded, which allows clusters to be stained by an intercalating dye and detected on a fluorescence microscope (Supplementary Protocol 13 online). This is a valuable QC step, that we use for all flowcells prior to linearization and blocking, to confirm that the cluster density is appropriate. We generally do not progress flowcells that have too high or too low a cluster density beyond the amplification stage.
Conclusion
The Genome Analyzer is a powerful sequencing technology, yet still relatively new, and consequently it has not yet reached its full sequencing potential. Here we have described a number of modifications that allow for more efficient library preparation, and which enable a stable workflow in a production environment.
At the Sanger Institute, in addition to a sequencing research and development team we have several teams who are responsible for keeping the production instruments running. A library-making group processes samples, and generates, QCs and quantifies libraries. A production group, working in shifts, prepares and QCs flowcells by SybrGreen staining, prepares reagents for sequencing, and manages washing, priming and loading the instruments seven days per week. Informatics teams are responsible for facilitating sample tracking, for handling the sequence data and for performing pipeline analyses. All steps in the process are recorded using custom-written lab-tracking and run-tracking database software. All Genome Analyzers are networked and the generated image data is continually uploaded to a large compute and disk-storage cluster for image/base-calling analysis, alignment/assembly and other informatics tasks. Images are kept for about 1 month on a disk server, whereas run QC and other run details are stored in a database and short-read sequences are deposited permanently in a large repository. Individual sequencing projects are coordinated and overseen by a team of project managers.
We have recently upgraded all of our Genome Analyzers to the model 2. The wider flowcells used by upgraded machines offer a 40% greater imaging area, with the potential for increased read lengths (>70 bases) of a higher quality (below 1% for 1-50 bases). Combined with improvements to the image analysis software and a faster run time, both of which we are currently testing, a conservative prediction is that by Christmas 2008, our output will reach 6-10 terabases of high-quality sequence per year - equivalent to 180 human genomes at 15-fold coverage, or approximately 200,000 bases per second.
The improved workflow and high yield should maintain the Genome Analyzer as our next-generation sequencing platform of choice for the immediate future. How long this remains true depends upon the performance of existing rival technologies: 454, ABI’s SOLiD, Helicos’ ‘True Single Molecule Sequencing’ (http://www.helicosbio.com) and Dover Systems’ Polonator (http://www.polonator.org), and those that are on the horizon, such as nanopore technologies, for example Oxford Nanopore Technologies (http://www.nanoporetech.com) and the Harvard Nanopore Group (http://golgi.harvard.edu/branton/index.htm), and Pacific Biosciences’ Single Molecule Real Time technology (http://www.pacificbiosciences.com), which promise to bring us closer to the eagerly anticipated $1,000 genome.
Supplementary Material
Supplementary Table 1: Summary table of modifications and improvements
Supplementary Protocol 1: Adaptive Focused Acoustics
Supplementary Protocol 2: Paired End oligos
Supplementary Protocol 3: Gel extraction / Paired end size selection
Supplementary Protocol 4: Ligation
Supplementary Protocol 5: Double size selection
Supplementary Protocol 6: Template quantity
Supplementary Protocol 7: PCR yield
Supplementary Protocol 8: PCR cleanup
Supplementary Protocol 9: Sequencing without PCR
Supplementary Protocol 10: Direct sequencing of short amplicons
Supplementary Protocol 11: Quantitative PCR
Supplementary Protocol 12: Modified hybridisation buffers
Supplementary Protocol 13: Amplification QC
Acknowledgements
We would like to thank all the staff at Illumina for their support, particularly Tobias Ost, Mark Gibbs, Jonathan Smith, Niall Gormley, Vince Smith and Kevin Hall. Thanks also to Clive Brown, Andrew Brown, Roger Pettett, Tom Skelly, Nava Whiteford, Lira Mamanova, Liz Sheridan and Liz Huckle for helpful discussions and assistance.
References
- 1.Bentley DR. Whole-genome re-sequencing. Curr Opin Genet Dev. 2006;16:545–552. doi: 10.1016/j.gde.2006.10.009. [DOI] [PubMed] [Google Scholar]
- 2.Mardis ER. The impact of next-generation sequencing technology on genetics. Trends Genet. 2008;24:133–141. doi: 10.1016/j.tig.2007.12.007. [DOI] [PubMed] [Google Scholar]
- 3.Smith DR, et al. Rapid whole-genome mutational profiling using next-generation sequencing technologies. Genome Res. 2008 doi: 10.1101/gr.077776.108. [DOI] [PMC free article] [PubMed] [Google Scholar]
- 4.Surzycki S. Basic Techniques in Molecular Biology. Springer-Verlag; Berlin: 2000. pp. 377–380. [Google Scholar]
- 5.Albert TJ, et al. Direct selection of human genomic loci by microarray hybridization. Nat Methods. 2007;4:903–905. doi: 10.1038/nmeth1111. [DOI] [PubMed] [Google Scholar]
- 6.Hodges E, et al. Genome-wide in situ exon capture for selective resequencing. Nat Genet. 2007;39:1522–1527. doi: 10.1038/ng.2007.42. [DOI] [PubMed] [Google Scholar]
- 7.Sambrook J, Fritsch E, Maniatis T. Molecular Cloning: A Laboratory Manual. Cold Spring Harbor Laboratory Press; 1989. [Google Scholar]
- 8.Riley J, et al. A novel, rapid method for the isolation of terminal sequences from yeast artificial chromosome (YAC) clones. Nucleic Acids Res. 1990;18:2887–2890. doi: 10.1093/nar/18.10.2887. [DOI] [PMC free article] [PubMed] [Google Scholar]
- 9.Hawkins TL, O’Connor-Morin T, Roy A, Santillan C. DNA purification and isolation using a solid-phase. Nucleic Acids Res. 1994;22:4543–4544. doi: 10.1093/nar/22.21.4543. [DOI] [PMC free article] [PubMed] [Google Scholar]
- 10.Meyer M, et al. From micrograms to picograms: quantitative PCR reduces the material demands of high-throughput sequencing. Nucleic Acids Res. 2008;36:e5. doi: 10.1093/nar/gkm1095. [DOI] [PMC free article] [PubMed] [Google Scholar]
- 11.Thomas R. The denaturation of DNA. Gene. 1993;135:77–79. doi: 10.1016/0378-1119(93)90051-4. [DOI] [PubMed] [Google Scholar]
- 12.Mandel M, Marmur J. Use of ultraviolet absorbance-temperature profile for determining the guanine plus cytosine content of DNA. Methods in Enzymology. 1968;12:195–206. [Google Scholar]
Associated Data
This section collects any data citations, data availability statements, or supplementary materials included in this article.


