

Abstract
The initial results from clinical trials investigating the utility of Acoustic Radiation Force Impulse(ARFI) imaging for use with radiofrequency ablation (RFA) procedures in the liver are presented. To date, data have been collected from 6 RFA procedures in 5 unique patients. Large displacement contrast was observed in ARFI images of both pre-ablation malignancies (mean 7.5 dB, range 5.7 – 11.9 dB) and post-ablation thermal lesions (mean 6.2 dB, range 5.1 – 7.5 dB). In general, ARFI images provided superior boundary definition of structures relative to the use of conventional sonography alone. Although further investigations are required, initial results are encouraging and demonstrate the clinical promise of the ARFI method for use in many stages of RFA procedures.
Keywords: Ultrasound, Ultrasonic Imaging, Acoustic Radiation Force, Abdominal Imaging, Elastography, Radiofrequency Ablation, Clinical Trial
Introduction
Radiofrequency ablation (RFA) is a minimally-invasive treatment option for malignancies located in liver (Livraghi et al, 2000; Curley, 2003), kidney (Pavlovich et al, 2002; Mayo-Smith et al, 2003), lung (Dupuy et al, 2000), bone (Woertler et al, 2001), breast (Jeffrey et al, 1999), prostate (Beerlage et al, 2000), and other tissues. RFA uses radiofrequency energy delivered via inserted electrodes to induce localized temperature increases in and around target malignancies. These elevated tissue temperatures lead to coagulative necrosis and tumor destruction (Dodd et al, 2000). Benefits of RFA for treatment of liver tumors include suitability in patients not eligible for other curative treatments, short hospital stay requirements, and reduced cost and complications relative to other treatment options (Livraghi et al, 2000, 2001).
In liver tissues, ablation electrodes used to treat tumors are commonly inserted percutaneously into target malignancies under ultrasound (US), CT (with or without fluoroscopy), or MR guidance (Rose et al, 2001; Antoch et al, 2002; Kelekis et al, 2003; Mayo-Smith et al, 2003; Xu et al, 2003). Given its low cost, widespread availability, and real-time capabilities, US is the preferred mechanism for guiding electrode insertion at many institutions. However, many patients present with masses that exhibit low echo contrast and are difficult to visualize with conventional sonography. For these cases more complicated mechanisms of insertion guidance are necessary, markedly increasing the complexity and the time and financial requirements of the procedure (Sheafor et al, 1998, 2000).
Although often a sensible option for guiding electrode positioning, US is notoriously unreliable for intra-procedure monitoring of developing thermal lesions (Malcolm and Ter Haar, 1996; Lorentzen et al, 1997; Krouskop et al, 1998; Gertner et al, 1998; Righetti et al, 1999; Cha et al, 2000). Although a hyperechoic gas bubble cloud typically forms in the treatment region, the size and location of this bubble cloud is generally not well correlated with the extent of necrotic tissue (Solbiati et al, 1999; Raman et al, 2000; Leyendecker et al, 2002).
Given inconveniences (ex. high costs, requirement of specialized ablation tools, radiation exposure concerns) associated with CT and MR imaging for this purpose, real-time ablation monitoring with these methods is rare (Oudkerk et al, 2002; Kelekis et al, 2003; Lewin et al, 2004). As a consequence of the lack of suitable mechanisms for intra-procedure guidance, the success of many procedures remains uncertain following treatment. This is particularly problematic given inconsistencies in induced thermal lesion volume, even when identical ablation equipment and treatment protocols are utilized (Montgomery et al, 2004).
At many institutions MR and CT are considered ‘gold standard’ methods for post-procedure assessment of procedure success. Though MR and CT are effective for this purpose, equally suitable alternatives with improved cost-efficiency and availability would prove advantageous. Current research is investigating the utility of positron emission tomography (PET) (Anderson et al, 2003; Donckier et al, 2003; Veit et al, 2006) and contrast-enhanced US (Choi et al, 2003; Solbiati et al, 2004; Vilana et al, 2006; Minami et al, 2007) as alternative mechanisms for follow-up assessment of RFA procedures. Each of these areas appears promising, though both methods are in their infancy and are not without limitations.
Given previous demonstrations of mechanical (i.e., stiffness) contrast of both abdominal tumors (Yeh et al, 2002; Fahey et al, in review) and thermal lesions created with RFA (Bharat et al, 2005), methods of imaging tissue elasticity may hold promise for guiding and assessing ablation procedures. Elasticity imaging can be implemented using a variety of techniques, most of which have been covered in relevant review articles (Gao et al, 1996; Greenleaf et al, 2003; Hall, 2003). Elastography methods using diaphragmatic (Varghese and Shi, 2004) or electrode-driven (Jiang et al, 2007) stimuli have shown promise for use with RFA, although in vivo investigations have been limited and restricted to animal models. Acoustic Radiation Force Impulse (ARFI) imaging is a method of elasticity imaging that uses impulsive radiation force to remotely excite tissues. The feasibility of guiding RFA with the ARFI method has previously been established in vivo using an ovine model (Fahey et al, 2006). Additionally, initial results from clinical trials have established the feasibility of in vivo visualization of both primary and secondary liver tumors in human subjects (Fahey et al, in review). During clinical imaging, tumors were visualized with larger displacement contrast in ARFI images relative to echo contrast found in US images.
In the current study, we present our initial results from clinical trials focused upon guiding and assessing RFA with ARFI imaging. We hypothesize that ARFI imaging may be useful during several stages of RFA procedures, including pre-procedure planning, electrode insertion, intra-procedure monitoring, and post-procedure outcome assessment. ARFI imaging is implemented entirely on a modified diagnostic scanner, allowing for combined sonography/ARFI imaging. Combined sonography/ARFI is a straightforward imaging protocol that allows for the strengths of both modalities to be used in a highly complementary manner. Thus, combined sonography/ARFI imaging may provide additional relevant information during RFA procedures without sacrificing the cost, convenience, and portability benefits of conventional US monitoring.
Background
Acoustic radiation force is generated as acoustic waves propagate through dissipative media. As energy from the incident wave is absorbed or reflected, momentum is transferred from the wave to the medium and a body force is created in the direction of the energy density gradient (Nyborg, 1965; Torr, 1984). In soft tissue (a primarily absorbing medium), the applied radiation force and the induced tissue displacement is in the direction of wave propagation. Under plane wave assumptions, the force created by the ultrasound beam can be described locally by:
| (1) |
where α describes acoustic absorption in tissue, I is the time-averaged local acoustic beam intensity, and c is the speed of sound in tissue. The magnitude of F is proportional to α, indicating a dependence on both the intrinsic material properties of the target media and the transmit frequency utilized.
ARFI imaging is an elasticity imaging method that uses acoustic radiation force to interrogate the mechanical properties of soft tissue. Impulsive radiation force is used to excite tissue and the ensuing tissue dynamics are monitored with standard diagnostic ultrasound pulses. Tissue displacement/recovery behavior is tracked in regions of interest by applying correlation-based or Doppler processing algorithms to raw or demodulated ultrasonic radiofrequency data (Kasai et al, 1985; Trahey et al, 1987; O’Donnell et al, 1994). In most applications, the tissue response is only monitored in the direction of beam propagation. Characteristics of the tissue response (such as displacement magnitude and rate of recovery) are used to garner insight into local tissue mechanical properties. For additional background information related to acoustic radiation force and ARFI imaging, the reader is referred to previous reports (Nightingale et al, 2002; Fahey et al, 2005b).
Methods
Patient Population and Imaging Protocol
To date, 5 patients receiving RFA for liver malignancies have been recruited into an ongoing study approved by and conducted in full accordance with the guidelines established by the Duke University Medical Center (DUMC) Institutional Review Board. The subject population included 3 women (59, 66, and 83 years old) and 2 men (46 and 66 years old). Six malignancies have been treated and imaged in these 5 patients. RFA treatments targeted both primary (n = 1) and secondary (n = 5) liver tumors. The primary tumor was a hepatocellular carcinoma (HCC). Metastatic tumors originated from primary neuroendocrine, adrenal cortical (n = 2), melanoma, and renal cell tumors. Images were acquired before/during RFA treatment (n = 5) and during follow-up visits (n = 3) occurring 1 – 6 months post-procedure. For two patients, complete data are available from all stages of the treatment process. For the remaining patients, data from portions of the treatment process are either unavailable or pending. Target masses were located at depths ranging from 3 – 9 cm. Written consent was obtained from all patients prior to their inclusion in the study.
All ablation procedures were conducted using a Valleylab Cool-tip™ RF ablation system and switching controller (Valleylab/Tyco Healthcare Group, Boulder, CO). Ablation electrodes utilized included 10 cm three-prong Cool-tip electrode clusters with 2.5 cm exposures and 15 cm Cool-tip switching controller electrode kits (contains 3 single prong electrodes) with 3 cm exposures. The ablation electrode utilized was selected by the interventionalist on a patient-by-patient basis. RF energy delivery lasted 12 – 16 min. In one patient, following initial treatment the electrode was repositioned and a second, identical ablation was performed.
Experimental data were acquired using a Siemens SONOLINE Antares™ scanner (Siemens Medical Solutions USA, Inc., Ultrasound Division, Issaquah, WA) that has been modified to allow for custom beam sequencing and access to raw radiofrequency (RF) data. A Siemens CH4-1 curvilinear transducer array operating at 2.2 MHz was used during data acquisition. Both B-mode ultrasound and ARFI images were acquired of regions of interest. Tissue tracking during ARFI imaging was accomplished using either conventional (1-1) or 4-1 parallel receive tracking methods (Fahey et al, 2006; Dahl et al, 2007). The primary difference between these two methods of acquisition is related to the length of data collection, and choice of method does not impact the intra-patient comparison of results when imaging liver tissues (Fahey et al, 2006). All image data were collected during a patient breath-hold (usually a held inspiration). For pre- and intra-procedural monitoring, ECG-triggered data acquisition was not utilized because the required connections compromised patient access. During follow-up imaging, ECG-gating was utilized during data acquisition to minimize cardiovascular-related tissue motion in regions of interest (Fahey et al, in press). For these imaging sessions, data acquisition commenced 350 ms following the detection of the QRS complex, a delay empirically determined by the authors to be suitable for minimizing physiological motion in most segments of the liver.
B-mode and ARFI images were analyzed both qualitatively and quantitatively. Qualitative analyses included comparisons of boundary definition between modalities; quantitative analyses included the calculation of contrast between tumors (or induced thermal lesions) and regional liver parenchyma. Contrast values represent a rough indication of lesion detectability when comparing lesions visualized with the same imaging modality, and are less useful for inter-modality comparisons. Unless otherwise noted, contrast values for B-mode images were calculated after logarithmic compression of envelope-detected data, since log-compressed data are shown on the monitor of virtually all diagnostic scanners. Further comparisons were made using data from CT or MR images acquired as part of the patients’ standard of care. Contrast agents used during CT imaging were iodine-based; contrast agents used during MR imaging were gadolinium-based. When possible, the ARFI imaging plane was chosen to be similar to the cross-sectional plane of these other modalities, although limited acoustic windows and other factors prohibited precise correspondence in several patients.
Image Processing and Visualization
During each clinical imaging session, all ARFI images were processed and displayed in real-time on the monitor of the ultrasound scanner, an adjacent laptop computer, or both (Pinton et al, 2006). Further processing was performed off-line using more robust tracking algorithms and filters. One of two different displacement estimation algorithms was utilized, depending upon the method of data acquisition (conventional or 4-1 parallel receive tracking). Raw RF data stored using conventional acquisition techniques were processed with correlation-based algorithms (kernel length of 1.5 cycles). Demodulated I/Q data stored using 4-1 parallel receive acquisition techniques were processed using modified phase-shift autocorrelation algorithms (Loupas et al, 1995). Following displacement estimation, some images were further processed with time-gain control (TGC) methods (Fahey et al, 2005a) in order to compensate for depth-varying radiation force magnitude that arises because of attenuation and focal effects.
Although tissue dynamics are typically monitored in each excitation region for 4 ms or longer, images in this document show a snapshot of the tissue response at a specific time following the removal of radiation force. The time selected for presentation generally corresponded to the time of peak displacement magnitude in the focal region, and ranged from 0.9 to 1.3 ms. Factors associated with depth of field, transmit frequency, and other system parameters affect available tracking pulse repetition frequencies and prevent precise time registration between images acquired with different system settings.
In ARFI images, bright pixels correspond to regions of relatively large displacement, while dark pixels indicate regions displaced relatively less by applied radiation force. To aid with anatomical registration, ARFI images are superimposed over companion B-mode images. In ARFI images acquired intra-ablation and immediately post-ablation, color versions of this document will contain red pixels. Red pixels in these images indicate regions with noisy displacement estimates due to the presence of gas bubbles. These pixels have been tagged red in an effort to the aid the reader in discriminating between regions of accurate displacement estimation and regions of image noise. Tissue regions containing gas bubbles were identified and tagged using custom processing algorithms that examine the temporal characteristics of the magnitude of estimated displacement. These algorithms identified regions whose displacement-recovery behavior differed grossly from that typically exhibited by soft tissue. Additional criteria from spatially-registered B-mode image data were used to ensure these regions also exhibited sonographic features (ex. local hyperechogenicity) associated with gas bubbles.
In many B-mode and ARFI images, arrows are provided to indicate the boundaries of pre-ablation tumors or post-ablation thermal lesions. In some B-mode and ARFI images, however, some or all lesion boundaries remain ambiguous. In these images, arrows indicating the spatial extent of lesions have not been placed. For lesions with at least moderate boundary uncertainty, we feel it is most appropriate for readers to reach their own conclusions regarding the extent of lesions on an individual basis.
Results
For brevity, this section will focus primarily on results from the two patients where pre-ablation, intra-ablation, and follow-up image data are all available. However, results from all patient data gathered to date are included in tables at the end of this section.
Figure 1 – Figure 4 show imaging results from an 83 year old female being treated for a melanoma metastasis in the right lobe of the liver. During both procedural and follow-up imaging the patient was positioned supine upon either a CT table or examination table. All B-mode and ARFI images were acquired with an intercostal acoustic window and utilized an acoustic focal depth of 8 cm. Conventional (1-1) receive tracking was utilized during both imaging sessions.
Figure 1.


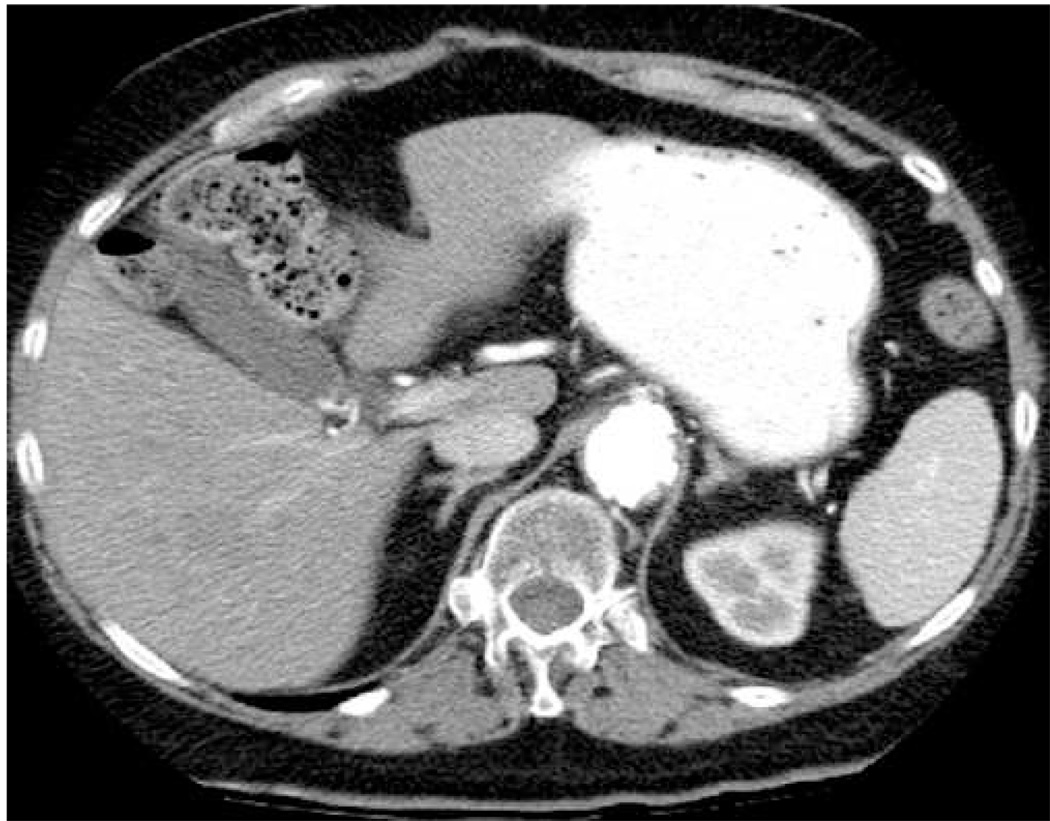
Pre-ablation images of a melanoma metastasis in the liver of an 83 year old female. Shown are B-mode (a), ARFI (b), CT in HAP (c), and CT in PVP (d) images. Arrows in (a) and (b) show the apparent boundaries of the mass. Arrow in (d) indicates mass in CT images. Scale of ARFI image is displacement in µm.
Figure 4.


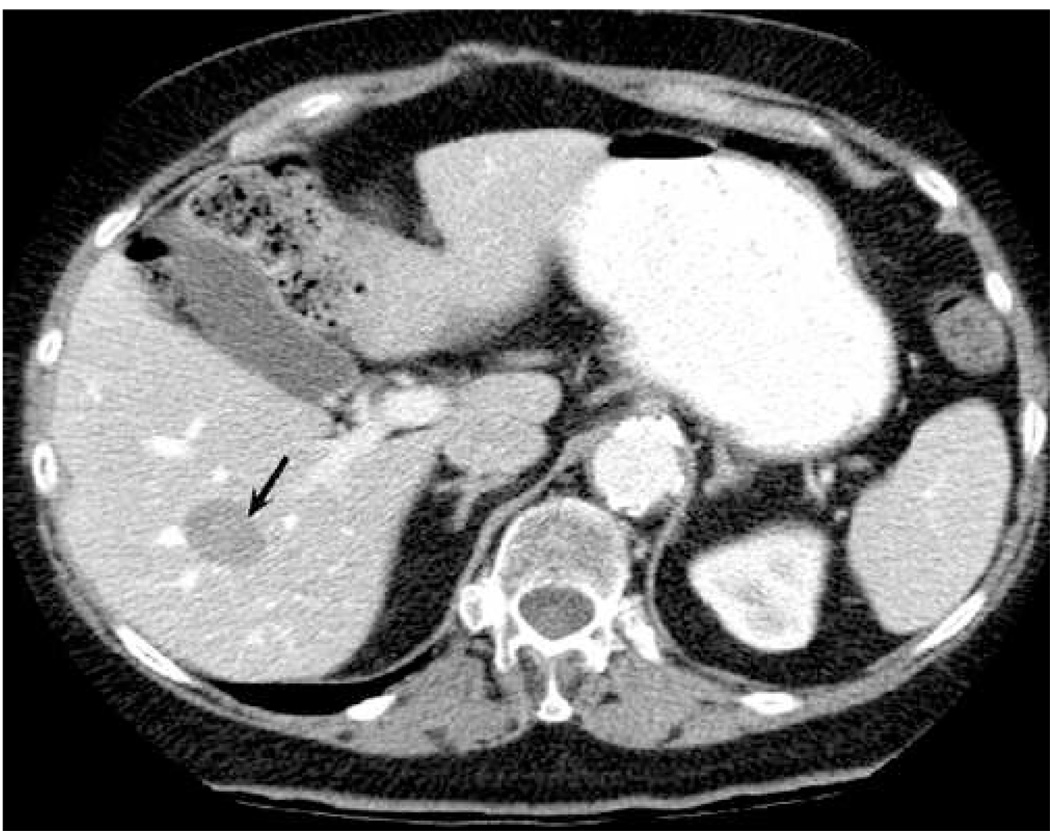
Follow-up images of a thermal lesion resulting from RFA of a metastatic liver mass. (a) and (b) show B-mode and ARFI images, respectively, acquired 64 days post-ablation. (c) and (d) show CT images in the HAP and PVP phases on enhancement, respectively, acquired 37 days post-ablation. Arrows in (b) show boundaries of the thermal lesion. Scale of ARFI image is displacement in µm. ARFI image in (b) is shown with the same displacement scale as the pre-ablation ARFI image in Fig. 1.
Figure 1 shows pre-ablation images of the target malignancy. The B-mode (a) and ARFI (b) images were acquired immediately prior to insertion of the ablation electrode; the CT images were acquired 64 days prior to RFA. Figure 1(c) shows the CT image acquired during the late hepatic arterial phase (HAP) of contrast enhancement, while (d) shows the CT image acquired during the portal venous phase (PVP) of contrast enhancement. The arrows in (a) and (b) indicate the apparent boundaries of the tumor. The arrow in (d) indicates the location of the tumor in the CT image. Noisy regions near the left side of the ARFI field of view (resulting from poor RF signal associated with shadowing from the ribs) have been cropped from the overlapped image.
Figure 1(a) shows the target malignancy as a hypoechoic mass (contrast of 3.1 dB) centered at a depth of 6.5 cm (indicated by arrows). There is hyperechoic shadowing in distal regions, implying a lower acoustic attenuation in the mass relative to surrounding liver parenchyma. In the ARFI image (b), the mass is visualized as a dark region of low displacement (indicated by solid arrows) at the same depth. Displacement contrast in the ARFI image is 8.2 dB. Examination of the contrast-enhanced CT images (c and d) indicates that the tumor is best visualized during the PVP of enhancement due to relative hypovascularity. Size and shape of the tumor is consistent in B-mode, ARFI, and CT images.
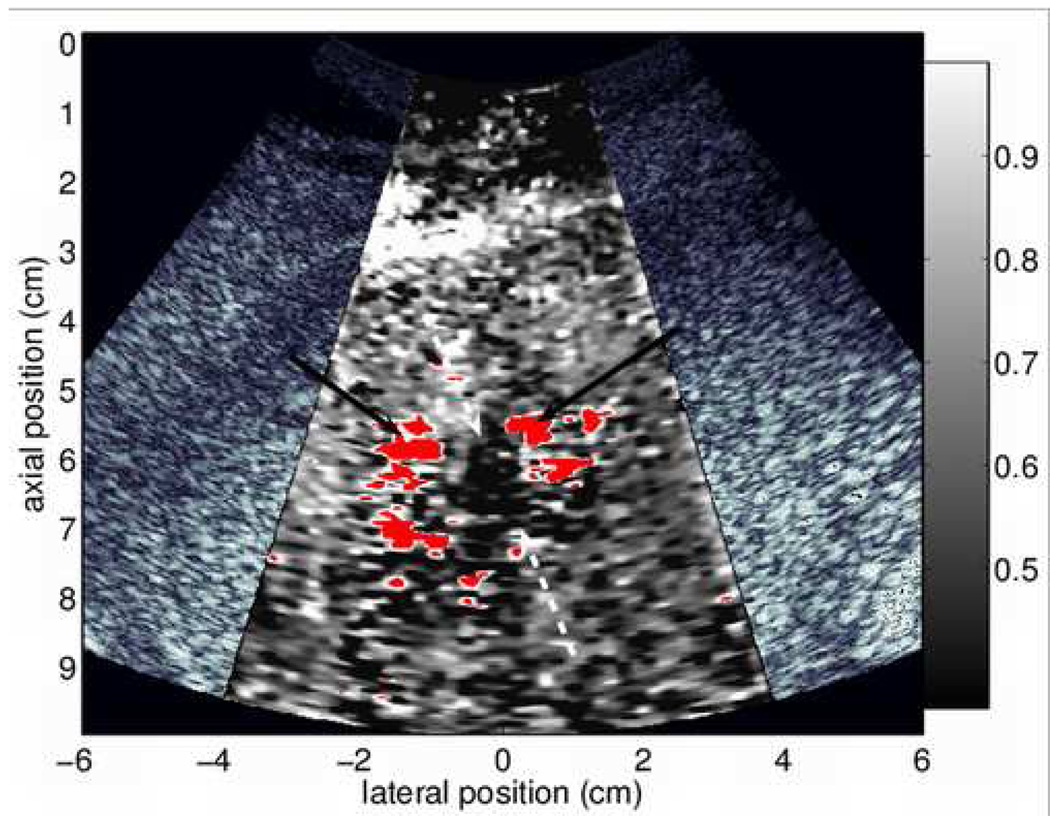
Figure 2 shows intra-ablation B-mode (a) and ARFI (b) images acquired after 8 min of RFA. The imaging plane is parallel to the plane containing the ablation electrode, but shifted slightly in elevation such that vibrations from the electrode (a consequence of the pump system used to cool the electrode tips) will not create motion artifacts in the ARFI image. In the B-mode image, portions of a gas bubble cloud created during the treatment are visible (broken arrow). Untreated portions of the tumor are also visible, indicated by the hypoechoic region in the center of the image (indicated by solid arrows). The matched ARFI image is shown in (b). As in the pre-procedure image (Fig. 1(b)), non-tumorous liver parenchyma within the focal region is displaced relatively uniformly (about 6 µm). The untreated portion of the target malignancy is seen as the dark region of low displacement (indicated by solid arrows) centered at a depth of about 6.5 cm. Both the B-mode and ARFI images in Fig. 2 suggest that, after 8 min of ablation, a large section of the target tumor has not been treated effectively.
Figure 2.


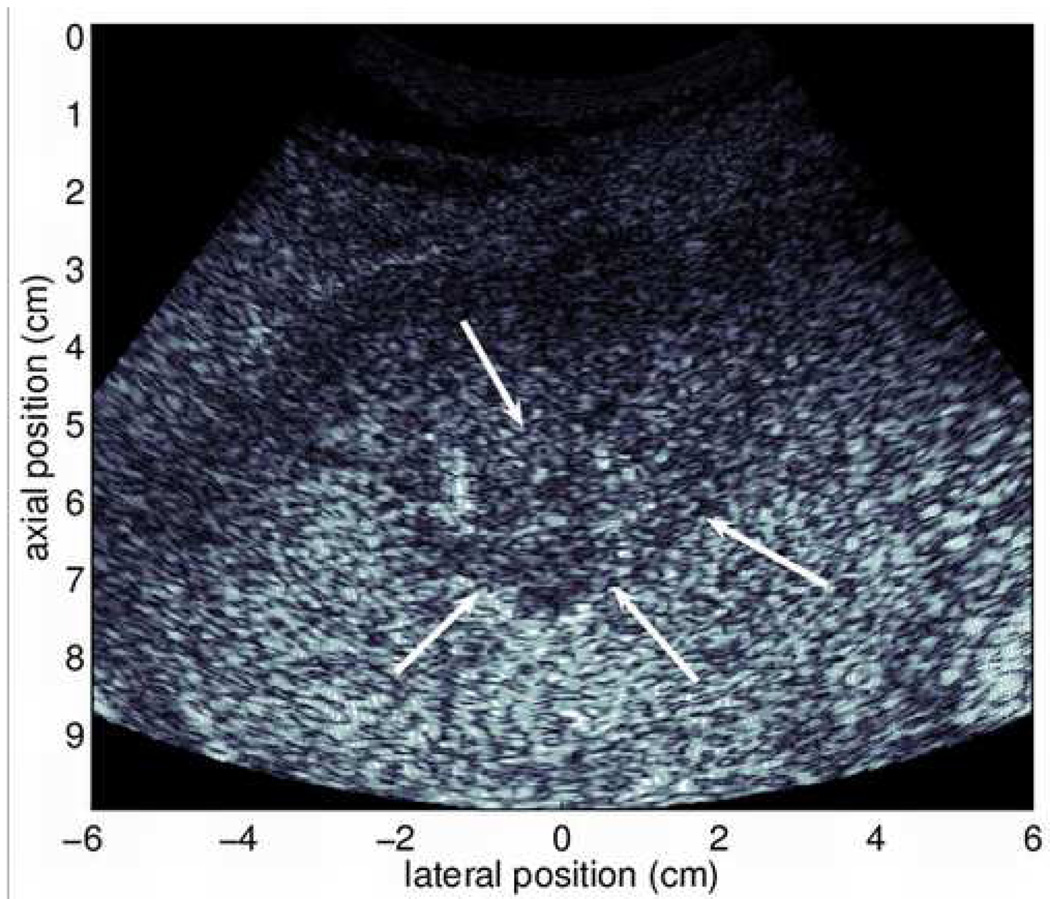
Intra-ablation B-mode (a) and ARFI (b) images acquired 8 min into ablation therapy. Solid arrows in (a) outline untreated portion of metastasis, broken arrow refers to a portion of the bubble cloud. Black arrows in (b) outline the untreated metastasis, white arrow points to noisy region with gas bubbles. In color versions of the document, red regions in (b) indicate regions of unreliable displacement estimates due to gas bubbles in the field of view. Scale of ARFI images is displacement in µm.
The white arrow in Fig. 2(b) indicates a noisy region in the ARFI image that corresponds spatially with the bubble cloud in the companion B-mode image (a). As noted in previous reports (Fahey et al, 2006), gas bubbles at and around the ablation site lead to unreliable displacement estimates and noisy regions of large displacement variance in ARFI images. These regions have been tagged with red pixels to help distinguish image noise from accurate displacement data. In this example, gas bubbles do not significantly degrade ARFI image quality in most regions.
Following completion of the initial 12 minute RFA treatment, indications on B-mode imaging continued to suggest incomplete treatment, and the interventionalist opted to perform a second 12 minute RFA procedure with the electrode positioned slightly more superficial. During this second ablation, a significantly larger bubble cloud formed in the treated region. Figure 3 shows B-mode (a) and ARFI (b) images of the treated region acquired 9 min following the completion of this second ablation procedure. The ARFI image shown in (b) has been processed with TGC methods, and is shown on a scale of relative displacement.
Figure 3.
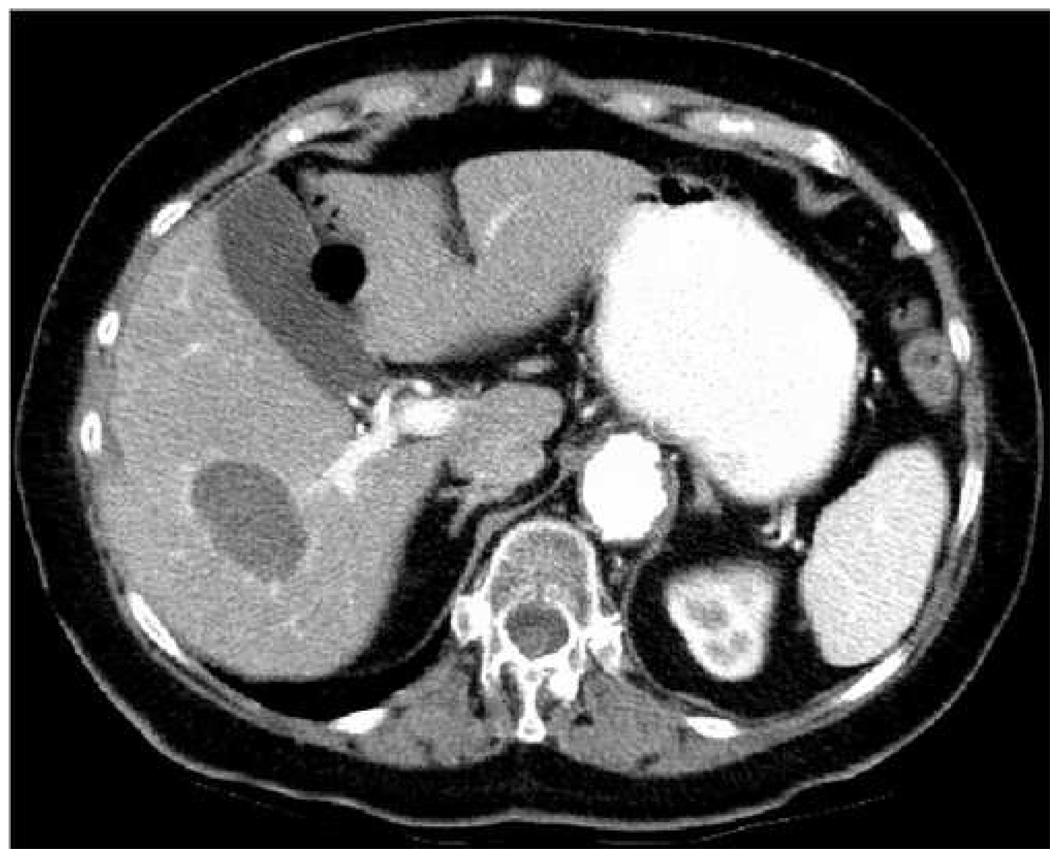
B-mode (a) and ARFI (b) images acquired 9 min following the completion of RFA. In color versions of the document, red regions in (b) indicate regions of unreliable displacement estimates due to gas bubbles in the field of view. Arrows in (a) show boundaries of the thermal lesion. Solid arrows in (b) refer to noisy regions associated with gas bubbles, broken arrows point to edges of thermal lesion. The ARFI image has been processed with TGC methods and normalized, and is shown on a scale of relative displacement.
Nine minutes following ablation, enough gas bubbles have subsided that it is possible to visualize a portion of the induced thermal lesion with B-mode sonography. The thermal lesion appears as a hypoechoic structure nearly centered in the US image (Fig. 3(a)). The apparent boundaries of the thermal lesion are indicated by the arrows. In the ARFI image (b), several noisy regions of unreliable displacement data are present (red pixels, also denoted by solid arrows) that correspond spatially with the hyperechoic patches of vapor in the B-mode image. Although many regions of the image are of questionable diagnostic value, a region of low displacement (indicated by broken arrows) is also visible, likely indicating a portion of the thermal lesion. At this point in time following ablation, residual gas bubbles that persist obscure some regions of interest in the ARFI image, dramatically reducing its usefulness for detecting residual tumor.
Figure 4 shows follow-up images of the thermal lesion created by the RFA treatment. (a) and (b) show B-mode and ARFI images, respectively, acquired 64 days post-ablation. (c) and (d) show CT images in the HAP and PVP phases of enhancement, respectively, acquired 37 days post-ablation. Arrows in (b) show the boundaries of the thermal lesion. To ease comparison, the ARFI image in (b) is shown with the same displacement scale as the pre-ablation ARFI image in Fig. 1.
The B-mode image (Fig. 4(a)) shows the thermal lesion as a hypoechoic structure spanning a lateral range of roughly −1.5 cm to 3 cm. Boundary definition of the thermal lesion is ambiguous in some regions (particularly the proximal boundary), and contrast (2.3 dB) is reduced relative to that shown in the B-mode image of the tumor acquired pre-treatment (see Fig. 1(a)). Conversely, the thermal lesion is visualized with high contrast (7.5 dB) and clear boundary definition (arrows) in the ARFI image (b). Displacement magnitude induced within the thermal lesion is smaller than that induced in the tumor pre-treatment (see Fig. 1(b)), implying that the thermal lesion is stiffer than the original tumor. The thermal lesion is also well-visualized in both of the CT images (c and d).
Figure 5 – Figure 7 show imaging results from the second patient where complete image data is available. This patient was a 46 year old male being treated for a metastatic adrenal cortical carcinoma in the left hepatic lobe. This patient had previously had a partial liver resection, and had previously been treated with RF ablation for 4 other liver masses and a right adrenal mass. (Six months following the acquisition of follow-up images shown in this document, this patient returned for an additional RFA treatment for a newly-developed liver mass.) During the procedure, the patient was positioned supine with his arms extended above his head. During follow-up imaging, the patient was positioned supine with his arms by his side. All images were acquired with a subcostal acoustic window and utilized a focal depth of 6.5 cm. Parallel receive (4-1) tracking techniques were utilized during data acquisition.
Figure 5.


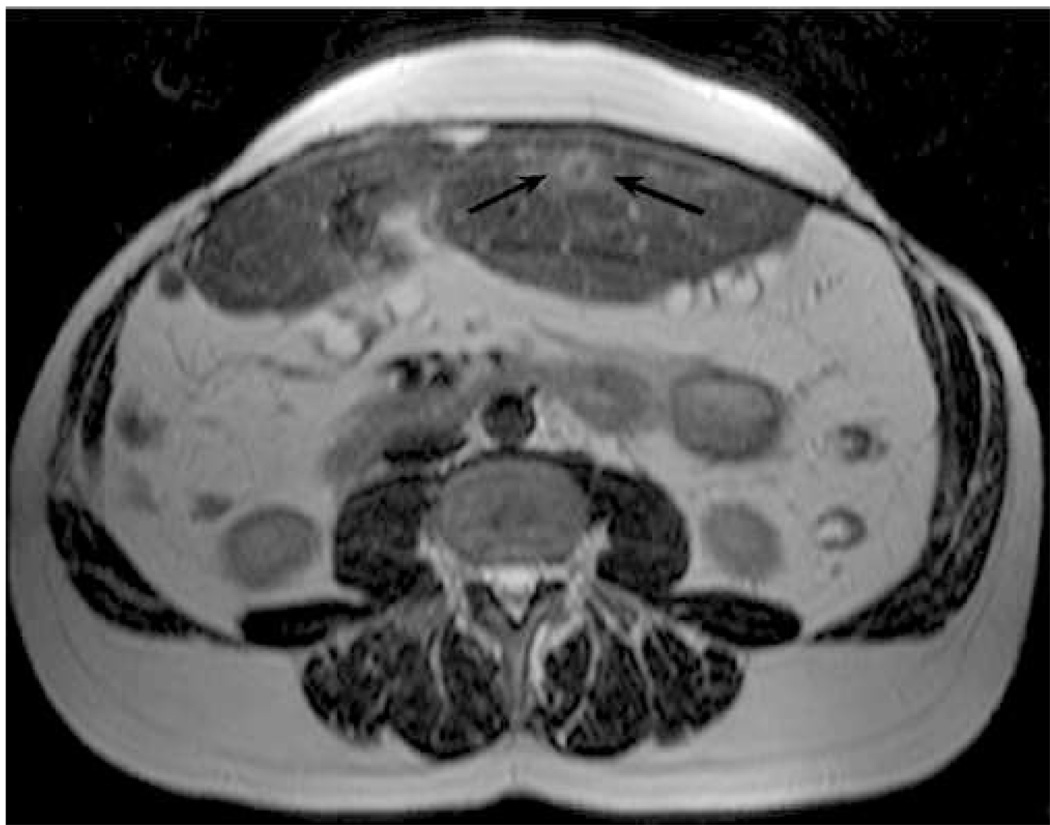

Pre-ablation images of a metastatic mass in the left hepatic lobe of a 46 year old male. Shown are transverse B-mode (a) and ARFI (b) images acquired immediately prior to ablation. Also shown are T2-weighted (c) and T1-weighted post-Gd (d) axial MR images acquired 63 days prior to ablation. Arrows in (a) and (b) indicate the visible boundaries of the tumor. Arrow in (c) points to a thermal lesion from a previous ablation. Arrow in (d) indicates the target tumor. The ARFI image (b) has been normalized and is shown on a scale of relative displacement.
Figure 7.


Follow-up images of a thermal lesion created during RFA. (a) – (d) show B-mode and ARFI images acquired 34 days post-ablation. (e) and (f) show T2-weighted and T1-weighted post-Gd axial MR images, respectively, acquired 34 days post-ablation. (a) and (b) show transverse images, (c) and (d) longitudinal images. Solid arrows in (a) – (d) indicate the apparent boundaries of the thermal lesion; broken arrows in (b) and (c) indicate an abscess. ARFI images have been normalized and are shown on a scale of relative displacement.
Figure 5 shows pre-ablation images of the metastatic mass. Shown are B-mode (a) and ARFI (b) images acquired immediately prior to ablation (after electrode insertion) and T2-weighted (c) and T1-weighted post-Gd (d) axial MR images acquired 63 days prior to ablation. The ARFI image has been normalized to aid comparisons to follow-up images, which were acquired using slightly different system power settings. Arrows in (a) and (b) indicate the visible boundaries of the tumor. The arrow in (d) indicates the tumor being treated; the arrow in (c) points to a thermal lesion from a previous ablation. The B-mode and ARFI images show transverse planes and were acquired with the transducer centered laterally on the patient’s torso and angled slightly cephalad.
In the pre-ablation B-mode image (Fig. 5(a)) the target tumor appears as a slightly hypoechoic structure (contrast 1.2 dB). Many of the tumor boundaries are discernible (arrows), although the posterior boundary remains ambiguous. In the ARFI image (b), the target malignancy is visualized as a dark region of reduced displacement (indicated by arrows). Displacement contrast in the ARFI image is 5.7 dB. Regions of reduced displacement distal to the tumor are believed to result from shadowing due to the presence of the ablation electrode nearby. Interference from the ablation electrode may also contribute to the apparent lack of stiffness homogeneity within the tumor. The tumor is well-visualized in the MR images (particularly the T2-weighted image) shown in (c) and (d). Spatial registration of the tumor and surrounding anatomy appears to be consistent between the B-mode, ARFI, and MR images.
Figure 6 shows transverse B-mode (a) and ARFI (b) images acquired 15 minutes following the completion of RFA, after the ablation electrode had been removed. The imaging plane for these images is similar to that shown in Fig. 5. At this time following ablation, gas bubbles created during the RF treatment had yet to be completely resorbed. Although somewhat difficult to visualize in the frozen B-mode image, the gas bubbles were readily apparent during live sonography. The presence of gas bubbles (indicated by pixels tagged red) in the region of interest leads to noisy displacement estimates in the ARFI image. Gas bubbles located in the imaging plane also distort the uniformity of the applied radiation force field in deeper regions.
Figure 6.


Transverse B-mode (a) and ARFI (b) images acquired 15 minutes following RFA of a metastatic tumor. The ARFI image has been normalized and is shown on a scale of relative displacement. Red pixels in the ARFI image correspond to noisy regions of high displacement variance created by gas bubbles in liver tissue.
Figure 7 shows follow-up images acquired of the thermal lesion created during the RFA procedure. All images were acquired 34 days post-ablation. (a) and (b) show transverse B-mode and ARFI images, respectively, while (c) and (d) show longitudinal B-mode and ARFI images, respectively, acquired in approximately the mid-sagittal plane. (e) and (f) show T2-weighted and T1-weighted post-Gd axial MR images, respectively.
Both B-mode images in Fig. 7 show the induced thermal lesion (indicated by solid arrows) as a hypoechoic region, nearly circular in cross-section, with increased echogenicity in its center. Echo contrast between the hypoechoic region of the thermal lesion and surrounding liver parenchyma (calculated from Fig. 7(a)) is 2.0 dB. In the ARFI images, the thermal lesion is visualized as a dark area of low displacement, again nearly circular in cross-section. Displacement contrast (calculated from Fig. 7(b)) of the thermal lesion is 5.1 dB. Induced displacement magnitude is decreased in liver parenchyma posterior to the thermal lesion relative to adjacent regions at the same depth (this is particularly noticeable in (b)). This reduction in displacement magnitude is likely related to increased acoustic attenuation inside the lesion, leading to decreased radiation force magnitude in deeper regions. As indicated by (e) and (f), the thermal lesion is also well-visualized with MR techniques.
All B-mode and ARFI images in Fig. 7 show indications of an abscess that had formed superficial to the thermal lesion (indicated by broken arrows in (b) and (c)). The abscess appears hypoechoic in B-mode images, and as a noisy region of large displacement (due to fluid content in the abscess) in ARFI images. This abscess was aspirated 7 days after follow-up B-mode and ARFI images were acquired. The abscess is also visible in the MR images.
Thus far, results have been presented for two of the RFA treatments included in our study. Table 1 and Table 2 provide image contrast data for all pre-RFA malignancies and post-RFA thermal lesions imaged to date. Values are provided for echo contrast in linear and log-compressed B-mode images and for displacement contrast in linear ARFI images. It is important to note that the contrast values in the tables are intended to provide, for a given modality, relative comparisons of lesion detectability. In particular, these values are provided to illustrate the repeatability of achievable displacement contrast in ARFI images, given that only a subsample of example images are shown in this manuscript. Contrast values are not intended to be compared between modalities, as many factors other than echo brightness (such as structure texture) contribute to lesion detectability in B-mode images. In Table 2, the contrast data associated with Fig. 7 was calculated from the transverse B-mode and ARFI images. As this document reports results from one subset of an ongoing study, portions of the data in Table 1 have been previously reported in a different context (Fahey et al, in review).
Table 1.
Contrast of liver malignancies in B-mode and ARFI images. Values are provided for echo contrast in linear and log-compressed B-mode images and for displacement contrast in linear ARFI images. Contrast values are a rough indicator of lesion detectability for a given imaging modality and are generally not an appropriate metric for inter-modality comparisons.
| Contrast of malignancies, Pre-Ablation | |||
|---|---|---|---|
| Tumor Description | Linear B-mode | Log-compressed B-mode | Linear ARFI |
| Met. - Melanoma (Fig. 1) | 5.1 dB | 3.2 dB | 8.2 dB |
| Met. - Adrenal Cortical (Fig. 5) | 3.7 dB | 1.7 dB | 5.8 dB |
| Primary | 7.1 dB | 4.2 dB | 11.9 dB |
| Met. - Adrenal Cortical | 3.6 dB | 2.1 dB | 5.9 dB |
| Met. - Renal Cell | 2.0 dB | 1.2 dB | 5.7 dB |
Table 2.
Contrast of thermal lesions induced by RFA in liver tissues. Values are provided for echo contrast in linear and log-compressed B-mode images and for displacement contrast in linear ARFI images. Contrast values are a rough indicator of lesion detectability for a given imaging modality and are generally not an appropriate metric for inter-modality comparisons.
As indicated, significant displacement contrast was achieved in ARFI images of each pre-ablation malignancy and post-RFA thermal lesion encountered to date. Mean displacement contrast in ARFI images of pre-ablation malignancies was 7.5 dB (range 5.7 – 11.9 dB). Mean displacement contrast in ARFI images of post-RFA thermal lesions was 6.2 dB (range 5.1 – 7.5 dB). In pre-ablation ARFI images, metastatic masses appear as stiff structures surrounded by more compliant regional liver parenchyma, while primary liver tumors (hepatocellular carcinomas) appear as compliant structures surrounded by relatively stiffer regional liver parenchyma (Yeh et al, 2002; Fahey et al, in review). Thermal lesions appear as very stiff tissue regions surrounded by more compliant regional liver. The high contrast achievable with ARFI images complements the high resolution of tumor boundaries (when visible) in standard B-mode images.
Discussion
In the previous section, we have demonstrated the feasibility of utilizing ARFI imaging to assist with RFA procedures in clinical settings. Large displacement contrast (> 5 dB) has been observed in all pre-RFA liver malignancies and post-RFA thermal lesions encountered to date. In many cases, boundary definition of structures is improved in ARFI images relative to companion B-mode images. Thus, combined sonography/ARFI should allow for improved imaging performance relative to the use of sonography alone. Enhanced tumor/lesion visualization with ARFI imaging may aid in pre-procedure localization and planning, electrode insertion guidance, post-procedure follow-up assessment, and with other purposes.
The real-time nature of combined sonography/ARFI imaging is particularly well-suited for guiding the insertion of ablation electrodes. Several of the cases encountered to date (including that documented in Fig. 5 – Fig. 7) involved nearly iso-echoic target malignancies and required extensive patient exposure to ionizing radiation from CT and CT-based fluoroscopic imaging for proper electrode insertion. For these patients, both the cost and the time required for electrode insertion were increased markedly. With combined sonography/ARFI imaging, the bulk of electrode insertion could be guided with US, with occasional real-time ARFI images available when increased contrast of the tumor was required. This method would likely increase operator confidence in successful probe placement relative to the use of US alone. Although it would be premature to suggest that a combined sonography/ARFI system could replace CT or MR methods for insertion guidance in low contrast masses, use of such a system could potentially reduce the reliance on these more expensive and complicated modalities.
Comparison of pre- and post-treatment ARFI images may provide insight into the success of RFA procedures. For example, the transverse ARFI images in Fig. 5 and Fig. 7 were acquired in nearly identical imaging planes. Comparing the two images, it is clear that the induced thermal lesion is larger in cross-section than the original tumor, implying the procedure was successful. Size comparison of the tumor and thermal lesion in the companion pre- and post-treatment B-mode images is more difficult, partially due to the ambiguity of boundary definition in some portions of the images. Examination of the pre- and post-RFA ARFI images from the other procedure documented (see Fig. 1 and Fig. 4) indicates that in this patient, the width (anterior to posterior) of the thermal lesion is similar to the width of the original tumor. Ideally, the RFA treatment would create a thermal lesion that would not only destroy the target tumor, but also a 7 – 10 mm rim of surrounding non-tumorous liver parenchyma as well (analagous to a tumor-free surgical margin). Comparing the two ARFI images, it is clear that this ‘safety margin’ was not completely achieved during this procedure. Again, it is relatively more difficult to make precise evaluations of relative malignancy/thermal lesion size through comparison of pre- and post-treatment B-mode images. Follow-up CT images acquired as late as 5 months post-procedure do not show indications of local tumor recurrence in this patient.
From the single-frame images shown in this document, follow-up evaluations are perhaps most clear when CT or MR imaging are utilized for assessment. The efficacy of these techniques is related to the high spatial resolution and SNR of the modalities and the ability for precise image plane registration between pre- and post-RFA images. However, these methods typically require contrast agents, do not allow for real-time visualization, and are associated with increased cost and decreased availability relative to the use of sonography. Combined sonography/ARFI imaging allows for cost-efficient real-time assessment of regions of interest with multiple available imaging planes. If combined sonography/ARFI imaging is proven effective for accurate follow-up evaluation of RFA, the capability for real-time, multi-planar assessment coupled with low operating costs may allow it to become a viable alternative to CT and MR methods for this purpose.
At many institutions, sonography is not considered sufficiently sensitive for the detection of small regions of tumor recurrence located at the periphery of induced thermal lesions. While residual tumor often appears on CT as a focal area of enhancement or on MR as hyperintensity on T2-weighted images which enhances post-Gd, limited spatial resolution and poor echo contrast makes small malignant regions difficult to visualize with US. As this writing, it is not yet known whether ARFI imaging is more effective than sonography for detection of small regions of residual tumor. We have yet to recruit a patient into our study where local recurrence was detected with CT or MR methods following RFA. However, stiffness contrast between tumor, regional liver, and thermal lesion is expected in vivo (Yeh et al, 2002; Bharat et al, 2005). The feasibility of detecting residual tumor located between non-treated liver parenchyma and a partially-developed thermal lesion with ARFI imaging has been previously established utilizing a custom tissue-mimicking phantom designed for this purpose (Fahey et al, 2006). Continued clinical efforts are required to evaluate the efficacy of the ARFI method for this application.
Further investigation is required to determine the full potential of ARFI imaging for RFA assessment. Although high quality follow-up images of induced thermal lesions have been acquired in the months following RFA, images acquired in the immediate (within 15 min) post-operative period have been at least partially compromised in quality by the presence of gas bubbles in the treated region. The post-ablation time delay necessary for gas bubbles created during the procedure to be adequately resorbed, thus ensuring reliable high-quality ARFI imaging, has yet to be determined. An animal model presented previously suggests that this time period is less than 70 min (Fahey et al, 2006), although Fig. 6 implies that it is more likely on the order of 25 – 30 min. The ability to scan for residual tumor 30 min post-therapy is certainly less useful than instantaneous feedback, but would still represent a marked acceleration of the detection process relative to other techniques (both established and experimental) known to the authors that are approved for use in the United States.
Gas bubble formation in and around RF ablation sites not only prevents immediate follow-up assessment in many cases, but can also preclude the real-time detection of potential complications related to therapy. It is believed, however, that current ARFI imaging protocols would allow for the radial growth of a thermal lesion to be monitored in real-time in the period of ablation prior to significant bubble formation. Although no clinical data has been collected to date to support this claim, extensive ex vivo testing (Fahey et al, 2006) implies this is the case. Additionally, both our experience and conversations with manufacturers of RF ablation systems (personal communications) indicate that large-scale gas bubble formation is not necessarily required to create thermal lesions of significant volume. Current ablation protocols utilized by many generator systems were designed to purposefully induce gas bubbles in target regions, in part so that an interventionalist could get some degree of feedback that suggested the ablation therapy was working. However, if a reliable real-time mechanism for monitoring RF ablation were available, the creation of bubbles would no longer be necessary to ensure lesion formation in target regions. Ablation protocols could then be modified to avoid excessive gas bubble formation by taking advantage of impedance and temperature feedback from sensors on the electrode tip.
There are several limitations to the results and discussions presented in this preliminary report. The most significant limitation is likely the small patient population included to date. As this writing, we have collected image data from 6 RFA procedures/follow-ups in 5 unique patients. However, complete pre- and post-RFA data is only available from 2 patients. In 2 other patients, complete data is unavailable; in the remaining 2 patients, follow-up imaging with any modality has yet to occur. Given a limited number of imaging opportunities, we have made preliminary conclusions that may not hold true after a more extensive study. For example, displacement contrast in ARFI images has exceeded US echo contrast in every pre-RFA malignancy and post-RFA thermal lesion encountered to date. It is likely that in some masses, US echo contrast will meet or exceed displacement contrast in ARFI images.
It should be noted that all intra-ablation images acquired to date have not utilized ECG-triggering during data acquisition. This decision was made in an effort to avoid complicating the ablation procedure. Typically, there are several anesthesiologists and/or nurses constantly monitoring the patient’s stability under either general anesthesia or conscious sedation. ECG leads connecting the patient to the US scanner would further limit space and maneuverability in a room already crowded with personel and equipment, and re-connecting ECG leads to the patient immediately before each image acquisition would prove cumbersome. To date, severe physiological motion artifacts (those not removable with motion filters (Fahey et al, in press)) in target regions have yet to be encountered. This is likely related to the location of malignancies that were treated, and may not prove to be the situation in the majority of cases. Future efforts will focus on developing a method of integrating ECG-triggering into our imaging protocol without inhibiting patient accessibility.
In summary, we have presented our initial results from clinical trials investigating the utility of combined sonography/ARFI imaging for use with RFA procedures targeting liver masses. Although further investigations are required, initial results are promising and demonstrate the feasibility of the ARFI method for this application. Given its low operating costs, real-time capabilities, widespread availability, and lack of ionizing radiation, combined sonography/ARFI imaging may be a logical choice for guiding and assessing clinical interventions.
Acknowledgments
We thank Siemens Medical Solutions, USA, Ultrasound Division for their system support. We thank the nurses and staff at Duke University Medical Center, especially Mitzi Chambers and Susan Hunter, for their assistance with patient recruitment. This work was supported by NIH grants 1R01-HL-075485, 1R01-EB-002132, and 1R01-CA-114093.
Footnotes
Publisher's Disclaimer: This is a PDF file of an unedited manuscript that has been accepted for publication. As a service to our customers we are providing this early version of the manuscript. The manuscript will undergo copyediting, typesetting, and review of the resulting proof before it is published in its final citable form. Please note that during the production process errors may be discovered which could affect the content, and all legal disclaimers that apply to the journal pertain.
References
- Anderson G, Brinkmann F, Soulen M, Alavi A, Zhuang H. FDG positron emission tomography in the surveillance of hepatic tumors treated with radiofrequency ablation. Clin Nucl Med. 2003 Mar;28(3):192–197. doi: 10.1097/01.RLU.0000053530.95952.FD. [DOI] [PubMed] [Google Scholar]
- Antoch G, Kuehl H, Vogt F, Debatin J, Stattaus J. Value of CT Volume Imaging for Optimal Placement of Radiofrequency Ablation Probes in Liver Lesions. Journal of Vascular and Interventional Radiology. 2002;13(11):1155. doi: 10.1016/s1051-0443(07)61958-7. [DOI] [PubMed] [Google Scholar]
- Beerlage H, Thuroff S, Madersbacher S, Zlotta A, Aus G, de Reijke T, de la Rosette J. Current status of minimally invasive treatment options for localized prostate carcinoma. Eur Urol. 2000;37(1):2–13. doi: 10.1159/000020091. [DOI] [PubMed] [Google Scholar]
- Bharat S, Techavipoo U, Kiss M, Liu W, Varghese T. Monitoring stiffness changes in lesions after radiofrequency ablation at different temperatures and durations of ablation. Ultrasound Med Biol. 2005 Mar;31(3):415–422. doi: 10.1016/j.ultrasmedbio.2004.12.020. [DOI] [PubMed] [Google Scholar]
- Cha C, Lee F, Gurney J, Markhardt B, Warner T, Kelcz F, Mahvi D. CT versus sonography for monitoring radiofrequency ablation in a porcine liver. AJR Am J Roentgenol. 2000 Sep;175(3):705–711. doi: 10.2214/ajr.175.3.1750705. [DOI] [PubMed] [Google Scholar]
- Choi D, Lim H, Lee W, Kim SH, Kim Y, Kim SH, Lim J. Early assessment of the therapeutic response to radio frequency ablation for hepatocellular carcinoma utility of gray scale harmonic ultrasonography with a microbubble contrast agent. J Ultrasound Med. 2003;22:1163–1172. doi: 10.7863/jum.2003.22.11.1163. [DOI] [PubMed] [Google Scholar]
- Curley S. Radiofrequency ablation of malignant liver tumors. Ann Surg Oncol. 2003;10(4):338–347. doi: 10.1245/aso.2003.07.017. [DOI] [PubMed] [Google Scholar]
- Dahl JJ, Pinton GF, Palmeri ML, Trahey GE. A parallel tracking method for acoustic radiation force impulse imaging. IEEE Trans. Ultrason., Ferroelec., Freq. Contr. 2007 Feb;54(2):301–312. doi: 10.1109/tuffc.2007.244. [DOI] [PMC free article] [PubMed] [Google Scholar]
- Dodd G, Soulen M, Kane R, Livraghi T, Lees W, Yamashita Y, Gillams A, Karahan O, Rhim H. Minimally invasive treatment of malignant hepatic tumors: at the threshold of a major breakthrough. Radiographics. 2000 Jan–Feb;20(1):9–27. doi: 10.1148/radiographics.20.1.g00ja019. [DOI] [PubMed] [Google Scholar]
- Donckier V, Van Laethem J, Goldman S, Van Gansbeke D, Feron P, Ickx B, Wikler D, Gelin M. [F-18] fluorodeoxyglucose positron emission tomography as a tool for early recognition of incomplete tumor destruction after radiofrequency ablation for liver metastases. J Surg Oncol. 2003 Dec;84(4):215–223. doi: 10.1002/jso.10314. [DOI] [PubMed] [Google Scholar]
- Dupuy D, Zagoria R, Akerley W, Mayo-Smith W, Kavanagh P, Safran H. Percutaneous radiofrequency ablation of malignancies in the lung. AJR Am J Roentgenol. 2000;174(1):57–59. doi: 10.2214/ajr.174.1.1740057. [DOI] [PubMed] [Google Scholar]
- Fahey B, Hsu S, Wolf P, Nelson R, Trahey G. Liver ablation guidance with acoustic radiation force impulse imaging: Challenges and opportunities. Phys Med Biol. 2006;51:3785–3808. doi: 10.1088/0031-9155/51/15/013. [DOI] [PMC free article] [PubMed] [Google Scholar]
- Fahey B, Nelson R, Hsu S, Dumont D, Bradway D, Trahey G. In vivo visualization of abdominal malignancies with acoustic radiation force elastography. doi: 10.1088/0031-9155/53/1/020. in review. [DOI] [PMC free article] [PubMed] [Google Scholar]
- Fahey B, Nightingale K, McAleavey S, Palmeri M, Wolf P, Trahey G. Acoustic radiation force impulse imaging of myocardial radiofrequency ablation: Initial in vivo results. IEEE Trans. Ultrason., Ferroelec., Freq. Contr. 2005a;52(4):631–641. doi: 10.1109/tuffc.2005.1428046. [DOI] [PubMed] [Google Scholar]
- Fahey B, Nightingale K, Nelson R, Palmeri M, Trahey G. Acoustic radiation force impulse imaging of the abdomen: demonstration of feasibility and utility. Ultrasound Med. Biol. 2005b Sep;31(9):1185–1198. doi: 10.1016/j.ultrasmedbio.2005.05.004. [DOI] [PubMed] [Google Scholar]
- Fahey B, Palmeri M, Trahey G. The impact of physiological motion on tissue tracking during radiation force imaging. Ultrasound Med. Biol. doi: 10.1016/j.ultrasmedbio.2007.01.007. in press. [DOI] [PMC free article] [PubMed] [Google Scholar]
- Gao L, Parker K, Lerner R, Levinson S. Imaging of the elastic properties of tissue - a review. Ultrasound Med. Biol. 1996;22(8):959–977. doi: 10.1016/s0301-5629(96)00120-2. [DOI] [PubMed] [Google Scholar]
- Gertner M, Worthington A, Wilson B, Sherar M. Ultrasound imaging of thermal therapy in in vitro liver. Ultrasound Med. Biol. 1998;24(7):1023–1032. doi: 10.1016/s0301-5629(98)00087-8. [DOI] [PubMed] [Google Scholar]
- Greenleaf JF, Fatemi M, Insana M. Selected methods for imaging elastic properties of biological tissues. Annu Rev Biomed Eng. 2003;5:57–78. doi: 10.1146/annurev.bioeng.5.040202.121623. [DOI] [PubMed] [Google Scholar]
- Hall T. AAPM/RSNA physics tutorial for residents: topics in US: beyond the basics: elasticity imaging with US. Radiographics. 2003;23(6):1657–1671. doi: 10.1148/rg.236035163. [DOI] [PubMed] [Google Scholar]
- Jeffrey S, Birdwell R, Ikeda D, Daniel B, Nowels K, Dirbas F, Griffey S. Radiofrequency ablation of breast cancer: first report of an emerging technology. Arch Surg. 1999;134(10):1064–1068. doi: 10.1001/archsurg.134.10.1064. [DOI] [PubMed] [Google Scholar]
- Jiang J, Varghese T, Chen Q, Hall T, Zagzebski J. Finite element analysis of tissue deformation with a radiofrequency ablation electrode for strain imaging. IEEE Trans Ultrason Ferroelectr Freq Control. 2007;54(2):281–289. doi: 10.1109/tuffc.2007.242. [DOI] [PubMed] [Google Scholar]
- Kasai C, Koroku N, Koyano A, Omoto R. Real-time two-dimensional blood flow imaging using an autocorrelation technique. IEEE Trans. Ultrason., Ferroelec., Freq. Contr. 1985;SU-32(3):458–463. [Google Scholar]
- Kelekis A, Terraz S, Roggan A, Terrier F, Majno P, Mentha G, Roth A, Becker C. Percutaneous treatment of liver tumors with an adapted probe for cooled-tip, impedance-controlled radiofrequency ablation under open-magnet mr guidance: initial results. Eur Radiol. 2003;13:1100–1105. doi: 10.1007/s00330-003-1847-2. [DOI] [PubMed] [Google Scholar]
- Krouskop T, Wheeler T, Kallel F, Garra B, Hall T. Elastic moduli of breast and prostate tissues under compression. Ultrasonic Imaging. 1998;20:260–274. doi: 10.1177/016173469802000403. [DOI] [PubMed] [Google Scholar]
- Lewin J, Nour S, Connell C, Sulman A, Duerk J, Resnick M, Haaga J. Phase II clinical trial of interactive MR imaging-guided interstitial radiofrequency thermal ablation of primary kidney tumors: initial experience. Radiology. 2004;232(3):835–845. doi: 10.1148/radiol.2323021351. [DOI] [PubMed] [Google Scholar]
- Leyendecker J, III GD, Halff G, McCoy V, Napier D, Hubbard L, Chintapalli K, Choprah S, Washburn W, Esterl R, Cigarroa F, Kohlmeier R, Sharkey F. Sonographically observed echogenic response during intraoperative radiofrequency ablation of cirrhotic livers. AJR. 2002 may;178(5):1147–1151. doi: 10.2214/ajr.178.5.1781147. [DOI] [PubMed] [Google Scholar]
- Livraghi T, Goldberg S, Lazzaroni S, Meloni F, Ierace T, Solbiati L, Gazelle G. Hepatocellular carcinoma: radio-frequency ablation of medium and large lesions. Radiology. 2000 Mar;214(3):761–768. doi: 10.1148/radiology.214.3.r00mr02761. [DOI] [PubMed] [Google Scholar]
- Livraghi T, Goldberg S, Solbiati L, Meloni F, Ierace T, Gazelle G. Percutaneous radio-frequency ablation of liver metastases from breast cancer: initial experience in 24 patients. Radiology. 2001 Jul;220(1):145–149. doi: 10.1148/radiology.220.1.r01jl01145. [DOI] [PubMed] [Google Scholar]
- Lorentzen T, Christensen NE, Nolsle CP, Torp-Pedersen ST. Radiofrequency tissue ablation with a cooled needle in vitro: ultrasonography, dose response, and lesion temperature. Acad Radiol. 1997 Apr;4(4):292–297. doi: 10.1016/s1076-6332(97)80031-1. [DOI] [PubMed] [Google Scholar]
- Loupas T, Powers J, Gill R. An axial velocity estimator for ultrasound blood flow imaging, based on a full evaluation of the Doppler equation by means of atwo-dimensional autocorrelation approach. IEEE Trans. Ultrason., Ferroelec., Freq. Contr. 1995;42(4):672–688. [Google Scholar]
- Malcolm A, Ter Haar G. Ablation of tissue volumes using high intensity focused ultrasound. Ultrasound Med. Biol. 1996;22(5):659–669. doi: 10.1016/0301-5629(96)00020-8. [DOI] [PubMed] [Google Scholar]
- Mayo-Smith W, Dupuy D, Parikh P, Pezzullo J, Cronan J. Imaging-guided percutaneous radiofrequency ablation of solid renal masses: techniques and outcomes of 38 treatment sessions in 32 consecutive patients. AJR Am J Roentgenol. 2003 Jun;180(6):1503–1508. doi: 10.2214/ajr.180.6.1801503. [DOI] [PubMed] [Google Scholar]
- Minami Y, Kudo M, Chung H, Kawasaki T, Yagyu Y, Shimono T, Shiozaki H. Contrast harmonic sonography-guided radiofrequency ablation therapy versus B-mode sonography in hepatocellular carcinoma: prospective randomized controlled trial. AJR Am J Roentgenol. 2007;188(2):489–494. doi: 10.2214/AJR.05.1286. [DOI] [PubMed] [Google Scholar]
- Montgomery R, Rahal A, III GD, Leyendecker J, Hubbard L. Radiofrequency ablation of hepatic tumors: Variability of lesion size using a single ablation device. AJR. 2004 march;182(3):657–661. doi: 10.2214/ajr.182.3.1820657. [DOI] [PubMed] [Google Scholar]
- Nightingale K, Soo M, Nightingale R, Trahey G. Acoustic radiation force impulse imaging: In vivo demonstration of clinical feasibility. Ultrasound Med. Biol. 2002;28:227–235. doi: 10.1016/s0301-5629(01)00499-9. [DOI] [PubMed] [Google Scholar]
- Nyborg W. Acoustic streaming. Ch. 11. In: Mason W, editor. Physical Acoustics. Vol. IIB. New York: Academic Press Inc; 1965. pp. 265–331. [Google Scholar]
- O’Donnell M, Skovoroda A, Shapo B, Emelianov S. Internal displacement and strain imaging using ultrasonic speckle tracking. IEEE Trans. Ultrason., Ferroelec., Freq. Contr. 1994;41(3):314–325. [Google Scholar]
- Oudkerk M, Torres C, Song B, Knig M, Grimm J, Fernandez-Cuadrado J, Op de Beeck B, Marquardt M, van Dijk P, de Groot J. Characterization of liver lesions with mangafodipir trisodium-enhanced MR imaging: multicenter study comparing MR and dual-phase spiral CT. Radiology. 2002 May;223(2):517–524. doi: 10.1148/radiol.2232010318. [DOI] [PubMed] [Google Scholar]
- Pavlovich C, Walther M, Choyke P, Pautler S, Chang R, Linehan W, Wood B. Percutaneous radio frequency ablation of small renal tumors: initial results. J Urol. 2002;167(1):10–15. [PMC free article] [PubMed] [Google Scholar]
- Pinton G, Dahl J, Trahey G. Rapid tracking of small displacements with ultrasound. IEEE Trans. Ultrason., Ferroelec., Freq. Contr. 2006 June;53(6):1103–1117. doi: 10.1109/tuffc.2006.1642509. [DOI] [PubMed] [Google Scholar]
- Raman S, Lu D, Vodopich D, Sayre J, Lassman C. Creation of radiofrequency lesions in a porcine model: correlation with sonography, ct, and histopathology. AJR. 2000 november;175(5):1253–1258. doi: 10.2214/ajr.175.5.1751253. [DOI] [PubMed] [Google Scholar]
- Righetti R, Kallel F, Stafford R, Price RE, Krouskop TA, Hazle JD, Ophir J. Elastographic characterization of hifu-induced lesions in canine livers. Ultrasound Med. Biol. 1999;25(7):1099–1113. doi: 10.1016/s0301-5629(99)00044-7. [DOI] [PubMed] [Google Scholar]
- Rose S, Hassanein T, Easter D, Gamagami R, Bouvet M, Pretorius D, Nelson T, Kinney T, James G. Value of Three-dimensional US for Optimizing Guidance for Ablating Focal Liver Tumors. Journal of Vascular and Interventional Radiology. 2001;12:507–515. doi: 10.1016/s1051-0443(07)61892-2. [DOI] [PubMed] [Google Scholar]
- Sheafor D, Paulson E, Kliewer M, DeLong D, Nelson R. Comparison of Sonographic and CT Guidance Techniques: Does CT Fluoroscopy Decrease Procedure Time? AJR Am J Roentgen. 2000;174:939–942. doi: 10.2214/ajr.174.4.1740939. [DOI] [PubMed] [Google Scholar]
- Sheafor D, Paulson E, Simmons C, DeLong D, Nelson R. Abdominal percutaneous interventional procedures: comparison of CT and US guidance. Radiology. 1998;207(3):705–710. doi: 10.1148/radiology.207.3.9609893. [DOI] [PubMed] [Google Scholar]
- Solbiati L, Goldberg S, Ierace T, Dellanoce M, Livraghi T, Gazelle G. Radio-frequency ablation of hepatic metastases: postprocedural assessment with a US microbubble contrast agent-early experience. Radiology. 1999 Jun;211(3):643–649. doi: 10.1148/radiology.211.3.r99jn06643. [DOI] [PubMed] [Google Scholar]
- Solbiati L, Ierace T, Tonolini M, Cova L. Guidance and monitoring of radiofrequency liver tumor ablation with contrast-enhanced ultrasound. Eur J Radiol. 2004 Jun;51 Suppl:19–23. doi: 10.1016/j.ejrad.2004.03.035. [DOI] [PubMed] [Google Scholar]
- Torr G. The acoustic radiation force. Am. J. Phys. 1984;52:402–408. [Google Scholar]
- Trahey G, Allison J, VonRamm O. Angle independent ultrasonic detection of blood flow. IEEE Trans. Biomed. Egr. 1987;BME-34(12):965–967. doi: 10.1109/tbme.1987.325938. [DOI] [PubMed] [Google Scholar]
- Varghese T, Shi H. Elastographic imaging of thermal lesions in liver in-vivo using diaphragmatic stimuli. Ultrason Imaging. 2004 Jan;26(1):18–28. doi: 10.1177/016173460402600102. [DOI] [PubMed] [Google Scholar]
- Veit P, Antoch G, Stergar H, Bockisch A, Forsting M, Kuehl H. Detection of residual tumor after radiofrequency ablation of liver metastasis with dual-modality pet/ct: initial results. Eur Radiol. 2006 Jan;16(1):80–87. doi: 10.1007/s00330-005-2767-0. [DOI] [PubMed] [Google Scholar]
- Vilana R, Bianchi L, Varela M, Nicolau C, Sánchez M, Ayuso C, García M, Sala M, Llovet J, Bruix J, et al. Is microbubble-enhanced ultrasonography suffcient for assessment of response to percutaneous treatment in patients with early hepatocellular carcinoma? European Radiology. 2006;16(11):2454–2462. doi: 10.1007/s00330-006-0264-8. [DOI] [PubMed] [Google Scholar]
- Woertler K, Vestring T, Boettner F, Winkelmann W, Heindel W, Lindner N. Osteoid osteoma: CT-guided percutaneous radiofrequency ablation and follow-up in 47 patients. J Vasc Interv Radiol. 2001;12(6):717–722. doi: 10.1016/s1051-0443(07)61443-2. [DOI] [PubMed] [Google Scholar]
- Xu H, Yin X, Lu M, Xie X, Xu Z, Liu G. Usefulness of three-dimensional sonography in procedures of ablation for liver cancers: initial experience. J Ultrasound Med. 2003 Nov;22(11):1239–1247. doi: 10.7863/jum.2003.22.11.1239. [DOI] [PubMed] [Google Scholar]
- Yeh W, Li P, Jeng Y, Hsu H, Kuo P, Li M, Yang P, Lee P. Elastic modulus measurements of human liver and correlation with pathology. Ultrasound Med Biol. 2002 Apr;28(4):467–474. doi: 10.1016/s0301-5629(02)00489-1. [DOI] [PubMed] [Google Scholar]