Abstract
Low-frequency modulation of distortion product otoacoustic emissions (DPOAEs) was measured from the human ears. In the frequency domain, increasing the bias tone level resulted in a suppression of the cubic difference tone (CDT) and an increase in the magnitudes of the modulation sidebands. Higher-frequency bias tones were more efficient in producing the suppression and modulation. Quasi-static modulation patterns were derived from measuring the CDT amplitude at the peaks and troughs of bias tones with various amplitudes. The asymmetric bell-shaped pattern resembled the absolute value of the third derivative of a nonlinear cochlear transducer function. Temporal modulation patterns were obtained from inverse FFT of the spectral contents around the DPOAE. The period modulation pattern, averaged over multiple bias tone cycles, showed two CDT peaks each correlated with the zero-crossings of the bias tone. The typical period modulation pattern varied and the two CDT peaks emerged with the reduction in bias tone level. The present study replicated the previous experimental results in gerbils. This noninvasive technique is capable of revealing the static position and dynamic motion of the cochlear partition. Moreover, the results of the present study suggest that this technique could potentially be applied in the differential diagnosis of cochlear pathologies.
I. INTRODUCTION
Our ears are sensitive mechanical transducers where fluctuations of sound pressure and frequency are transformed into neural signals. The inner ear transduction demonstrates a compressive nonlinearity by which the ear can accommodate a large dynamic range and maintain a sharp sensitivity. Natural outcomes of the cochlear nonlinearity are mutual suppression and intermodulation distortion products (DPs) when the ear is stimulated by two tones (see Robles and Ruggerro, 2001 for a review). In addition, cochlear hair cells are capable of a reverse transduction to facilitate a feedback mechanism to enhance hearing sensitivity. The voltage-dependent motility of either the hair bundles (Kennedy et al., 2005) or the membrane proteins of the outer hair cells (OHCs) (Liberman et al., 2002) can produce force that injects energy into the vibration of cochlear partition. The motion of cellular structures induced by this feedback force can escape the boundaries of inner and middle ears so that it can be detected in the ear canal as small variations of sound pressure (Kemp, 1978) or otoacoustic emissions (OAEs). Therefore, using OAEs to measure the cochlear transduction provides a powerful tool to evaluate the status of the inner ear (Lonsbury-Martin and Martin, 2003). Despite the widespread use of OAEs in hearing screening, auditory sensitivity estimation, and differential diagnosis of cochlear versus retro-cochlear dysfunctions, there is a demand for applications in quantitative evaluations of the cochlear transduction and the dynamics of hair cell function (Kemp, 2007).
One way to quantify the nonlinearity in cochlear transduction is to use the acoustic DPs measured in the ear canal or the distortion product otoacoustic emissions (DPOAEs) evoked with a two-tone stimulus (f1, f2, f1 < f2). A low-frequency biasing technique has been used in quantifying a cochlear transducer function (FTr) from the DPOAEs measured in gerbils (Bian et al., 2002; Bian, 2004). This technique fully utilizes the nonlinear effects of cochlear transduction, namely suppression and distortion, to estimate the transfer characteristics of the inner ear. By introducing a high-level low-frequency tone, this method can “slowly” shift the cochlear partition to vary the operating point (OP) of the hair cell transducer and induce an amplitude modulation (AM) of the DPOAEs. For odd-order DPs, the magnitudes are suppressed depending on the phase of the low-frequency bias tone (Bian et al., 2002; Bian, 2006); whereas for even-order DPs, the DPOAE magnitudes are enhanced at maximal displacements of the cochlear partition induced by the bias tone (Bian, 2004, 2006). These different DPOAE modulation patterns are intimately related to the cochlear transducer nonlinearity, because in principle these DP magnitudes are proportional to the appropriate derivatives of the cochlear FTr. This gives rise to the first utility to derive the cochlear FTr with inverse methods.
The second utility of the technique is perhaps a more important one, because it assesses the dynamic function of the hair cell transducer on a cycle-by-cycle basis. The temporal behavior of the DPOAE magnitude under the periodic biasing of cochlear partition reveals detailed information of the underlying dynamic system of the cochlear transducer. Not only does the variation in DP amplitudes depend on the bias tone phase, but also on the direction of change in the biasing pressure. Two slightly different modulation patterns forming a hysteresis loop are observed over one biasing cycle (Bian et al., 2004; Bian, 2004; Bian and Chertoff, 2006), which can be attributed to a time-dependent process within the cochlear transducer, perhaps the active force production in the OHCs that provides amplification and adaptation of the transduction process. The third utility stems from the correlation between the temporal behavior of DPOAEs and their spectral characteristics. A direct consequence of the AM of the DPOAEs is the presence of multiple sidebands around the DPs (Bian, 2006). The locations and sizes of the sidebands were closely associated with the local nonlinearity in the cochlea that generates the DPs. These sidebands are within a narrow frequency band, thus less likely can be altered by the transfer characteristics of the middle and inner ears. Furthermore, analyzing all the sidebands of a given DPOAE can provide a complete estimate of the cochlear transducer nonlinearity.
A fourth utility is that the asymmetry of the DP modulation patterns, esp., those of the even-order DPs, could provide an accurate estimate of the optimal OP of the cochlear transducer where the gain is maximal (Bian, 2004). This measurement is useful in measuring the resting position of basilar membrane (BM) which is important in the understanding of cochlear mechanics and critical in the diagnosis of cochlear pathologies, including Ménière’s disease or endolymphatic hydrops. Therefore, low-frequency modulation of DPOAEs could be developed into a clinical tool to estimate the function of cochlear hair cells. Towards this goal, it is necessary to quantify the effects of biasing the cochlear partition on DPOAE amplitudes in humans. It is known that two different mechanisms, namely wave-fixed nonlinearity and place-fixed reflections, are responsible for the generation of DPOAEs in humans (Shera and Guinan, 1999; Knight and Kemp, 2001). Although introducing a low-frequency tone at high levels may suppress the reflected DP from its own best frequency place on the BM (Johnson et al., 2006), the feasibility and accuracy of deriving the cochlear FTr from this technique in humans remain to be tested. To date, low-frequency modulation of human DPOAEs has been reported (Scholtz et al., 1999), but systematic variation and quantification of the cochlear FTr need to be further investigated.
II. METHODS
A. Experimental procedures
Data were collected in 21 ears from a total of eighteen healthy subjects (mean age: 27) who were recruited from the students at the Arizona State University (ASU) under the protocol approved by the Institutional Review Board on human research subjects. All the subjects were screened for normal hearing thresholds and middle ear functions in the audiology clinic of the Department of Speech and Hearing Science at ASU. Otoscopy was performed to visually inspect the tympanic membrane to exclude diseases in the outer and middle ear. A DPOAE-gram was also measured using an 8-point/octave frequency spacing procedure (ILO92, Otodynamics) to ensure that no deep notch of DPOAEs micro-structure presented in the frequency range from 1 to 3 kHz and the DPOAE magnitude was relatively large (≥ 5 dB SPL). In addition, presence of spontaneous OAEs was ruled out within the same frequency range to avoid interference with DPOAE measures. A standard DPOAE measurement system, including a calibrated probe microphone (Etymotic Research, ER-10B) and two coupled earphones (ER-2) was used. A coupler was inserted into the eartip to accommodate a front tube for the bias tone and the ER-10B system. The bias tone was produced from an insertion earphone with an 8.5 mm driver (HA-FX55, JVC) and the two-tone signal from the ER-2s. All earphones were connected to the recording system with three silicon front tubes (ER1-21). Two DPOAE-evoking primary tones and a bias tone were presented simultaneously and the ear-canal acoustics were recorded.
B. Signal Processing and data acquisition
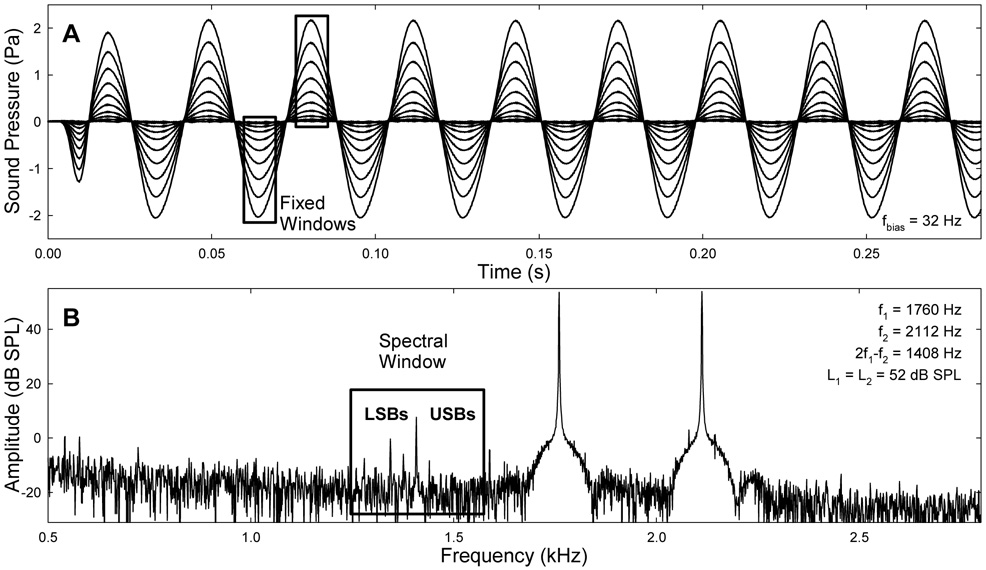
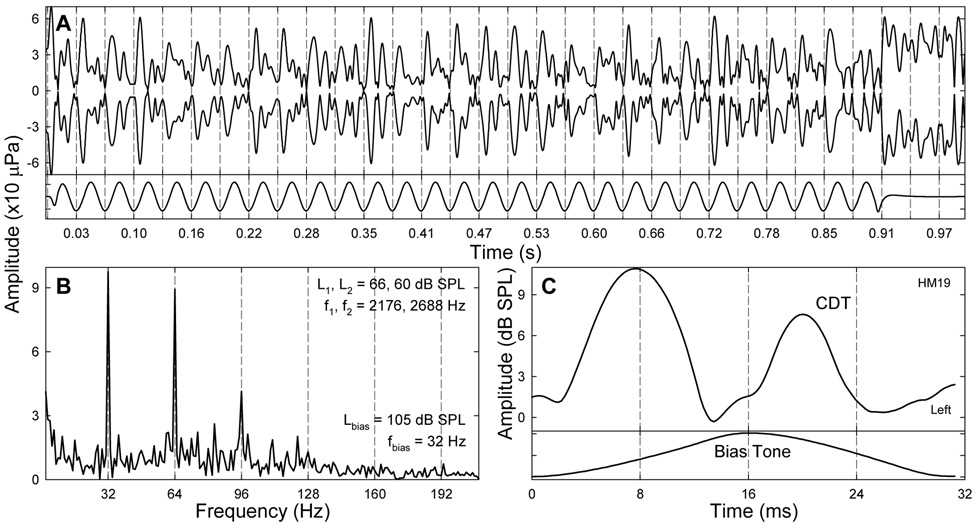
Signal presentation and data collection were performed with a personal computer (PC) linked to two 24-bit dynamic signal acquisition (DAQ) and generation cards (PXI-4461, National Instruments, NI) using a custom-built software written in LabVIEW (v.8, NI). The primary and bias tones with a duration of 1s were digitally created from three sine wave generators. The two primary tones were windowed with a 5ms cos2-shaped rise/fall ramp and the ramps of the bias tone were 10ms long with the offset placed at 0.9s, so that there was a 0.1s flat tail (Fig. 1A). Except the earliest three ears, the primary frequencies used were 2176 and 2688 Hz with an f2/f1 ratio of 1.23. Both primary and bias tones were written to three of the 4 output channels on both DAQ cards (8 channels total: 4 in, 4 out) housed in a PCI extension chassis (PXI-1036, NI) which was connected to an expansion slot of the host PC with a high-bandwidth serial interface card (MXI-4, NI). All three output channels for delivering stimuli and one input channel for data collection were synchronized by an onboard clock with a maximal rate of 26 MHz and digitally triggered with a minimum pulse width of 10 ns. The levels of the primary and the bias tones were adjusted with three virtual attenuators implemented in the LabVIEW software. The two primary levels (L1 and L2) were set at 60 dB SPL, then L1 and L2 were adjusted up to a 5~6 dB difference (L1 > L2) so that the amplitude of 2f1-f2 (cubic difference tone, CDT) DPOAE was above 5 dB SPL. Except the earliest few subjects, five bias tone frequencies (fbias) of 25, 32, 50, 75, and 100 Hz were presented in random order to modulate the DPOAEs. The sound pressure levels of the stimuli were calibrated in a 2-cc coupler with a sound level meter (SoundPro DLX, Quest Tech.). At each fbias, the level was incremented so that a complete suppression of the CDT magnitude was observed. This was set as the initial bias tone level (Lbias) from which the peak amplitude of the bias tone was descended automatically in 41 steps to 0 Pa (Fig. 1A) using a cubic scaling so that the level was attenuated in smaller steps at high intensities. At each step, the ear-canal acoustic signal was amplified 20 dB by the build-in pre-amplifier of the ER-10B, averaged 8–16 times depending on the size of the CDT, digitized at 204.8 kHz, and saved on the hard drive.
Fig. 1.
Bias tones and a spectrum of the ear-canal acoustics. A: Samples of a 32-Hz bias tone with various amplitudes. Rectangles indicate the fixed FFT windows centered at the peaks and troughs of the bias tone for extracting the quasi-static modulation pattern of CDT. Window lengths: from 3200 points (15.6 ms) for bias tones below 50 Hz to 1600 points (7.8 ms) for bias tone frequency (fbias) ≥ 50 Hz. B: Spectrum of an ear-canal acoustic signal. The box is a rectangular window centered at the CDT frequency covering multiple sidebands.
C. Data analysis
Data were analyzed off-line in Matlab (v.7, MathWorks). The ear-canal acoustical signals recorded at different biasing levels were high-pass filtered at 400 Hz to eliminate the bias tone and submitted to a fast Fourier transform (FFT) to obtain the frequency spectra (Fig. 1B). The spectral feature of the AM of the CDT is the presence of multiple lower and upper sidebands (LSBs and USBs) on either side of the CDT component separated with integer multiples of fbias (Bian, 2006). Thus, the amplitudes of two LSBs and two USBs along with the CDT were measured from the spectra. The corresponding levels of the bias tones were also measured by the peak amplitude of the low-pass filtered (at 700 Hz) ear-canal acoustic signals.
To study the effect of biasing direction on the CDT magnitude, a fixed-window method (Bian et al., 2002) was used to extract the quasi-static modulation pattern (Fig. 1A). Segments of 3200 or 1600 points long (15.6 ms or 7.8 ms) at peaks and troughs of the bias tone were windowed for FFT at fbias below or above 50 Hz, respectively. The window length was selected to limit the signal inclusion within one half biasing cycle, assuming that the BM is statically displaced in one direction within a short time window. The CDT amplitudes obtained from two adjacent biasing peaks and troughs were paired to form the positive and negative halves of a modulation pattern. The patterns obtained from a total of 22 to 88 pairs of peaks and troughs were averaged for different biasing frequencies.
Temporal features of the DP were extracted using a spectral windowing method (Fig. 1B). The positive frequency half of the complex spectrum of the ear-canal acoustic signal was selected by a rectangular window centered at the CDT frequency covering 4 LSBs and USBs. The windowed spectrum was inverse Fourier transformed (IFFT) to yield the varying envelope of the CDT in the time domain. To examine the temporal effect more precisely, the instantaneous CDT amplitude within one biasing cycle was averaged across 20 to 86 periods to reduce noise and DPs from other sources.
III. RESULTS
A. Spectral sidebands
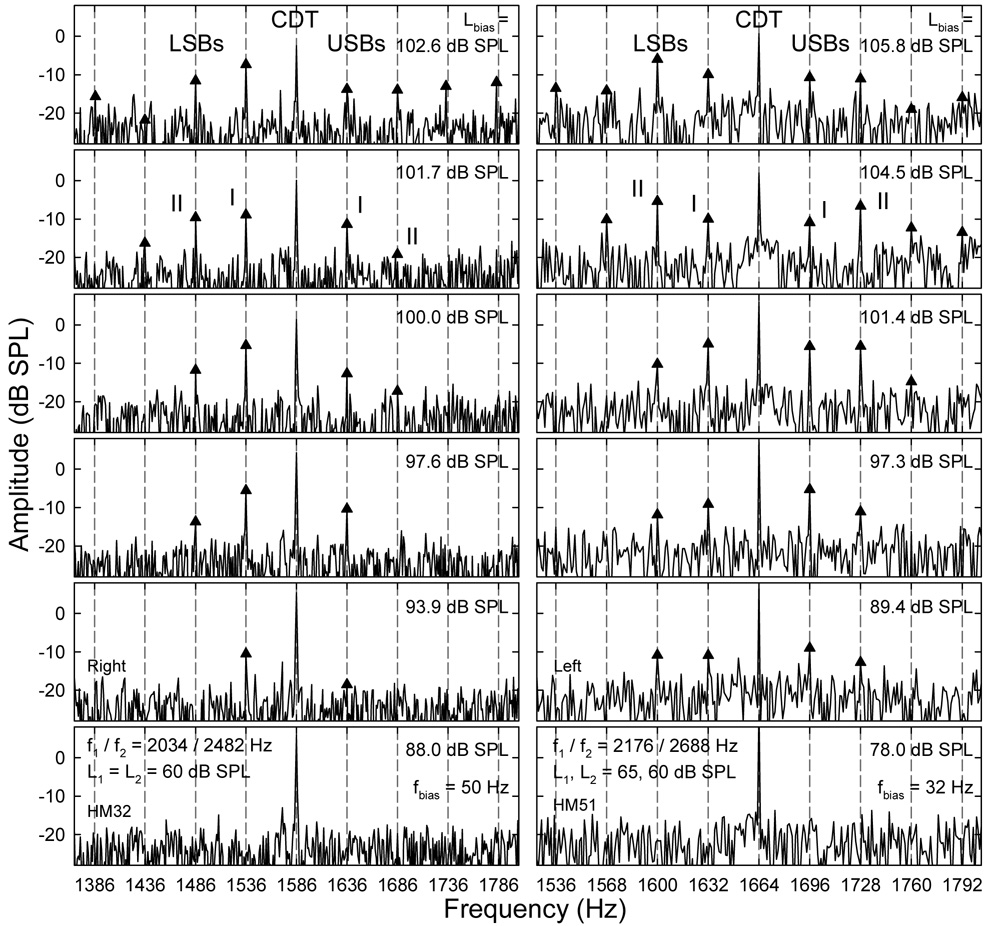
An important finding of the study was that the presence of LSBs and USBs around the CDT component depended on the sizes of the CDT and the bias tone. Usually, when a relatively large CDT was evoked at lower primary levels, the cochlea could easily generate sidebands with higher magnitudes when a bias tone was introduced. For primary levels about 55 ~ 65 dB SPL, if the CDT magnitude was greater than 5 dB SPL, multiple sidebands were typically observed when the Lbias exceeded 100 dB SPL for most frequencies below 100 Hz (Fig. 2). As the Lbias decreased, both the magnitudes and number of sidebands were reduced. When Lbias was below 75 dB SPL, hardly any sideband could be observed (bottom of Fig. 2). This indicated that the AM of the CDT occurred at high bias tone levels. The spectral location of the sidebands were at integer multiples of the fbias away from the CDT, reflecting a nonlinear AM in the time domain (Bian, 2006). When multiple sidebands presented, the relative amplitudes between the sidebands varied depending on the Lbias. Often at the highest biasing levels, the second sideband (sideband II), which was 2fbias away from the CDT on each side, was greater than the first sideband or sideband I (fbias from the CDT). At lower levels, sideband I exceeded sideband II suggesting a change in the temporal modulation pattern due to lower bias tone intensity. It can be observed from Fig. 2 that the Lbias required to generate modulation sidebands depended on the fbias. When the frequency difference between the bias tone and the CDT was small, a bias tone with relatively smaller amplitude could produce a significant number of sidebands with magnitudes up to 15 dB above noise floor (Fig. 2 left). Also noticeable was the reduction of CDT amplitude at very high Lbias (top panels), indicating a mixed effect of modulation and suppression.
Fig. 2.
Spectral sidebands: suppression and modulation. Panels in each column represent the effect of decreasing the bias tone level (Lbias): reduction in the spectral fine structures around the CDT. Note: the CDT magnitude increases while the number and sizes of the sidebands decrease. USB: upper sideband; LSB: lower sideband. On each side of the CDT frequency, the first and second sidebands with frequency separation of fbias and 2 fbias from the CDT are termed sideband I and II, respectively.
B. Biasing effects
1. Suppression and modulation
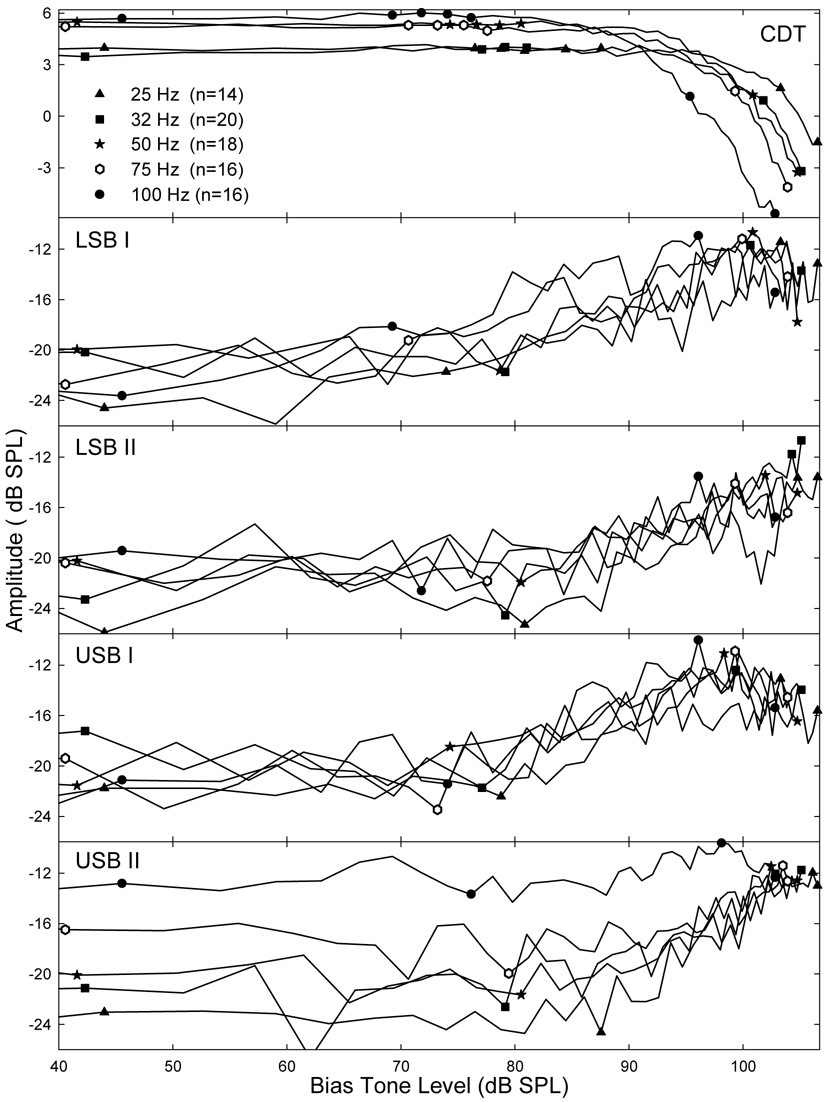
The bias tone produced not only a modulation of the CDT, but also a suppression of the CDT. This mixed effect was studied by examining the amplitudes of the DPOAE and its closest sidebands, namely sidebands I and II on each side, as functions of the varying Lbias (Fig. 3). Other sidebands that were more distant from the CDT were not included in the analysis because of lower amplitudes and higher variability. Averaged across all ears, the mean amplitudes of the CDT and its two sidebands in the LSB and USB showed opposite changes as the Lbias increased (Fig. 3). Because the CDT magnitude was always above 0 dB SPL and the sidebands were much smaller, the mean sideband amplitudes were more variable than the CDT. For all 5 biasing frequencies, the CDT magnitude clearly demonstrated a suppression when the Lbias exceeded 90 dB SPL, while the sidebands showed a gradual increase. The rise of sidebands started at much lower biasing levels. As indicated by four consecutive symbols in the top panel of Fig. 3, the sidebands began to rise from about 70~80 dB SPL for high and low biasing frequencies. Below these biasing levels, the CDT magnitudes were stable with no sidebands (below noise floor: −20 dB SPL). For 10 to 15 dB above these levels, the sidebands increased about 5 – 10 dB with no noticeable reduction in CDT magnitude. When sidebands reached their maximal levels, usually about −10 to −5 dB SPL, the CDT showed a significant reduction of about 3 to 5 dB (single symbol). These effects indicated that the modulation and suppression occurred simultaneously. For 100 Hz bias tone, the Lbias to produce the significant CDT suppression was about 10 dB below the level of 25 Hz, suggesting that higher frequency bias tones were more effective.
Fig. 3.
Effects of Lbias: suppression and modulation. Each panel represents the mean CDT or a sideband magnitude as a function of the Lbias. Top: the CDT magnitude is suppressed when the Lbias reaches over 85 to 90 dB SPL. Note: the different slopes of CDT suppression at different biasing frequencies. Lower panels: the growths of four sidebands as the Lbias increases. The Lbias where the sidebands begin to rise is indicated by a group symbols that are also projected to the CDT curves in the top panel. The sidebands reach their maximal value around 100 dB SPL Lbias (indicated by a symbol also projected in the top panel). Sidebands I roll over above 95 ~ 100 dB SPL. Sidebands II peak at higher Lbias.
The growths of different sidebands showed some variations. Sideband I started to rise at lower Lbias and reached a peak at about 95 to 103 dB SPL (single symbol in Fig. 3 top) depending on the fbias. When the CDT was significantly suppressed above these levels, the magnitudes of sidebands I began to rollover, while sidebands II remained to increase and saturated near the highest biasing levels. Thus, below the peak levels of sidebands I, the magnitudes of sidebands I were higher than sidebands II, while above these levels sidebands II were larger (Fig. 3 lower panels). The growths of the sidebands were gradual with a rate of about 0.5 dB/dB with the rate of sidebands II being slightly higher. These differences in the relative sizes of the CDT sidebands suggest that the temporal modulation patterns of the CDT vary with the Lbias.
2. Effect of biasing frequency
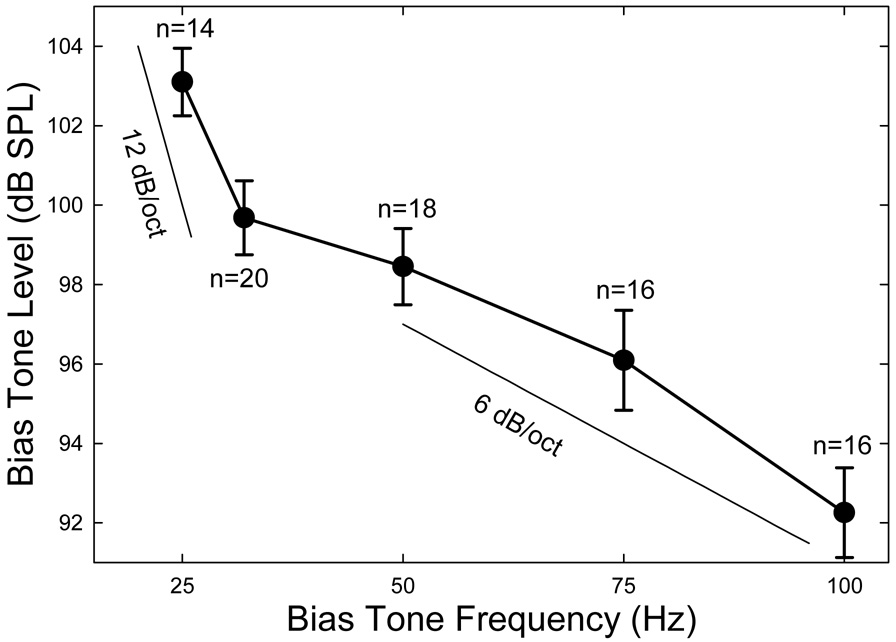
Since the sideband amplitudes were small and variable, analysis of the effect of the fbias was performed on the CDT. The maximal sideband magnitudes corresponded to a 3- to 5-dB reduction in the CDT amplitude (Fig. 3). Therefore, a 3-dB suppression of CDT was used as a criterion to evaluate the effect of the biasing frequency. The Lbias required to produce a 3-dB reduction in CDT magnitude across five biasing frequencies forms a 3-dB iso-suppression curve (Fig. 4) which represents the efficiency of biasing frequency on the modulation of CDT. The 3-dB suppression curve averaged across ears showed a general trend that higher sound pressure was required to produce the same amount CDT suppression when the fbias was reduced. Moreover, the rate of increase in Lbias was different for higher and lower frequencies. Roughly, for biasing frequencies above 50 Hz, there is a 6 dB/octave reduction in Lbias when the biasing frequency was increased, whereas below 32 Hz, the rate of increase in Lbias approached 12 dB/octave when the fbias was reduced. There was a narrow frequency range of transition between 32 and 50 Hz, where the rate of change in Lbias was relatively flat. This suggests that higher frequency bias tones are more efficient in suppressing and modulating the CDT, so that a lower Lbias can be employed.
Fig. 4.
3-dB iso-suppression curve. The means and standard errors of the Lbias necessary to produce a 3-dB suppression of the CTD magnitude are plotted as a function of the fbias. The number of subjects (n) for each frequency is indicated. When the fbias is reduced, the rates of growth in Lbias below and above 32 Hz are 12 and 6 dB/oct., respectively.
C. Quasi-static modulation pattern
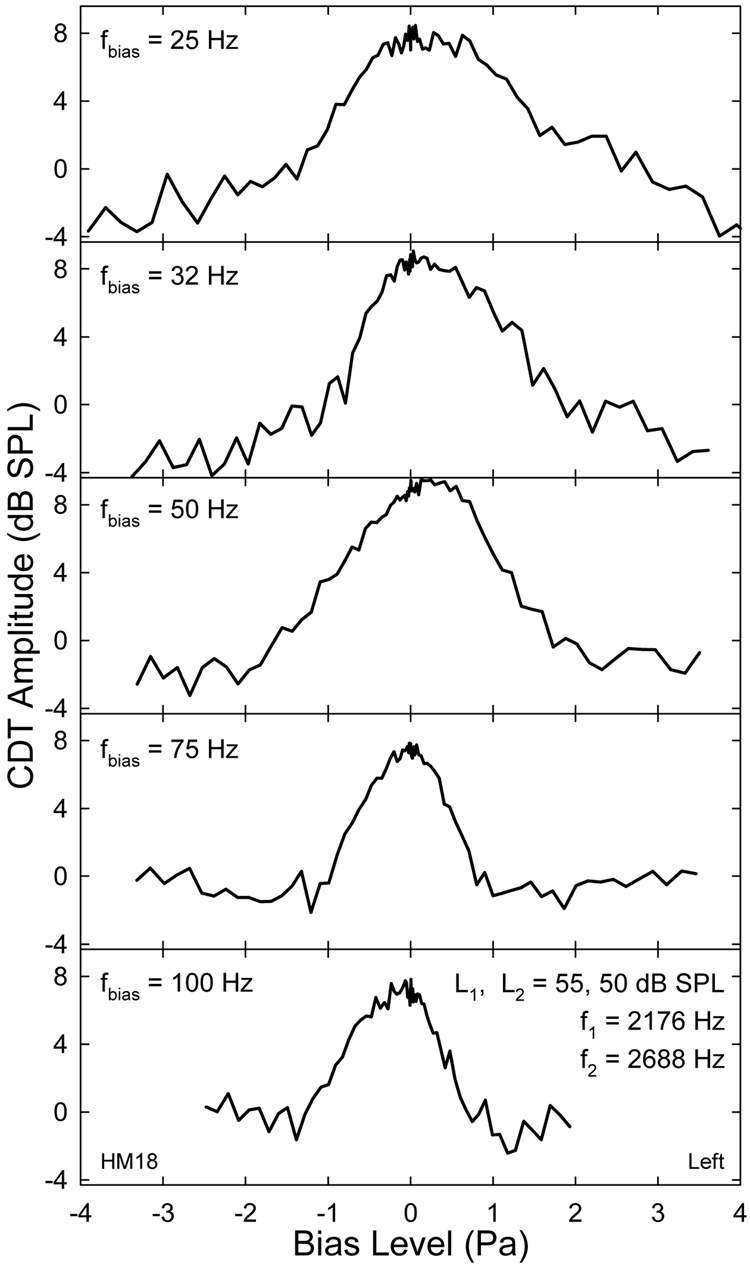
The CDT magnitudes obtained at peaks and troughs of the bias tones with various amplitudes formed a modulation pattern representing the effect of biasing directions. It reflected the static cochlear nonlinearity over many biasing cycles where the phases were fixed at the biasing extremes. As shown by an example, the derived CDT quasi-static modulation patterns from different biasing frequencies shared similar characteristics (Fig. 5). The CDT magnitude was largest around 0 Pa and reduced when biasing pressure increased in either direction. The difference between the maximal and the minimal CDT amplitudes or the modulation depth was as large as 12 dB. This decline in CDT amplitude was gradual for a lower fbias and more abrupt for higher frequencies. At the minima of the CDT magnitude, it often formed a notch on either side. The locations of the notches were farther apart for lower frequencies and closer to each other at higher fbias. Thus, the modulation pattern covered different biasing pressure ranges, e.g., ±3 Pa at 25 Hz to about ±1 Pa at 100 Hz. There was also a noticeable variability or fluctuation (Fig. 5), typically less than 3 dB, on the CDT modulation patterns derived from the 22 to 88 biasing cycles depending on the fbias, and the 41 presentations of bias tones at different levels. This within-subject variability was relatively small near the center of the modulation pattern and increased at higher Lbias on either side.
Fig. 5.
Examples of quasi-static modulation patterns. The quasi-static modulation patterns show a bell-shape with notches on both sides. Note: the range of Lbias reduces with fbias. Asymmetry in the modulation pattern is noticeable. Fluctuations on the curves indicate the variability between the steps of Lbias attenuation.
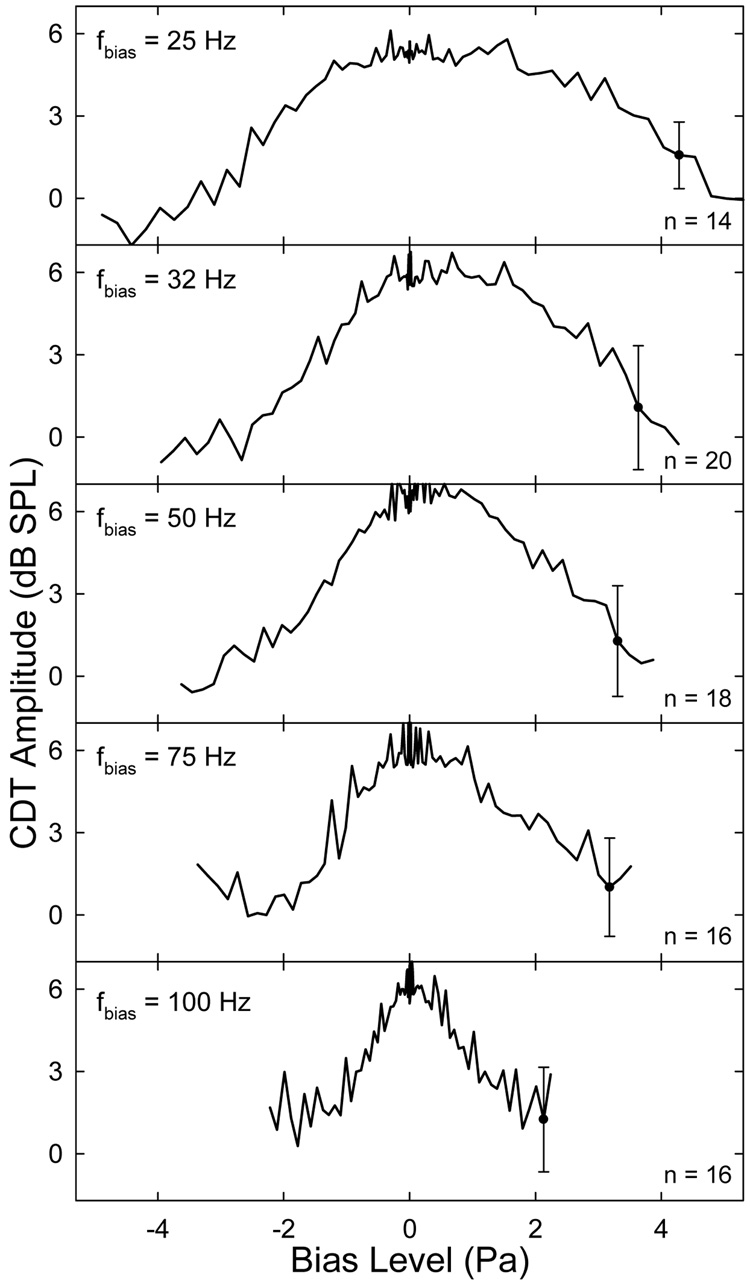
Quasi-static modulation patterns averaged across all ears (Fig. 6) showed the same characteristics as the individual case described above. The pattern was wider at lower biasing frequencies and narrower at higher frequencies with the notch locations varying from ±4 to ±2 Pa biasing pressure. This was consistent with the finding that more sound pressure was required to suppress the CDT at lower biasing frequencies (Fig. 4). Compared to the data shown in Fig. 5, the modulation depths were smaller, amounting to 6 – 8 dB on average, due to the variability among different ears. Apparently, there was an asymmetry in the averaged modulation patterns. The peak of the pattern was shifted away form 0 Pa in the positive sound pressure direction and the slope of the CDT reduction was steeper in the negative pressures than the positive side. For a given Lbias, the CDT amplitude was smaller if the cochlear partition was biased in the negative sound pressure direction. Likewise, biasing in the opposite direction could not completely suppress the CDT for lower frequency bias tones. There was a considerable variability in the mean modulation patterns among different ears. The standard errors (error bars in Fig. 4) averaged across all ears and 82 biasing pressures ranged from 2 to 3 dB for all five frequencies. This inter-subject variability was highest at the center of the modulation pattern reflecting the variation of the initial CDT magnitudes among the ears.
Fig. 6.
Averaged quasi-static modulation patterns. The number of subjects for each fbias is indicated in the panel. Error bars mark the averaged standard error across subjects and the steps of Lbias attenuation. Note: the asymmetry in the modulation patterns, esp., at lower biasing frequencies. The peak of the pattern is shifted in the positive sound pressure direction where the slope is shallower.
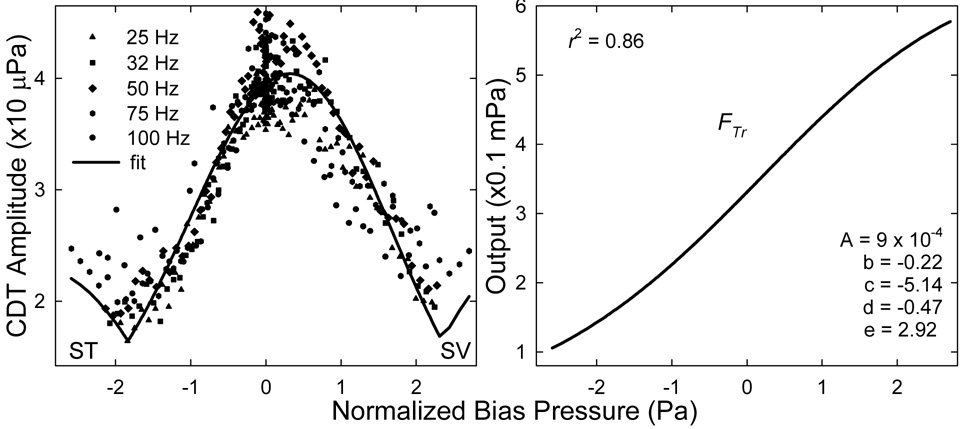
Although the quasi-static modulation patterns obtained at different biasing frequencies covered different pressure ranges, the cochlear nonlinearity governing the suppression and modulation of DPOAEs remained the same for fixed primary levels and frequencies. Therefore, these modulation patterns could be normalized by the input biasing pressures. One way to normalize the input was to equalize the sound pressures at the notches, because the maximal suppression occurred at a certain BM displacement that could be induced by different biasing pressures at different frequencies. Thus, the biasing pressures at frequencies from 25 to 75 Hz were normalized or scaled down to equate with the notches at 100 Hz (Fig. 7 left). The mean CDT data for each fbias were left unchanged and pooled together. These CDT magnitudes lined up consistently forming a typical CDT quasi-static modulation pattern with a center peak and two elevated tails on each side with relatively small variability (< 2 dB). The pooled data from the average of all ears and all biasing frequencies were fit with the absolute value of the third derivative of a Boltzmann function
| (1) |
where y is the mechanical output of the cochlear transducer, x is the BM displacement represented by the normalized Lbias, A is a scaling factor, b and d are parameters relating to the slope of the transducer curve, d and e are constants setting the transducer OP. The fit was relatively good with a correlation coefficient (r2) of 0.86 (Fig. 7 right). Thus, a cochlear FTr of humans was derived with parameters given in the right panel of Fig. 7.
Fig. 7.
Compiled quasi-static modulation pattern and cochlear FTr. Left: the mean CDT data (from Fig. 6) obtained at different fbias (symbols) are normalized by scaling down the Lbias at lower fbias to equalize the notches at 100 Hz. The normalized data then is fit with the absolute value of the third derivative of a Boltzmann function (solid line). ST: scala tympani; SV: scala vestibule. Right: the fitted Boltzmann function (Eq. 1) representing the cochlear FTr. The correlation coefficient (r2) and the Boltzmann parameter are given in the panel.
D. Temporal modulation pattern
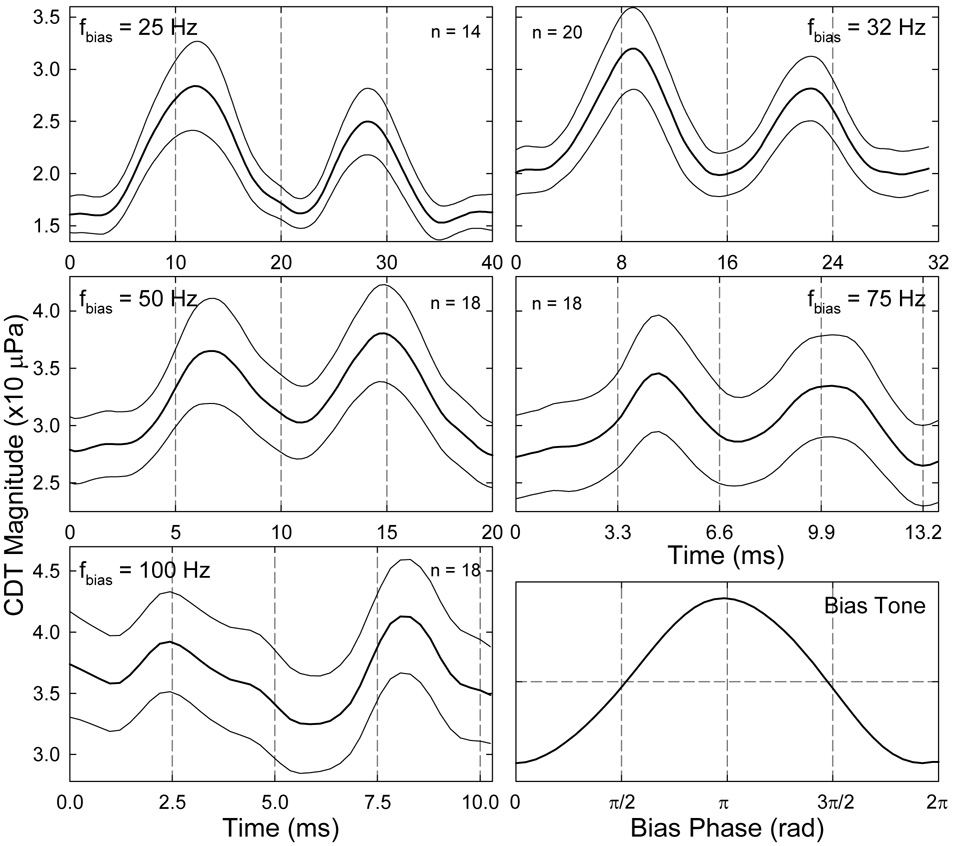
The temporal envelope of the CDT was obtained from IFFT of the windowed spectral contents in the vicinity of the positive CDT frequency, including 4 LSBs and USBs. Because only the bias tones with highest levels produced larger sidebands (Fig. 3), for a given fbias, the CDT envelopes obtained from the top 16 biasing levels (a 10 dB range) were examined to determine the most typical temporal modulation pattern. Since modulation and suppression of CDT occurred simultaneously, the nonlinearly generated CDT was weak and vulnerable to noise contamination. The CDT from other sources, e.g., multiple reflections (Shera and Guinan, 1999; Knight and Kemp, 2001), might not be synchronously modulated by the bias tone. These competing OAEs and random noise could cause irregularities in the CDT envelope (Fig. 8A). This contamination can be verified by the unstable CDT amplitude at the tail portion of the waveform where there is no biasing. However, when closely examined, the apparently noisy waveform was found to possess periodicity. For each biasing cycle from one trough to the next, it was noticeable that the CDT envelope demonstrated two major peaks. One way to reveal the periodicity was to perform an FFT to the CDT envelope (Fig. 8B). It was clear that there were two large peaks presented at the fbias (32 Hz) and its second harmonic (2fbias or 64 Hz). This indicated that there was a pattern repeating in every half basing cycle. To reduce the noise and other irregularities, the CDT envelopes from 20 to 86 biasing periods beginning with a trough were averaged to yield a period modulation pattern (Fig. 8C) which contained two peaks each corresponding to a zero-crossing of the bias tone.
Fig. 8.
Temporal modulation pattern. A: temporal envelope of the CDT obtained from IFFT of the spectral contents within a 250 Hz wide window. Compared with the bias tone (lower trace), it can be observed that within one biasing cycle (between two consecutive dashed lines), there are two CDT peaks. Note: the CDT magnitude is larger but unstable in the tail of the waveform. B: spectrum of the envelope in panel A. Note: two outstanding peaks present at fbias (32 Hz) and 2fbias (64 Hz) indicating that a temporal pattern repeats twice every biasing cycle. C: period modulation pattern derived from averaging the CDT envelope over 28 biasing cycles. The CDT amplitude peaks twice within a biasing cycle each correlating to a zero-crossing of the bias tone (lower trace). Note: the second peak appears before the related zero-crossing and is smaller.
On average, a similar period modulation pattern presented in all ears at the five biasing frequencies (Fig. 9). In many cases, upward-going biasing pressure or loading of the cochlear partition yielded a larger CDT peak, while reducing pressure or unloading produced a smaller peak. The most typical modulation pattern presented at the lowest biasing frequency (25 Hz) where the CDT envelope for each half cycle was similar to the absolute value of the third derivative of a Boltzmann function, consisting of a center peak and two sidelobes (Fig. 7 top). For higher biasing frequencies, the period modulation patterns were more sinusoidal with rounded minima. The presence of the CDT peaks in the period modulation pattern often followed the zero-crossings of the bias tone in both loading and unloading directions. This timing of the CDT peaks was most typical for higher frequencies (> 50 Hz). However, it was commonly observed, especially at lower biasing frequencies, that the second CDT peak occurred before the zero-crossing of the biasing pressure during unloading (Fig. 8C and Fig.9 top). It seemed that cochlear partition displacement in the positive direction was less effective in suppressing the CDT. This observation is consistent with the asymmetry in the quasi-static modulation pattern which showed a shallower slope of CDT reduction in positive sound pressures (Fig. 5– Fig. 7 top).
Fig. 9.
Means ± standard errors of the period modulation patterns. The averaged bias tones within a period are shown in the lower right panel. Vertical grid lines indicate the phase of the bias tone with a 90° increment. Note: the first CDT peak is larger than the second, esp., at lower fbias. The first CDT peak lags the upward-going zero-crossing of the bias tone and the second peak leads the downward-going zero-crossing, except at high biasing frequencies.
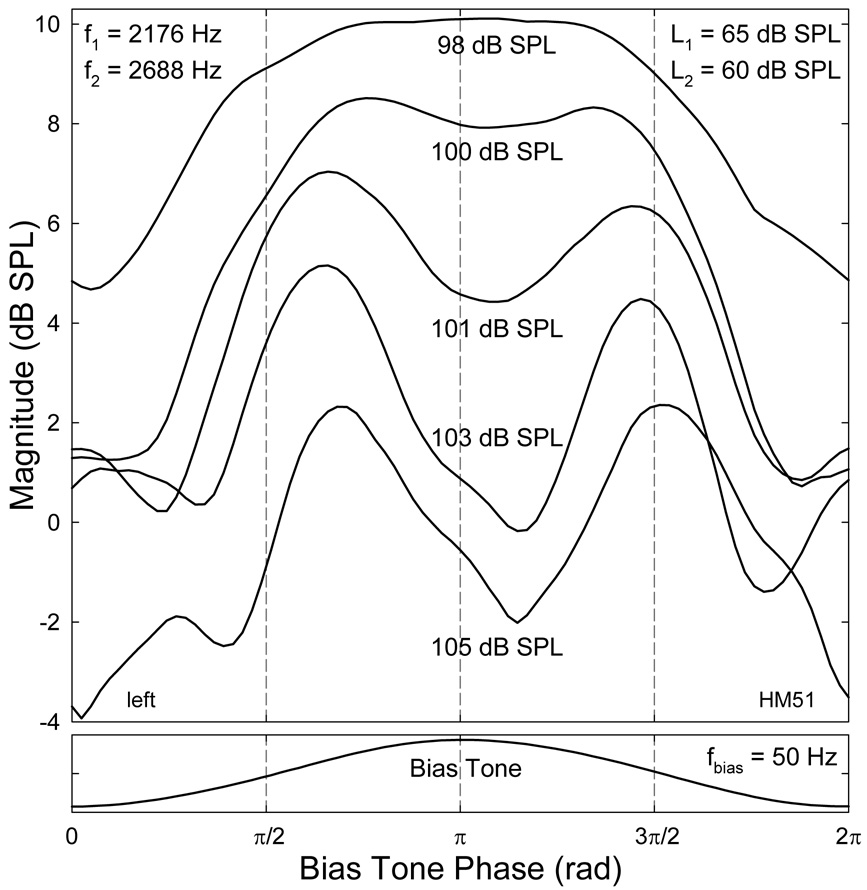
Systematic change in the Lbias also revealed progressively varying period modulation patterns (Fig. 10). Higher-level bias tones induced more suppression, as demonstrated by the reduction of CDT amplitude following the peaks and troughs of the bias tone. Each half of the period modulation pattern was more similar to the shape of the absolute value of the third derivative of the FTr (bottom curve). Lowering the Lbias only suppressed the CDT at the negative extremes of the biasing pressure, yielding a single wide peak of the CDT envelope with a relatively smaller modulation depth (top curve). This is correlated with a simple sinusoidal AM that contains fewer sidebands (< 2) on each side of the CDT as seen in the lower panels of Fig. 2. For moderately high biasing levels, the period modulation patterns showed a transition from double to single CDT peak (middle traces in Fig. 10). The modulation depth at the positive peak of the biasing pressure became progressively smaller than at the negative extremes. Moreover, due to the reduced biasing power, the second CDT peak appeared earlier than the zero-crossing of the biasing pressure in the downward swing.
Fig. 10.
Effect of the Lbias on the period modulation pattern of CDT. To reduce overlap, the top two traces are shifted up 2 and 1 dB and lower two traces shifted down 1 and 2 dB, respectively. When Lbias decreases (from bottom to top), three trends can be observed: 1) an increase in overall CDT magnitude; 2) emerging of the two CDT peaks; and 3) the second CDT peak reverses its delay to lead over the zero-cross of the bias tone (lower panel). Each half of the lowest trace resembles the absolute third derivative of the Boltzmann function. Vertical grid lines indicate the phase of the bias tone with a 90° increment.
IV. DISCUSSION
A. Suppression and modulation: two sides of a coin
A chief finding of the present study is that the effects of the bias tone on DPOAEs can be expressed in both time and frequency domains. In the time domain, the CDT is amplitude modulated and suppressed (Fig. 8–Fig. 10). Its spectral representation is a reduction of amplitude and generation of sidebands (Fig. 2). As the Lbias increases, the sideband amplitudes start to rise even before noticeable reductions in the CDT magnitude (Fig. 3). When the sidebands gradually reach their peaks, the CDT shows a significant reduction. These opposite changes in the amplitudes of DPOAE and its modulation sidebands have been observed in the acoustic modulation of electrically evoked otoacoustic emissions (EEOAEs) in lizards using an 84-Hz bias tone (Manley et al., 2001). They showed a 10 dB reduction in EEOAE accompanied with a more than 20 dB increase in LSBs and USBs when the Lbias was raised from 70 to 100 dB SPL. These effective biasing sound levels are comparable to the present study in humans.
A derivation of the spectral contents of AM in nonlinear systems (Bian, 2006) predicts that multiple sidebands present around the carrier frequency (fc) at fc ± n·fm, where n is an integer and fm is the modulator frequency. In the present study, various patterns of the sidebands are observed based on the relative strength of the bias tone and the CDT. The observation that the number and sizes sidebands grow with the Lbias (Fig. 2) has been consistently observed in studies focusing on the reverse transduction in the inner ear. In guinea pigs, Yates and Kirk (1998) described the presence of multiple sidebands at the interaction between the EEOAE frequency (fE) and the integer multiples of the acoustic fbias (fE ± n·fbias). When the EEOAE was enhanced by ATP, the number and magnitudes of the sidebands were reduced (Kirk, 2002), reflecting a reduced relative strength of the bias tone (Fig. 2 and Fig. 3). The sidebands I were increased when a stimulus-frequency OAE was modulated by an electrical current injected into the gerbil cochlea (Hubbard and Mountain, 1983), or an acoustic AM signal in humans (Neely et al., 2005). In low-frequency modulation of DPOAEs in gerbils (Bian, 2006), the magnitudes of the sidebands increased with both the bias tone and primary levels along with a suppression of CDT. The suppression and modulation are mostly observed below 65 dB SPL primary level, and above 106 dB SPL Lbias, given that CDT magnitudes in gerbils are more than 10 dB larger than in humans.
Suppression and distortion are among the essential nonlinearities of hearing universally presented in all species (Eguíluz et al., 2000). All of these nonlinear phenomena have been observed by studying two-tone interactions in the cochlea, e.g., suppression tuning, 2-tone suppression, and intermodulation DPs (Robles and Ruggero, 2001). Two- tone suppression can be categorized into: tonic and phasic suppressions (Geisler and Nuttall, 1997). The former refers to an overall reduction in the response at a characteristic frequency (CF, or fCF) by the presence of another tone, while the latter applies to temporal modulation of the CF response amplitude when the suppressor frequency (fs) is much lower (< 2 kHz). In the phasic suppression, reductions in the CF response occur at the maximal displacement of the BM in one or two directions (Rhode, 2007). Introducing a low-frequency suppressor is shown to generate spectral sidebands at fCF - fs and fCF - 2fs (Rhode and Cooper, 1993; Robles et al., 1997) and these sidebands rise and roll over as the CF amplitude response is suppressed. In addition, the peak of fCF - 2fs component occurs at a higher suppressor level than the fCF - fs in much the same fashion of DPOAE sidebands I and II depicted in Fig. 3. Similar behaviors of the CF and its sidebands are also observed in the auditory nerve response (Temchin et al., 1997). The CDT magnitude grows and falls as the L1 increases with fixed L2 (Gaskill and Brown, 1990; Whitehead et al., 1995; Mills, 2000) similar to the behavior of the modulation sidebands (Fig. 3). Simultaneously presented suppression and distortion are the two sides of the same coin: two-tone interference within a nonlinear cochlear transducer (Geisler et al., 1990). DPs are the spectral expressions of a temporal behavior of the cochlear transducer (Brown, 1994; van der Heijden, 2005; Bian, 2006), whereas suppression is the overall consequence of the saturating characteristic of the transducer: OHCs. Therefore, results of the present study provide some human correlates of the direct observations from the inner ears of experimental animals.
B. Comparison with previous results
1. Human studies
Low-frequency modulation of DPOAE in humans has been previously reported (Scholz et al., 1999) and recently measured in patients with Ménière’s disease (Hirschfelder et al., 2005). In both studies, the CDT amplitudes demonstrate a pattern with two maxima over one biasing cycle similar to the period modulation patterns found in the present study (Fig. 8 – Fig. 9). When the Lbias is reduced from 117 dB SPL at 32.8 Hz, the progressive changes of the modulation pattern are similar to Fig. 10. The smaller modulation depth at the positive biasing peaks observed in those studies is due to the higher primary frequencies adopted (from 2.5/3 to 5/6 kHz) then the present experiment. Placing a click at various phases of a 62 Hz tone, Zwicker (1981) showed that the varying amplitude of the evoked OAE formed a suppression-period pattern, which consisted of two maxima at low click levels and a single peak at higher levels like the effect reported in Fig. 10. These results indicate that strong bias tone can shift the OP of the cochlear partition traversing twice per cycle along the transducer curve, resulting in two maximal productions of OAEs at the inflection point. However, such an effect is influenced by the asymmetry in the cochlear partition motion, such that the suppression of cochlear response is less effective at the maximal displacement in the positive sound pressure direction.
There is a strong frequency effect in the modulation and suppression of CDT. Higher frequencies are more efficient meaning that lower Lbias is required to produce the same amount effect (Fig. 4). In a comparative study using humans and guinea pigs, Marquardt et al. (2007) measured the levels of the bias tone required to produce an equal modulation depth in the CDT amplitude and showed that the iso-modulation function for humans changes in two distinct slopes (6 and 12 dB/dB) separated by a local maximum located around 50 Hz. Thus, the 3-dB suppression function obtained in the present study (Fig. 4) is in close agreement with the human data of theirs and others (e.g., Kummer et al., 1995) given that this is essentially the very tail of a suppression tuning curve. The steeper slope of the biasing level-frequency function below 50 Hz may have potential contributions from several structures in the auditory periphery, e.g., the middle ear, the helicotrema, and the cochlear input impedance (Dallos, 1973; Cheatham and Dallos, 2001; Marquardt et al., 2007). These factors significantly reduce the influence of a very low frequency tone in the relatively basal region where DPOAEs are generated. An important implication of this frequency effect is that bias tones at higher frequencies are more efficient in modulating and suppressing DPOAEs, i.e., they can be achieved at much lower signal levels. This could be useful when applying the low-frequency technique to modulate DPOAEs evoked at higher primary frequencies, where the power of the bias tone cannot reach or producing extremely high sound pressures at a very low frequency is unpractical.
2. Animal studies
The results of the present study are in agreement with those of similar investigations in animals. In an early study of OAEs, the phase-dependent modulation of transient evoked OAEs showed variations of a double peaked pattern (Zwicker and Manley, 1981) that is comparable to the period modulation patterns reported here. Frank and Kössl (1996, 1997) first described the low-frequency modulation of DPOAEs in gerbils by noting that the peak CDT amplitude coincides with the zero-crossings of the bias tone. Variations in DPOAE amplitudes depending on the bias tone phase and primary levels are found in guinea pigs (Lukashkin and Russell, 2005). In a series of studies in gerbils (Bian et al., 2002, 2004; Bian, 2004, 2006), the temporal modulation patterns of DPOAEs demonstrate that the occurrence of the maximal CDT amplitudes corresponds to the zero-crossing of a 25-Hz bias tone with a small delay (< 1.4 ms). Moreover, the modulation pattern in one half biasing cycle contains a center peak and two sidelobes resembling the absolute third derivative of a sigmoid-shaped cochlear FTr. However, the period modulation patterns of CDT obtained from humans in the present study are less typical compared to the gerbil data, because the sidelobes are smaller even absent, esp., at the positive biasing peaks (Fig. 10). Furthermore, the onset of the second CDT peak is often before the zero-crossing during unloading resulting in the reduced modulation depth at the biasing peaks. These atypical variations of the modulation pattern could be attributed to the lower Lbias applied to larger human cochleae and the asymmetry in BM motion.
The asymmetry in low-frequency biasing can be better observed from the quasi-static modulation patterns shown in Fig. 5–Fig. 7. It is apparent that the slope of the modulation pattern is shallower on the positive sound pressure side. For a given BM displacement, motion in the positive pressures yields larger CDT magnitudes than in the negative direction. Displacement of the cochlear partition towards scala tympani (ST), indicated by negative organ-of-Corti cochlear microphonic (CM) in response to a bias tone (Cheatham and Dallos, 1994) or positive round-window CM, produces a larger suppression of cochlear potentials (Nieder and Nieder, 1971; Cheatham and Dallos, 1997). Moreover, enhancement of EEOAE and CM are found during the displacement of the BM towards scala vestibuli (SV) as marked by negative scala-media CM induced by an 86 Hz tone (Kirk and Yates, 1998) or by a force applied to the otic capsule (Zou et al., 2006). Therefore, it can be inferred from these results and the current observation of asymmetry in CDT modulation patterns that positive sound pressure applied to human ears corresponds to a BM displacement towards SV which opens the transduction channels, and vise versa. The derived cochlear transducer nonlinearity in humans is quite comparable to the results from gerbils (Bian et al., 2002). The Boltzmann parameters obtained from curve fitting (Fig. 7) fall in the ranges of the values from the gerbils, except parameter d whose absolute value is considerably larger. This could indicate that the FTr is more asymmetric in the human ears.
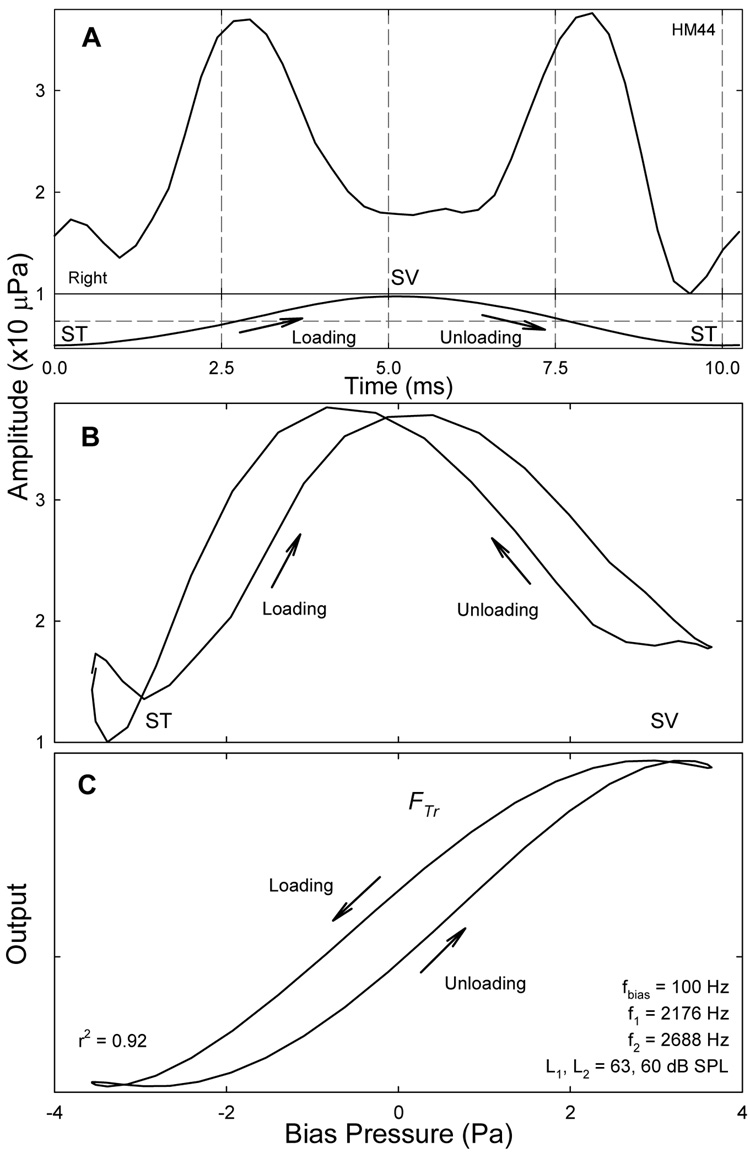
Despite the asymmetry, the period modulation pattern obtained at the highest Lbias often show equally delayed CDT peaks (Fig. 11A), esp., for higher biasing frequencies. Under these more effective biasing, the CDT remains suppressed and the second CDT peak does not appear until the transducer OP is shifted back through the resting position of the BM. The delays of the CDT maxima are about 0.5 ms for an fbias of 100 Hz (Fig. 11A) compared to a 1.4 ms delay observed with a 25 Hz bias tone in gerbils (Bian et al., 2004). Given that the primary frequencies used in the gerbil study are higher, the delay seems to correlate with the biasing frequency, meaning shorter delay for a higher fbias. When plotted as a function of the instantaneous biasing pressure, the varying CDT magnitude or the dynamic modulation pattern forms a hysteresis loop (Fig. 11B) similar to the double modulation pattern with separate peaks demonstrated in gerbils (Bian et al., 2004; Bian and Chertoff, 2006). This indicates that the underlying cochlear transducer is a double-valued sigmoid-shaped function forming a loop with a counterclockwise traversal (Fig. 11C). If positive sound pressure corresponds to a BM displacement towards SV where OHC transduction channels are open, then the reduction in CDT magnitude (Figs. 11A) indicates decreased force production or receptor current: a sign of adaptation. Therefore, the hysteresis could be accounted for by the force generation in the stereocilia that causes a re-closure of the ion channels during the “open” state (Hudspeth et al., 2000), esp., during large displacements. The result of adaptation in hair cell transduction is the shift of the FTr in the direction of the displacement (Eatock, 2000) with the cost of a time delay. The CDT peak delays seem to correlate with the adaptation time constants (Ricci et al., 2000).
Fig. 11.
Period modulation pattern and hysteresis. A: a period modulation pattern with both CDT peaks delayed (about 0.5 ms) the zero-crossing of the bias tone (lower trace). Note: displacement to SV (biasing peak) corresponds to a shallower notch in CDT amplitude; displacements to ST (troughs) result in deeper notches. B: the period modulation pattern plotted against the instantaneous biasing pressure shows a double modulation pattern with hysteresis. C: cochlear transducer hysteresis: fitting the double modulation pattern with the third derivative model incorporating with an active force production. Loading of cochlear partition results in the shift of the transducer curve to the positive sound pressures; unloading moves the curve to the negative pressures. The traversal of the hysteresis is counterclockwise.
C. Another source of 2f1-f2 DP
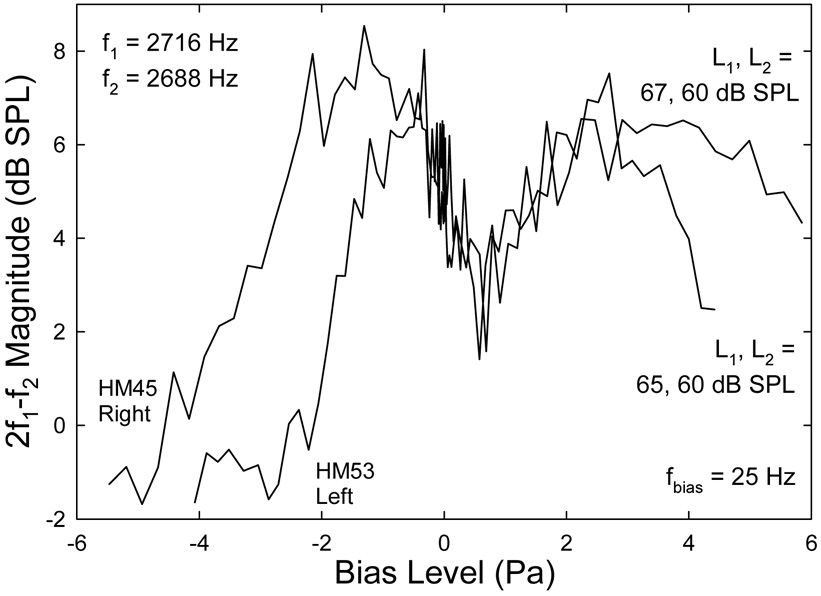
In a few occasions, esp., at lower biasing frequencies, an exceptional quasi-static modulation pattern of CDT is observed (Fig. 12) which shows the typical pattern of even-order DPs (Bian et al., 2002; Bian, 2004; Bian and Chertoff, 2006). This pattern is marked by a deep notch near zero biasing pressure that pinpoints to the inflection point of the nonlinear FTr. Biasing the cochlear partition in either direction can enhance the DP as indicated by the two peaks at roughly ±2 Pa. The modulation pattern also bears some features of the CDT, e.g., its amplitude is suppressed at both biasing extremes and the center notch is shifted in the positive sound pressure direction. Dropping in the primary levels during the experiment can be ruled out, because these levels were closely monitored during the 41 biasing steps. Therefore, the observed modulation pattern seems to reflect a mixture of odd and even DPs with the same frequency. It is possible that the interference between the second harmonic of f1 (i.e., 2f1) and the higher primary tone (f2) can generate a quadratic difference tone (QDT), an even-order DP, at the frequency of 2f1-f2 (Fahey et al., 2000). The original CDT produced by the two primaries (f1, f2) and the QDT can be summed in the ear canal (Fahey et al., 2006). If the QDT becomes dominant, the modulation pattern behaves like an even-order DP. This is especially true when L1 is greater than L2, since a higher L1 can potentially produce a 2f1 that is strong enough to interfere with f2. Even though the QDT was not found to affect CDT level when damaging the 2f1 place in guinea pigs (Withnell and Lodde, 2006), given a larger human cochlea and lower primary frequencies in the present study, more hair cells on the BM could involve in the harmonic mechanism to produce a sizable QDT at 2f1-f2. This suggests that the standard stimulus paradigm using greater L1 to maximize the CDT magnitude should be exercised with caution to avoid unwanted contamination of catalytic DPs.
Fig. 12.
Exceptional quasi-static modulation patterns of 2f1-f2 DPOAE showing the characteristics of even-order DPs. Note the deep notches at the center of the modulation patterns. The position of the notch is shifted away from zero Pa in the positive sound pressure direction. The peak in the negative sound pressures is higher than the one on the positive side in contrary to the typical pattern of CDT.
VI. SUMMARY AND CONCLUSION
Low-frequency modulation of DPOAEs was measured from the humans under different biasing conditions. In the frequency domain, increasing the Lbias resulted in a suppression of the CDT and a generation of modulation sidebands. Higher frequency bias tones were more efficient in producing the suppression and modulation. Quasi-static modulation patterns derived from measuring the CDT amplitude at the extremes of multiple bias tones showed a bell-shaped pattern with marked asymmetry. The modulation patterns were correlated well with the absolute value of the third derivative of a cochlear FTr. This is important in the clinical applications to quantitatively estimate the cochlear transducer nonlinearity. In the time domain, period modulation patterns obtained from the DPOAE envelope over one biasing cycle showed two CDT amplitude peaks each corresponding to the zero-crossings of the bias tone. Systematic variation in the Lbias showed progressive changes in the double-peaked modulation pattern that were consistent with cyclic shifting of the cochlear transducer OP and the asymmetry in the motion of inner ear structures. Thus far, the previous results in low-frequency modulation of CDT in gerbils (Bian et al., 2002, 2004; Bian, 2006) have been replicated in humans. Results of the study shed a light on the nonlinear generating mechanisms of DPs in the cochlea by revealing the simultaneous suppression and modulation of two tone interaction (Rhode and Cooper, 1993). Moreover, the results of the present study suggest that this technique could potentially be applied in the differential diagnosis of cochlear pathologies. The noninvasive nature and the experimental paradigm of the low-frequency biasing technique make it a valuable tool for investigation of human cochlear mechanics and development of new clinical applications.
ACKNOWLEDGMENTS
Kelly Watts is acknowledged for assisting in the pilot study of this project and help in recruiting subjects. Comments and suggestions from Terry Wiley are appreciated. The authors thank the clinical staff in the Department of Speech and Hearing Science at ASU for sharing their equipment and the subjects for participating in the study. This work was supported by a grant (R03 DC006165) from the National Institute on Deafness and Other Communication Disorders of the NIH.
Footnotes
PACS numbers: 43.64Jb, 43.64.Kc, 43.64.Bt [BLM]
REFERENCES
- Bian L. Spectral fine-structures of low-frequency modulated distortion product otoacoustic emissions. J. Acoust. Soc. Am. 2006;119:3872–3885. doi: 10.1121/1.2200068. [DOI] [PubMed] [Google Scholar]
- Bian L. Cochlear compression: Effects of low-frequency biasing on quadratic distortion product otoacoustic emission. J. Acoust. Soc. Am. 2004;116:3559–3571. doi: 10.1121/1.1819501. [DOI] [PubMed] [Google Scholar]
- Bian L, Chertoff ME. Modulation patterns and hysteresis: Probing cochlear dynamics with a bias tone. In: Nuttall AL, et al., editors. Auditory Mechanisms: Processes and Models. Singapore: World Scientific; 2006. pp. 93–100. [Google Scholar]
- Bian L, Chertoff ME, Miller E. Deriving a cochlear transducer function from low-frequency modulation of distortion product otoacoustic emissions. J. Acoust. Soc. Am. 2002;112:198–210. doi: 10.1121/1.1488943. [DOI] [PubMed] [Google Scholar]
- Bian L, Linhardt EE, Chertoff ME. Cochlear hysteresis: Observation with low-frequency modulated distortion product otoacoustic emissions. J. Acoust. Soc. Am. 2004;115:2159–2172. doi: 10.1121/1.1690081. [DOI] [PubMed] [Google Scholar]
- Brown AM. Modulation of the hair cell motor: A possible source of odd-order distortion. J. Acoust. Soc. Am. 1994;96:2210–2215. doi: 10.1121/1.410161. [DOI] [PubMed] [Google Scholar]
- Cheatham MA, Dallos P. Inner hair cell response patterns: Implications for low-frequency hearing. J. Acoust. Soc. Am. 2001;110:2034–2044. doi: 10.1121/1.1397357. [DOI] [PubMed] [Google Scholar]
- Cheatham MA, Dallos P. Low-frequency modulation of inner hair cell and organ of Corti responses in the guinea pig cochlea. Hear. Res. 1997;108:191–212. doi: 10.1016/s0378-5955(97)00032-4. [DOI] [PubMed] [Google Scholar]
- Cheatham MA, Dallos P. Stimulus biasing: A comparison between cochlear hair cell and organ of corti response patterns. Hear. Res. 1994;75:103–113. doi: 10.1016/0378-5955(94)90061-2. [DOI] [PubMed] [Google Scholar]
- Dallos P. The Auditory Periphery: Biophysics and Physiology. NY: Academic Press; 1973. Cochlear mechanics; pp. 127–217. [Google Scholar]
- Eatock RA. Adaptation in hair cells. Annu. Rev. Neurosci. 2000;23:285–314. doi: 10.1146/annurev.neuro.23.1.285. [DOI] [PubMed] [Google Scholar]
- Eguíluz VM, Ospeck M, Choe Y, Hudspeth AJ, Magnasco MO. Essential nonlinearities in hearing. Phys. Rev. Lett. 2000;84:5232–5235. doi: 10.1103/PhysRevLett.84.5232. [DOI] [PubMed] [Google Scholar]
- Fahey PF, Stagner BB, Martin GK. Mechanism for bandpass frequency characteristic in distortion product otoacoustic emission generation. J. Acoust. Soc. Am. 2006;119:991–996. doi: 10.1121/1.2146088. [DOI] [PubMed] [Google Scholar]
- Fahey PF, Stagner BB, Lonsbury-Martin BL, Martin GK. Nonlinear interaction that could explain distortion product interference response areas. J. Acoust. Soc. Am. 2000;108:1786–1802. doi: 10.1121/1.1308048. [DOI] [PubMed] [Google Scholar]
- Frank G, Kössl M. The acoustic two-tone distortions 2f1-f2 and f2-f1 and their possible relation to changes in the operating point of the cochlear amplifier. Hear. Res. 1996;98:104–115. doi: 10.1016/0378-5955(96)00083-4. [DOI] [PubMed] [Google Scholar]
- Frank G, Kössl M. Acoustic and electrical biasing of the cochlear partition. Effects on the acoustic two tone distortions f2-f1 and 2f1-f2. Hear. Res. 1997;113:57–68. doi: 10.1016/s0378-5955(97)00131-7. [DOI] [PubMed] [Google Scholar]
- Gaskill SA, Brown AM. The behavior of the acoustic distortion product, 2f1-f2, from the human ear and its relation to auditory sensitivity. J. Acoust. Soc. Am. 1990;88:821–839. doi: 10.1121/1.399732. [DOI] [PubMed] [Google Scholar]
- Geisler CD, Nuttall AL. Two-tone suppression of basilar membrane vibrations in the base of the guinea pig cochlea using ‘low-side’ suppressors. J. Acoust. Soc. Am. 1997;102:430–440. doi: 10.1121/1.419765. [DOI] [PubMed] [Google Scholar]
- Geisler CD, Yates GK, Patuzzi RB, Johnstone BM. Saturation of outer hair cell receptor current causes two-tone suppression. Hear. Res. 1990;44:241–256. doi: 10.1016/0378-5955(90)90084-3. [DOI] [PubMed] [Google Scholar]
- Hirschfelder A, Gossow-Müller-Hohenstein E, Hensel J, Scholz G, Mrowinski D. Diagnosis of endolymphatic hydrops using low frequency modulated DPOAE. HNO. 2005;53:612–617. doi: 10.1007/s00106-004-1171-4. [DOI] [PubMed] [Google Scholar]
- Hubbard AE, Mountain DC. Alternating current delivered into the scala media alters sound pressure at the eardrum. Science. 1983;222:510–512. doi: 10.1126/science.6623090. [DOI] [PubMed] [Google Scholar]
- Hudspeth AJ, Choe Y, Mehta AD, Martin P. Putting ion channels to work: Mechanoelectrical transductioin, adaptatioin, and amplification by hair cells. Proc. Natl. Acad. Sci. U.S.A. 2000;97:11765–11772. doi: 10.1073/pnas.97.22.11765. [DOI] [PMC free article] [PubMed] [Google Scholar]
- Johnson TA, Neely ST, Kopun JG, Gorga MP. Reducing reflected contributions to ear-canal distortion product otoacoustic emissions in humans. J. Acoust. Soc. Am. 2006;119:3896–3907. doi: 10.1121/1.2200048. [DOI] [PMC free article] [PubMed] [Google Scholar]
- Kemp DT. Stimulated acoustic emissions from within the human auditory system. J. Acoust. Soc. Am. 1978;64:1386–1391. doi: 10.1121/1.382104. [DOI] [PubMed] [Google Scholar]
- Kemp DT. The basics, the science, and the future potential of otoacoustic emissions. In: Robinette MS, Glattke TJ, editors. Otoacoustic Emissions: Clinical Applications. 3rd Ed. NY: Thieme; 2007. pp. 7–42. [Google Scholar]
- Kirk DL. Interaction between adenosine triphosphate and mechanically induced modulation of electrically evoked otoacoustic emissions. J. Acoust. Soc. Am. 2002;111:2749–2758. doi: 10.1121/1.1448315. [DOI] [PubMed] [Google Scholar]
- Kirk DL, Yates GK. Enhancement of electrically evoked oto-acoustic emissions associated with low-frequency stimulus bias of the basilar membrane towards scala vestibuli. J. Acoust. Soc. Am. 1998;104:1544–1554. doi: 10.1121/1.424365. [DOI] [PubMed] [Google Scholar]
- Knight RD, Kemp DT. Wave and place fixed DPOAE maps of the human ear. J. Acoust. Soc. Am. 2001;109:1513–1525. doi: 10.1121/1.1354197. [DOI] [PubMed] [Google Scholar]
- Kummer P, Janssen T, Arnold W. Suppression tuning characteristics of the 2 f1-f2 distortion-product otoacoustic emission in humans. J. Acoust. Soc. Am. 1995;98:197–210. doi: 10.1121/1.413747. [DOI] [PubMed] [Google Scholar]
- Liberman MC, Gao J, He DZZ, Wu X, Jia S, Zou J. Prestin is required for electromotility of the outer hair cell and for the cochlear amplifier. Nature (London) 2002;419:300–304. doi: 10.1038/nature01059. [DOI] [PubMed] [Google Scholar]
- Lonsbury-Martin BL, Martin GK. Otoacoustic emissions. Curr. Opin. Otolaryngol. Head Neck Surg. 2003;11:361–366. doi: 10.1097/00020840-200310000-00009. [DOI] [PubMed] [Google Scholar]
- Lukashkin AN, Russell IJ. Dependence of the DPOAE amplitude pattern on acoustical biasing of the cochlear partition. Hear. Res. 2005;203:45–53. doi: 10.1016/j.heares.2004.11.011. [DOI] [PubMed] [Google Scholar]
- Marquardt T, Hensel J, Mrowinski D, Scholz G. Low-frequency characteristics of human and guinea pig cochleae. J. Acoust. Soc. Am. 2007;121:3628–3638. doi: 10.1121/1.2722506. [DOI] [PubMed] [Google Scholar]
- Manley GA, Kirk DL, Köppl C, Yates GK. In vivo evidence for a cochlear amplifier in the hair-cell bundle of lizards. Proc. Natl. Acad. Sci. 2001;98:2826–2831. doi: 10.1073/pnas.041604998. [DOI] [PMC free article] [PubMed] [Google Scholar]
- Mills DM. Frequency responses of two- and three-tone distortion product otoacoustic emissions in Mongolia gerbils. J. Acoust. Soc. Am. 2000;107:2586–2602. doi: 10.1121/1.428646. [DOI] [PubMed] [Google Scholar]
- Neely ST, Johnson TA, Garner CA, Gorga MP. Stimulus-frequency otoacoustic emissions measured with amplitude-modulated suppressor tones. J. Acoust. Soc. Am. 2005;118:2124–2127. doi: 10.1121/1.2031969. [DOI] [PMC free article] [PubMed] [Google Scholar]
- Rhode WS. Mutual suppression in the 6 kHz region of sensitive chinchilla cochleae. J. Acoust. Soc. Am. 2007;121:2805–2818. doi: 10.1121/1.2718398. [DOI] [PubMed] [Google Scholar]
- Rhode WS, Cooper NP. Two-tone suppression and distortion product on the basilar membrane in the hook region of cat and guinea pig cochleae. Hear. Res. 1993;66:31–45. doi: 10.1016/0378-5955(93)90257-2. [DOI] [PubMed] [Google Scholar]
- Nieder P, Nieder I. Determination of microphonic generator transfer characteristic from modulation data. J. Acoust. Soc. Am. 1971;49:478–492. [Google Scholar]
- Ricci AJ, Crawford AC, Fettiplace R. Active hair bundle motion linked to fast transducer adaptation in auditory hair cells. J. Neurosci. 2000;20:7131–7142. doi: 10.1523/JNEUROSCI.20-19-07131.2000. [DOI] [PMC free article] [PubMed] [Google Scholar]
- Robles L, Ruggero MA. Mechanics of the mammalian cochlea. Physiol. Rev. 2001;81:1305–1352. doi: 10.1152/physrev.2001.81.3.1305. [DOI] [PMC free article] [PubMed] [Google Scholar]
- Robles L, Ruggero MA, Rich NC. Two-tone distortion on the basilar membrane of the chinchilla cochlea. J. Neurophysiol. 1997;77:2385–2399. doi: 10.1152/jn.1997.77.5.2385. [DOI] [PMC free article] [PubMed] [Google Scholar]
- Scholz G, Hirschfelder A, Marquardt T, Hensel J, Mrowinski D. Low-frequency modulation of the 2f1-f2 distortion product otoacoustic emissions in the human ears. Hear. Res. 1999;130:189–196. doi: 10.1016/s0378-5955(99)00010-6. [DOI] [PubMed] [Google Scholar]
- Shera CA, Guinan JJ., Jr Evoked otoacoustic emissions arise by two fundamentally different mechanisms: a taxonomy for mammalian OAEs. J. Acoust. Soc. Am. 1999;105:782–798. doi: 10.1121/1.426948. [DOI] [PubMed] [Google Scholar]
- Temchin AN, Rich NC, Ruggero MA. Low-frequency suppression of auditory nerve responses to characteristic tones. Hear. Res. 1997;113:29–56. doi: 10.1016/s0378-5955(97)00129-9. [DOI] [PMC free article] [PubMed] [Google Scholar]
- van der Heijden M. Cochlear gain control. J. Acoust. Soc. Am. 2005;117:1223–1233. doi: 10.1121/1.1856375. [DOI] [PubMed] [Google Scholar]
- Whitehead ML, Stagner BB, McCoy MJ, Lonsbury-Martin BL, Martin GK. Dependence of distortion-product otoacoustic emissions on primary levels in normal and impaired ears. II. Asymmetry in L1,L2 space. J. Acoust. Soc. Am. 1995;97:2359–2377. doi: 10.1121/1.411960. [DOI] [PubMed] [Google Scholar]
- Withnell RH, Lodde J. In search of basal distortion product generators. J. Acoust. Soc. Am. 2006;120:2116–2123. doi: 10.1121/1.2338291. [DOI] [PubMed] [Google Scholar]
- Yates GK, Kirk DL. Cochlear electrically evoked emissions modulated by mechanical transduction channels. J. Neurosci. 1998;18:1996–2003. doi: 10.1523/JNEUROSCI.18-06-01996.1998. [DOI] [PMC free article] [PubMed] [Google Scholar]
- Zou Y, Zheng J, Ren T, Nuttall A. Cochlear transducer operating point adaptation. J. Acoust. Soc. Am. 2006;119:2232–2241. doi: 10.1121/1.2173517. [DOI] [PubMed] [Google Scholar]
- Zwicker E. Masking-period patterns and cochlear acoustical responses. Hear. Res. 1981;4:195–202. doi: 10.1016/0378-5955(81)90006-x. [DOI] [PubMed] [Google Scholar]
- Zwicker E, Manley G. Acoustical responses and suppression-period patterns in guinea pigs. Hear. Res. 1981;4:43–52. doi: 10.1016/0378-5955(81)90035-6. [DOI] [PubMed] [Google Scholar]


