

Summary
Arf, Hdm2 and p53 regulate the tumor suppressor pathway that is most frequently disrupted in human cancer. In the absence of tumorigenic stress, Hdm2 actively attenuates p53-dependent cell cycle arrest and apoptosis by mediating ubiquitination-dependent degradation of p53. Mitogenic stress activates Arf, which indirectly activates p53 by binding to and nullifying the anti-p53 activities of Hdm2. Small, conserved domains within Arf and Hdm2 mediate their direct interaction. Individually, these domains are intrinsically unstructured and, when combined in vitro, they co-fold into bi-molecular oligomeric structures that, in some features, resemble amyloid fibrils. Detailed structural characterization of Arf/Hdm2 complexes has previously been hampered by their heterogeneity and large size. Here, we report that a 9-residue fragment of the N-terminus of mouse Arf (termed A1-mini) co-folds specifically with the Arf-binding domain of Hdm2 to form bi-molecular oligomers. We characterized these unprecedented structures using analytical ultracentrifugation and NMR spectroscopy, providing insights into their structural organization. The A1-mini peptide not only binds specifically to Hdm2 in vitro, but also recapitulates the nucleolar localization features of full-length Arf in cells. Further, larger fragments of Arf that contain the A1-mini segment have previously been shown to activate p53 in mouse and human cells. Our studies provide the first insights into the molecular basis through which Arf nullifies the p53-inhibiting activity of Hdm2, indirectly activating the tumor suppressor function of p53 in mammalian cells.
Keywords: Intrinsically unstructured protein, bi-molecular oligomers, protein NMR, tumor suppressor
Introduction
The Arf tumor suppressor (p14Arf in humans, p19Arf in mice) is activated by abnormal mitogenic signaling in mammalian cells, e.g. through activation of the Ras1, Myc2, E2F13, or BCR-ABL4 oncogenes. Arf prevents tumorigenesis through p53-dependent and -independent mechanisms4. In the absence of mitogenic signals, Hdm2 (Mdm2 in mice) inhibits p53-dependent cell cycle arrest or apoptosis via a negative feedback mechanism4. Upon oncogene activation Arf is expressed and directly binds Hdm2. Several studies suggested that the Arf/Hdm2 complex is sequestered in nucleoli where Hdm2 can no longer inhibit p53 activity5; 6. However, while their direct association is required, nucleolar co-localization of Arf and Hdm2 is dispensable for p53 activation7; 8. Arf loss is associated with tumorigenesis in mice9 and genetic loss or silencing of Arf is frequently observed in human cancer10. Moreover, Arf function is overridden in 5–10% of all human cancers through Hdm2 over-expression11. Thus, maintaining the integrity of the Arf-Hdm2-p53 pathway is critical for tumor suppression. Knowledge of the physical basis of Arf and Hdm2 interactions will provide critical mechanistic insights into the most commonly altered pathway in human cancer 4.
p19Arf and p14Arf are comprised of 22% and 18% arginine residues, respectively, and do not exhibit significant sequence similarity to other proteins. This high Arg content is associated with the ability to interact with more than 25 other proteins 4, often through the formation of hetero-oligomers in vitro and in vivo 12. For example, Arf forms hetero-oligomers (2–5 MDa) in nucleoli with nucleophosmin (Npm)13 and forms β-strand-rich, hetero-oligomers when bound to Hdm214; 15. Previous studies have shown that a ~60-residue N-terminal fragment of Arf encoded by exon 1β recapitulates the functions of full-length Arf mediated through interactions with Hdm25, N-Myc and c-Myc16, and Npm17. Further, a 37-residue intrinsically unstructured N-terminal fragment of p19Arf (mArf-N37)18 bound to Mdm2 and caused p53-dependent cell cycle arrest in mouse fibroblasts6; 18. Finally, a peptide comprised of residues 1–20 of p14Arf fused to green fluorescent protein (GFP) interacted with Hdm2 and activated p53 in vivo19; 20. The first 13 residues are highly conserved amongst mammalian Arf sequences, highlighting their importance in Arf-mediated tumor suppression (Fig. 1A).
Fig. 1.

The sequences of the segments of Arf (A) and Hdm2 (B) that are responsible for their interactions are highly conserved in mammals. (A) Alignment of the amino acid sequence of exon 1β of human Arf (p14Arf) with sequences from other mammalian species (accession codes: human, AAA82236; pig, NP998900; cattle, XP873468; golden hamster, AAN75824; house mouse, Q64364; Norway rat, Q8QZZ9; gray short-tailed opossum, NP001028145). The A1 and A2 segments that have been shown to mediate interactions of p14Arf and mouse Arf (p19Arf) with Hdm2 are indicated at the top. The coloring scheme is as follows: basic residues, blue; acidic residues, red; hydrophobic residues, brown; and small and polar residues, black. Residues conserved at a position in five or more species are shown in bold; residues that are similar in type to another represented in bold are shown in bold, green color. Below the consensus sequence, the degree of conservation at each amino acid position is indicated as follows: two asterisks indicate a position with the identical residue in all species; two “+” symbols indicate a position with identical residues at five or more positions, with the remaining sequences exhibiting similar residues; a single “+” symbol indicates a position with identical residues at five or more positions. (B) Alignment of the amino acid sequence of the Arf binding domain of Hdm2 (Hdm2-ABD) with the similar segment of sequences from other mammalian species (accession codes: human, NP002383; pig, NP001098773; cattle, NP001092577; golden hamster, Q60524; house mouse, AAH92270; Norway rat, NP001101569; gray short-tailed opossum, XP_001373571). The H1 and H2 segments that have been shown to mediate interactions with p14Arf and p19Arf are indicated at the top. The color scheme and other nomenclature are as given in (A).
Hdm2 is comprised of p53 binding (residues 26-108)21, C4 zinc finger (residues 297-329)22, and C2H2C4 RING domains (residues 429-491)23 that are connected by intrinsically unstructured linker segments. Hdm2 inhibits p53 through two mechanisms: 1) the N-terminal domain binds the p53 transcriptional activation domain, inhibiting p53-dependent gene transcription 24, and 2) the E3 ubiquitin ligase RING domain poly-ubiquitinates p53, promoting its degradation by the 26S proteasome 25; 26. Arf inhibits Hdm2-dependent inactivation of p53 by binding to an Hdm2 domain spanning residues 210-304 (termed Hdm2-ABD) 6; 14. The human and mouse sequences of this segment are 89% identical and are enriched in acidic residues (32% Asp/Glu in Hdm2) (Fig. 1B). Mapping studies revealed that Arf and Hdm2 each contain two conserved segments that mediate their interaction 14; these are A1 (residues 3-10) and A2 (residues 21-29) of p19Arf, and H1 (residues 235-259) and H2 (residues 270-289) of Hdm2 14. Segments A1 and A2 exhibit a conserved motif comprised of 5 mostly hydrophobic residues flanked by Arg residues18 (Fig. 1A). In contrast, segments H1 and H2 of Hdm2 are rich in acidic amino acids and H1, in particular, exhibits a conserved, alternating pattern of acidic (or hydrophilic) residues and hydrophobic residues14 (Fig. 1B).
The domains of Arf and Hdm2 shown to mediate their interactions in vivo, mArf-N37 and Hdm2-ABD, are intrinsically unstructured in isolation14; 18. When combined in solution, however, these polypeptides co-assembled to form β-strand-rich, supramolecular structures which, under certain conditions, resemble amyloid fibrils14. Detailed structural characterization of these co-assemblies using either NMR spectroscopy or X-ray crystallography was not feasible14; 15; 27. To overcome this difficulty, we studied complexes formed by co-assembly of a peptide containing a single Arg-rich motif (residues 2-10 of p19Arf) (Fig. 1A) and Hdm2-ABD. The resulting co-assemblies, while recapitulating many of the structural hallmarks of those comprised of larger fragments of Arf, remained soluble at high concentration (> 1 mM). We report herein detailed characterization of A1-mini/Hdm2-ABD co-assemblies using CD, NMR spectroscopy and analytical ultracentrifugation (AUC), providing the first insights into the structural organization of these bi-molecular, β-strand-rich oligomers. In addition, we show that fluorescently tagged A1-mini exhibited nucleolar localization in mouse fibroblasts and, in some cells, was co-localized with endogenous Mdm2. Overall, these data suggest strongly that Arf inhibits Hdm2 through the formation of bi-molecular, β-strand-rich oligomeric structures.
Results
A1-mini and Hdm2-ABD co-fold into β-strands
A 15-residue peptide containing the A1 segment of p14Arf was previously shown to co-assemble with Hdm2-ABD14 or a 15-residue peptide containing the H1 segment of Hdm215 into bi-molecular, β-strand-rich oligomeric structures. These structures, however, could not be studied by solution NMR spectroscopy due to their large size and poor solubility. Consequently, we surveyed the Hdm2-ABD co-assembly properties of several truncated A1 peptides (containing 7-15 residues). A peptide containing residues 2-10 of p19Arf (termed A1-mini; Fig. 1A, shaded gray) formed soluble β-strands with Hdm2-ABD, with maximal β-strand content observed at a 1:4 (Hdm2-ABD:A1-mini) molar ratio (Fig. 2A). Residues 2-10 of p19Arf and p14Arf are 78% identical (Fig. 1A). In contrast, a longer, 15-residue peptide containing the A1 segment of p14Arf 15 and mArf-N37, containing the A1 and A2 segments of p19Arf 14, induced maximal β-strand content with Hdm2-ABD at 1:1 molar ratios. Complete conversion of Hdm2-ABD from disordered conformations to β-strand secondary structure occurred through the addition of 1 molar equivalent of mArf-N37 at Hdm2-ABD concentrations of 10 μM, or greater14. Therefore, we estimate that the effective Kd value for the binding of mArf-N37 to Hdm2-ABD is on the order of 10 μM, or less. In contrast, a four-fold molar excess of A1-mini and a higher concentration of Hdm2-ABD (100 μM, or greater) were required for complete conversion of Hdm2-ABD/A1-mini bi-molecular oligomers to β-strand secondary structure. Based on this, we estimate that the effective Kd value for the binding of A1-mini to Hdm2-ABD is on the order of 200 μM. Despite its apparent weakened interactions, A1-mini does appear to bind specifically to the H1 and H2 segments of Hdm2-ABD, as demonstrated by complete abrogation of co-assembly by deletion of the H1 and/or H2 segments of Hdm2-ABD (Suppl. Fig. 1). With reference to Hdm2/Arf interactions, we use the term “specific binding” to mean interactions that require specific, conserved sequences within Hdm2 (H1 and/or H2) and Arf (A1 and/or A2), and that lead to the formation of β-strand-rich, bi-molecular oligomers14; 15; 28. Further, results from CD-based binding assays using 15-residue mouse A1 peptides with single glycine substitutions indicated that Arg residues at positions 3, 4 and 10 were required for specific binding to Hdm2-ABD (Suppl. Fig. 2), suggesting that A1-mini, which contains these residues, specifically recognized Hdm2-ABD in the same manner as longer Arf peptides. Past studies have indicated that the Arg residues within the A1 and A1-mini peptides must be maintained in the context of a conserved motif, referred to as the Arf motif14, with Arg residues separated by 5 or 6 primarily hydrophobic residues. For example, several other segments of either human or mouse Arf contain two or three Arg residues within a window of 15 amino acids. However, only peptides (15 amino acids in length) which contained the Arf motif were shown to bind to Hdm2-ABD14. These observations indicate that the multiple Arg residues within the Arf motif are not the sole mediators of interactions with Hdm2-ABD. Together, these results demonstrate that A1-mini binds specifically to the H1 and H2 segments of Hdm2-ABD to form β-strand-rich, bi-molecular oligomers.
Fig. 2.
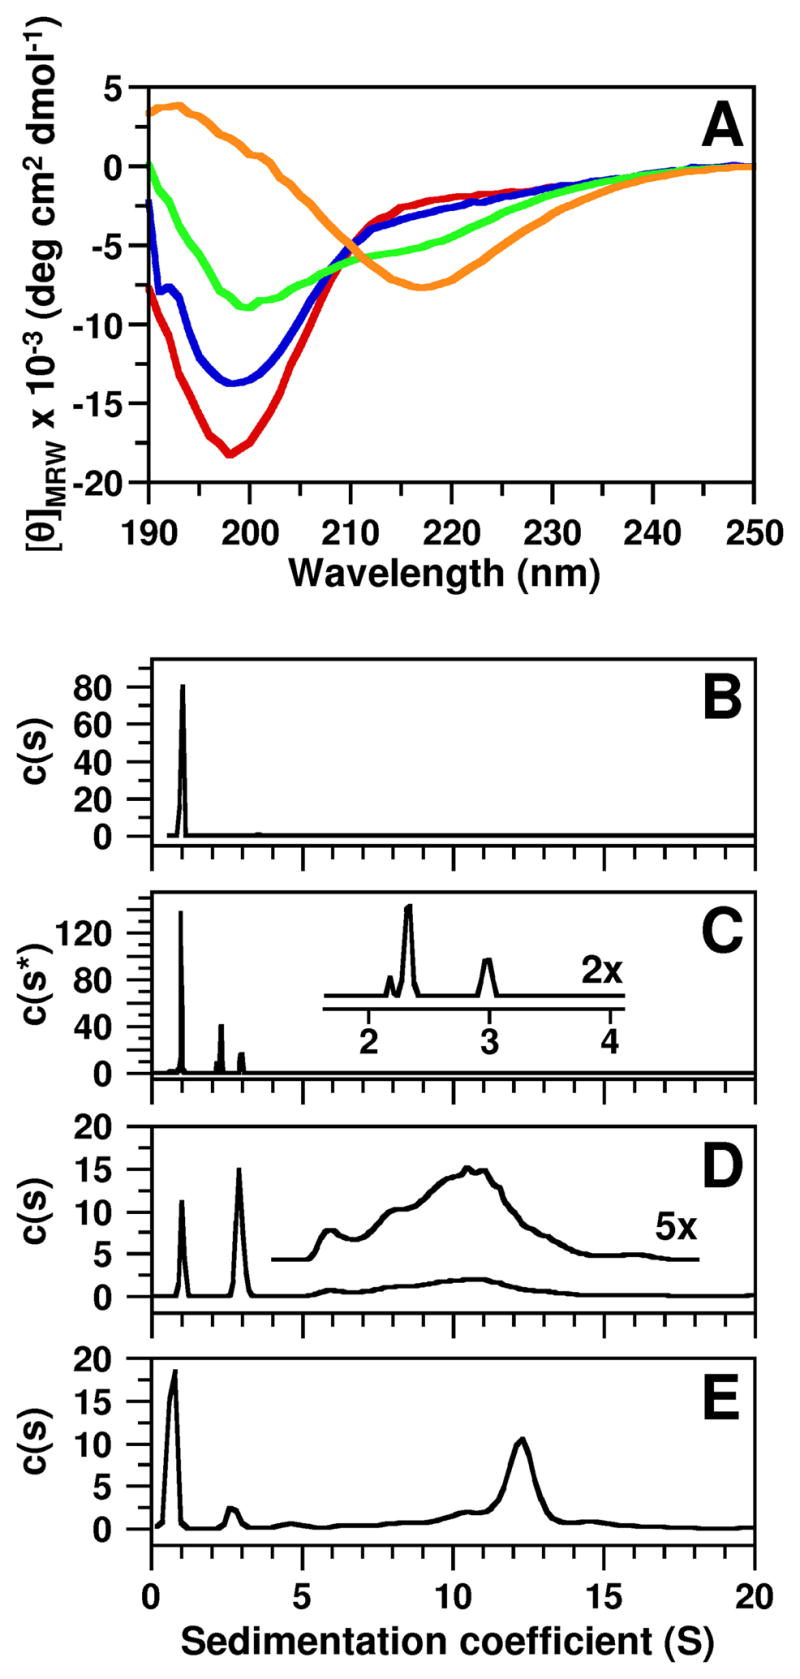
Hdm2-ABD and Arf A1-mini co-fold into discrete, β-strand-rich bi-molecular oligomers. (A) CD spectra of Hdm2-ABD alone (red) and in the presence of 1:1 (blue), 1:4 (green), and 1:6 (orange) molar equivalents of A1-mini. (B-E) Results of sedimentation velocity analytical ultracentrifugation (AUC) experiments with (B) 0.5 mM Hdm2-ABD, (C) 0.25 mM Hdm2-ABD mixed with 1 or (D) 4 molar equivalents of A1-mini, and (E) 1 mM Hdm2-ABD mixed with 4 molar equivalents of A1-mini. Results were obtained at 20 °C in 10 mM sodium phosphate (pH 6.0) with (B-D) 10 mM NaCl or (E) 150 mM NaCl. The units for the y-axes in (B-E) are Fringes/S. The traces illustrated in (B, D, and E) were obtained using the c(s) distribution model while that illustrated in (C) was obtained using the two-dimensional c(s, f/f0) distribution model. The y-axis parameter in (C), which is independent of the f/f0-value for sedimenting species, is shown as the general c(s*) distribution rather than the c(s) distribution. The inset in (C) shows an expansion of the region between s-values of 2–4 S with the y-axis scale increased two-fold (2x) and the inset in (D) shows the region immediately below with the y-axis scale increased five-fold (5x).
A1-mini and Hdm2-ABD form discrete oligomers
Sedimentation velocity analysis using analytical ultracentrifugation is a hydrodynamic method that allows particles to be separated on a size-dependent basis with high resolution. Sedimentation velocity analysis showed that Hdm2-ABD exhibited a sedimentation coefficient (s) value of 1.0 S and frictional ratio (f/f0) of 2.18 (Fig. 2B), consistent with a monomeric molecular mass of ~10,900 Da (10,914 Da theoretical) and a highly extended, non-globular conformation consistent with its intrinsically disordered nature14. The sedimentation coefficient is the rate of sedimentation per unit centrifugal field for a particle and the frictional ratio is the ratio of the translational frictional coefficient of the particle to that of a spherical particle of the same mass and volume29. While the sedimentation coefficient is related in a complex way to molecular mass, the frictional ratio is related to molecular shape, with elongated particles generally exhibiting (f/f0) values > 1.529. A1-mini also sedimented as a monomer (data not shown). However, when mixed, A1-mini and Hdm2-ABD co-folded into oligomers whose sizes depended upon the A1-mini:Hdm2-ABD molar ratio and the concentrations of the two species. For example, at 0.25 mM and 1:1 molar ratio, A1-mini and Hdm2-ABD co-assembled into two principal species with s-values of 2.3 S (f/f0-value, 1.82; 25% by weight) and 3.0 S (f/f0-value, 2.20; 13% by weight) (Fig. 2C and Suppl. Fig. 3). These two species sedimented with a more abundant species which exhibited the features of free Hdm2-ABD (s-value, 1.0 S and f/f0 value, 2.20; 62% by weight). Analysis of the sedimentation data, however, suggested that the latter species may also include a small amount of a 1:1 Hdm2-ABD/A1-mini oligomer which rapidly exchanges with free Hdm2-ABD (data not shown). Given the existence of multiple species with varied hydrodynamic features, the primary sedimentation velocity data for the 1:1 molar ratio sample were analyzed using a two-dimensional c(s, f/f0) distribution model (Suppl. Fig. 3)30 which allowed more accurate determination of the molar mass of sedimenting species with dissimilar f/f0-values than is possible using the c(s) distribution model31; 32 which yields only a single weight-average f/f0-value. The species at 2.3 S is significantly more compact than free Hdm2-ABD and exhibited a molar mass of ~35 kDa. Considering the error limits for the f/f0-value and molecular mass, this species corresponds to two possible Hdm2-ABD/A1-mini co-assemblies with stoichiometries of 3:4 or 2:10 with theoretical molar masses of 37,050 Da and 32,665 Da, respectively. The less abundant species at 3.0 S exhibited an f/f0 value of 2.20 and a molecular mass of ~65 kDa (Suppl. Fig. 3) and may correspond to an assembly comprised of two of the smaller oligomeric units (with s-value of 2.3 S). As noted, the species at 1.0 S, in addition to predominantly monomeric Hdm2-ABD, may co-sediment with a small amount of a 1:1 Hdm2-ABD/A1-mini oligomer.
The addition of a four-fold molar excess of A1-mini (Fig. 2D) and increased total polypeptide concentration (Fig. 2E), lead to the formation of additional, higher molar mass species. However, the existence of a continuum of species above an s-value of 5.0 S precluded analysis using the two-dimensional c(s, f/f0) distribution model; therefore, the c(s) distribution model, which assumes an average f/f0 value, was used to analyze these data. At an Hdm2-ABD (0.25 mM)/A1-mini molar ratio of 1:4 (Fig. 2D), the c(s) distribution analysis showed that the intensity of the peak for free Hdm2-ABD was reduced relative to that with the next largest s-value (2.9 S). The latter species probably corresponds to the 3:4 (or 2:10) Hdm2-ABD/A1-mini oligomer characterized with greater mass accuracy in the 1:1 molar ratio sample (Fig. 2C). In addition, several higher order oligomeric species were observed (s-values from 5-15 S; inset, Fig. 2D). The abundance of higher order oligomers increased when the concentration of the 1:4 molar ratio sample was increased approximately three-fold (to 0.8 mM Hdm2-ABD and 3.2 mM A1-mini) and were evident under conditions of both low ionic strength (10 mM sodium phosphate pH 6.0, 10 mM NaCl) (data not shown) and high ionic strength (10 mM sodium phosphate pH 6.0, 150 mM NaCl) (Fig. 2E). Under the latter conditions, lower order oligomers such as the ~1 S and the ~ 3 S species were still present, albeit less abundant. The major peak at 12.4 S (32% by mass) appears to be a highly elongated species since the best-fit weight-average f/f0-value for the c(s) distribution was greater than 2.2. These values correspond to a molar mass of greater than ~750 kDa. We could not obtain more detailed insights into the structure of these high mass species because the sedimentation coefficient is only an indirect measurement of molar mass and the latter is more difficult to obtain for ensembles of macromolecules exhibiting heterogeneity in the sedimentation coefficient and with dissimilar frictional ratios. Interestingly, the ~12.4 S species disassembled into lower molecular weight oligomers when a similar sample was diluted 3-, 6- or 9-fold (Suppl. Fig. 4), demonstrating that the different size oligomers dynamically interconvert under thermodynamic control.
Overall, the sedimentation results for this series of Hdm2-ABD/A1-mini samples prepared with varied molar ratios and concentrations are consistent with the ~1 S species being a mixture of free Hdm2-ABD with a small amount of a 1:1 Hdm2:A1-mini oligomer and the ~3 S species being a 3:4 (or 2:10) Hdm2-ABD/A1-mini co-assembly. Importantly, the ~3 S species was observed by AUC under all solution conditions evaluated, suggesting that it is a building block of higher order oligomers.
Probing A1-mini/Hdm2-ABD complexes using NMR spectroscopy
Despite the existence of large oligomers (Fig. 2E), sharp resonances were observed in the 1H-15N HSQC spectrum of mM 15N-Hdm2-ABD in the presence of a four-fold molar excess of unlabeled A1-mini (Fig. 3A, shaded red). Addition of A1-mini to 15N-Hdm2-ABD did, however, cause a significant reduction in the intensity of 1H-15N HSQC resonances (Suppl. Fig. 5B) as a significant amount of 15N-Hdm2-ABD was sequestered into bi-molecular oligomers with s-values > 3.0 S. AUC results for an unlabeled sample under the same conditions as used for NMR (as illustrated in Fig. 3A) indicated the existence of two species with s-values less than 3.0 S, one with an s-value near 1 S and another with an s-value near 3 S. The latter probably corresponds to the ~35 kDa species with either 3:4 or 2:10 Hdm2-ABD:A1-mini stoichiometry. The former species contains principally free Hdm2-ABD but may also contain the 1:1 Hdm2-ABD/A1-mini species that was suggested through analysis of lower concentration Hdm2-ABD/A1-mini samples prepared with a 1:1 molar ratio. We propose that exchange of free 15H-Hdm2-ABD between the 1:1 and possibly the 3:4 (or 2:10) Hdm2-ABD:A1-mini oligomers gives rise to the subtle but widespread chemical shift perturbations observed in the spectrum of the 1:4 15N-Hdm2-ABD/A1-mini mixture (Fig. 3A, shaded red) relative to that of free Hdm2-ABD (Fig. 3A, shaded blue). The observation of relatively sharp resonances for 15N-Hdm2-ABD in the presence of a four-fold molar excess of A1-mini is in sharp contrast to past results with longer peptides derived from the N-terminus of either human or mouse Arf. For example, we previously showed that addition of 3 equivalents of mArf-N37 caused 15N-Hdm2-ABD resonances to broaden beyond detection through formation of large, bi-molecular oligomers14. The use of a smaller Arf-derived peptide here, which contains the most highly conserved residues of Arf that lie within the A1 segment (Fig. 1A) but which exhibits apparent low affinity for Hdm2-ABD, has allowed the influence of Arf on the conformation of Hdm2-ABD to be probed at residue-level resolution for the first time.
Fig. 3.

Characterization of interactions between Hdm2-ABD and A1-mini using heteronuclear NMR spectroscopy. (A) 2D 1H/15N HSQC spectra of 1 mM 15N-Hdm2-ABD in the absence (illustrated in red) and presence of 4 mM unlabeled A1-mini (illustrated in blue). The amino acid assignments of those resonances which exhibited the largest A1-mini-induced chemical shift changes are indicated; full amino acid assignments for Hdm2-ABD are given in Suppl. Fig. 7A. (B) Quantitative analysis of A1-mini binding-induced perturbations of chemical shift values for residues in 15N-Hdm2-ABD. The locations of the H1 and H2 segment of Hdm2-ABD that are responsible for interactions with Arf are indicated.
While Hdm2-ABD and Hdm2-ABD/A1-mini oligomers with a wide range of molecular sizes were readily detected using optical methods during AUC experiments, we reasoned that only relatively small Hdm2-ABD/A1-mini oligomers (<50 kDa) were being detected at high resolution using solution NMR spectroscopy. We used pulsed magnetic field gradient/diffusion methods to gain insight into the apparent molecular size of 15N-Hdm2-ABD and the NMR-detectable species amongst the bi-molecular oligomers that form between 15N-Hdm2-ABD and unlabeled A1-mini (1:4 molar ratio; Suppl. Fig. 6). Consistent with its intrinsically unstructured nature, the value of the radius of hydration (Rh) for free Hdm2-ABD (25.7 Å) was larger than that expected for a globular protein with the same number of residues (Rh ~ 18-19 Å)33. The Rh for 15N-Hdm2-ABD in the presence of four molar equivalents of A1-mini (33.2 Å) reflects a significant increase in molecular size due to formation of bi-molecular oligomers. This Rh value nominally corresponds to a globular protein of ~820 residues, but is also consistent with rapid exchange of 15N-Hdm2-ABD between the free, unstructured state and A1-mini-containing oligomers comprised of two or three molecules of Hdm2-ABD. These results, however, suggest strongly that the abundant, higher molecular weight bi-molecular oligomers (observed by AUC with s-values > 3.0 S) do not contribute to the NMR spectrum of 15N-Hdm2-ABD/A1-mini shown in Fig. 3A (red shading). These observations are qualitatively consistent with the AUC analysis of 1:4 molar ratio Hdm2-ABD/A1-mini co-assemblies, which, under these conditions, detected highly extended, free Hdm2-ABD and bi-molecular oligomers with stoichiometry values of 1:1 (data not shown) and 3:4 (or 2:10), in addition to larger co-assemblies (Fig. 2D). Only the former two species are likely to be of sufficiently low molecular mass so as to give rise to sharp resonances in 1H-15N HSQC spectra, as were observed (Fig. 3A).
Comparison of chemical shift values for 15N-Hdm2-ABD in the absence and presence of A1-mini provided further insights into the structure and dynamics of Hdm2-ABD/A1-mini co-assemblies. The 1H-15N HSQC spectrum of 15N-Hdm2-ABD exhibited limited 1H chemical shift dispersion typical of intrinsically unstructured proteins14; 34 (Fig. 3A, shaded blue; Suppl. Fig. 7A). In addition, secondary 13Cα chemical shift values (Δδ13Cα)35 for Hdm2-ABD were close to zero, consistent with disordered, highly randomized backbone conformations (Suppl. Fig. 7B). Addition of 4 molar equivalents of A1-mini to 1 mM 15N-Hdm2-ABD caused small but significant changes in 1H and 15N chemical shift values (Δδ1H/15N), with the most extensive perturbations observed in the H1 and H2 Arf-binding segments (Fig. 3B). While remaining sharp, the intensities of resonances for 15N-Hdm2-ABD in 2D 1H-15N HSQC spectra were reduced significantly in the presence of A1-mini (Suppl. Fig. 5B), suggesting that only a fraction of Hdm2-ABD molecules were detected by NMR due to oligomerization of a large portion of the sample. Further, that the chemical shift perturbations caused by A1-mini are small is consistent with fast exchange of Hdm2-ABD (on the NMR time scale) between the free state and NMR-observable oligomeric states. However, the population of these small oligomers must be relatively small based on the small Δδ1H/15N values that were observed. The larger oligomers observed by AUC (s-values greater than 3.0 S), while shown to interconvert upon dilution (Suppl. Fig. 4), must exchange with the smallest (NMR-observable) oligomers slowly on the NMR time scale. We also investigated the effects of A1-mini on Δδ13Cα chemical shift values, patterns of 1H-1H NOE cross peaks in 3D 15N-edited NOESY-HSQC spectra, and heteronuclear {1H}-15N NOE values for 15N-Hdm2-ABD (data not shown). However, consistent with the subtle effects of A1-mini on 1H and 15N chemical shift values of Hdm2-ABD, significant differences in these parameters were not detected in the absence and presence of A1-mini. Overall, our NMR results are consistent with the conclusion that Hdm2-ABD rapidly exchanges between the free state and small (NMR-detectable) Hdm2-ABD/A1-mini bi-molecular oligomers, and that these species exchange slowly with larger (NMR-invisible) bi-molecular oligomers. While they do not provide detailed insights into the structural nature of Hdm2-ABD/A1-mini bi-molecular oligomers, the NMR-based chemical shift perturbation and diffusion/hydrodynamic data provide direct evidence for significant interaction between Hdm2-ABD and A1-mini.
The H1 and H2 regions of Hdm2-ABD co-fold in the presence of A1-mini
Paramagnetic spin labels enhance relaxation of nuclear magnetization through electron spin-nuclear spin interactions over long distances (up to 25 Å)36 and under conditions of fast exchange37. We reasoned that the introduction of spin labels into Hdm2-ABD would allow the structure of Hdm2-ABD/A1-mini co-assemblies to be probed. First, eight single-Cys variants of 15N-Hdm2-ABD were prepared and each was labeled with the nitroxide-containing compound, (1-oxyl-2,2,5,5-tetramethyl-3-pyrroline-3-methyl) methanethiosulfonate (MTSL). 2D 1H-15N HSQC spectra were recorded for MTSL-labeled variants at 0.25 mM in the absence and presence of 4 molar equivalents of A1-mini. Under these conditions, Hdm2-ABD/A1-mini bi-molecular oligomers exhibited s-values of 1.0 S (free Hdm2-ABD and 1:1 Hdm2-ABD/A1-mini), 2.9 S (3:4 or 2:10 Hdm2-ABD/A1-mini) and >5 S (very large bi-molecular oligomers) (Fig. 2D). However, we surmise that only the smaller species (s-value < 3 S) contribute to the observable NMR signals. In the absence of A1-mini, MTSL only perturbed amide resonances in unstructured Hdm2-ABD proximal (within approximately ± 15 residues) to the labeled residue (Fig. 4, red data points). However, in the presence of a four-fold molar excess of A1-mini, paramagnetic relaxation enhancement (PRE) was observed beyond sites which experienced PRE in the absence of A1-mini (Fig. 4, black bars). Notably, MTSL labeling of sites flanking the H1 Arf-binding segment of Hdm2-ABD (Cys at positions 240, 256, or 262) caused PRE at sites proximal to H1 as well as at distal sites in the H2 Arf-binding segment and, less dramatically, in the more distal C-terminus (residues 290-304; termed H3) (Fig. 4B, D, and E). Reciprocally, MTSL labeling of sites flanking the H2 segment (Cys at positions 270 and 284) led to PRE not only within the proximal H2 segment but also within the distal H1 and H3 segments of Hdm2-ABD (Fig. 4F & G). The data presented in Fig. 4B and D-H are consistent with co-folding of the different MTSL-labeled Hdm2-ABD single Cys mutants and A1-mini into β-strand-rich bimolecular oligomers. However, because the MTSL spin label was covalently bonded to Cys residues at different positions, we cannot be certain that the structures of the bi-molecular oligomers formed by unmodified Hdm2-ABD and the different MTSL-labeled forms of Hdm2-ABD are identical.
Fig. 4.

NMR spin label mapping of Hdm2-ABD/A1-mini bi-molecular oligomers. Quantitative analysis of the effects of the MTSL spin-label covalently linked to Cys residues substituted at eight sites within 15N-Hdm2-ABD (0.25 mM) on 2D 1H/15N HSQC resonance intensities (Iox/Ired) in the absence and presence of four molar equivalents of A1-mini. Data for the following single-Cys variants of Hdm2-ABD are presented: (A) S229C, (B) S240C, (C) E250C, (D) S256C, (E) S262C, (F) S270C, (G) G284C, and (H) E293C. The yellow arrows indicate the position of the MTSL spin-label for each Hdm2-ABD variant. Red squares and black bars indicate (Iox/Ired) values for MTSL-labeled single-Cys Hdm2-ABD variants measured in the absence and presence of A1-mini, respectively. Experiments were performed in triplicate and the error bars represent the squared deviations of the mean. The yellow shading outside the labeled sites highlights differences between the results in the absence and presence of A1-mini. The positions of the H1, H2 and H3 segments discussed in the text are indicated at the top.
Two MTSL-labeled variants of Hdm2-ABD, with Cys substituted at positions 229 and 250, did not reveal A1-mini-dependent, long-range interactions between the H1, H2 and/or H3 segments of Hdm2-ABD. For the variant labeled on position 229, this is because this site is outside the region of Hdm2 that co-folds with A1-mini. For the position 250 variant, substitution of the conserved Glu (Fig. 1B)14 with MTSL-labeled Cys probably disrupts specific interactions with A1-mini, leading to the formation biologically irrelevant, alternative structures. Therefore, we have not included data for these two MTSL-labeled Hdm2-ABD variants in our qualitative structural analysis of Hdm2-ABD/A1-mini bi-molecular oligomers.
A1-mini localizes in the nucleoli of NIH 3T3 fibroblasts
The biological activity of A1-mini was assessed by determining the ability of Texas Red labeled A1-mini peptide (TR-A1-mini) micro-injected into the nuclei of Arf-null mouse fibroblasts to localize in nucleoli, co-localize with Mdm2 in nucleoli, and cause cell cycle arrest. TR-A1-mini was localized in nucleoli in 79% of injected cells (33/42 cells, Fig. 5B & E). However, only 7% of cells (Fig. 5D & E) exhibited co-localization of A1-mini with Mdm2 in nucleoli. Further, nuclear micro-injection of TR-A1-mini did not inhibit the incorporation of bromo-deoxyuridine (BrdU) into DNA (data not shown), consistent with a failure to activate p53 and inhibit cell proliferation. These results suggest that A1-mini, while able to co-assemble with Hdm2-ABD in vitro, possesses insufficient affinity and specificity for Mdm2 in vivo to nullify the E3 ligase activity of Mdm2 toward p53. In contrast, the mArf-N37 peptide co-assembled specifically with Mdm2 in nucleoli and exhibited cell cycle arrest activity in vivo18. We have previously shown that mArf-N37 completely converts Hdm2-ABD into bi-molecular, oligomeric structures at low concentrations and low molar ratios in vitro, suggesting that, while A1-mini appears to interact with Hdm2-ABD in a structurally analogous manner, it fails to activate p53 in vivo due to its reduced affinity for Mdm2. However, it is this reduced affinity that has made possible the structural characterizations reported herein.
Fig. 5.

Texas red (TR)-labeled A1-mini injected into nuclei localized within nucleoli of mouse NIH 3T3 fibroblast cells. Fluorescence microscopy showing (A) endogenous Mdm2 localization (detected using a FITC labeled anti-Mdm2 antibody; green) and (B) TR-A1-mini localization (through detection of TR). Mdm2 exhibits nucleoplasmic and TR-A1-mini nucleolar localization in the majority of cells (93%). (D, E) In a small fraction of injected cells (7%), Mdm2 and TR-A1-mini co-localize within nucleoli. (C, F) The nuclear envelope and nucleoli (arrows) are revealed in differential interference contrast images.
Discussion
Oncogene activation and inappropriate mitogenic signaling activate the expression of Arf, which binds to Hdm2 and relieves inhibition of p53, ultimately leading to p53-dependent and -independent cell cycle arrest or apoptosis38; 39. While the importance of Arf and Hdm2 in tumor biology is well established, little information is available on the molecular basis of Arf and Hdm2 interactions. This dearth of knowledge stems from experimental difficulties associated with lack of structure within the domains of Arf and Hdm2 that mediate interactions14; 18, and the novel properties of the bi-molecular oligomers that they form. Based on the structural results reported herein, we have developed schematic models of Hdm2-ABD/A1-mini bi-molecular oligomers which we believe are relevant to the structure of Hdm2/Arf co-assemblies that form in mammalian cells to regulate p53 activity.
Structural models of Hdm2-ABD/A1-mini co-assemblies
We have presented results from several complementary methods, including CD, AUC and NMR, which demonstrate that the addition of the A1-mini peptide to intrinsically disordered Hdm2-ABD leads to the formation of discrete, β-strand-rich bi-molecular oligomers with a range of molecular sizes. These results provide the most detailed insights into the molecular structure of these unprecedented bimolecular oligomers available to date. We propose that the simplest bi-molecular oligomer involves interactions between a single A1-mini molecule in an extended, β-strand conformation with similarly extended H1 and H2 segments of a single Hdm2-ABD molecule (Fig. 6A). This 1:1 β-strand model with H1 and H2 arranged in an anti-parallel manner, is generally consistent with our CD results (Fig. 1B) and PRE results (Fig. 4). Further, H3 is brought into proximity with the N-terminus of H1, although it is likely that H3 folds back onto the H1-A1-H2 core differently than illustrated in Fig. 6A. This 1:1 bi-molecular oligomer, with limited interactions between Hdm2-ABD and A1-mini, may exist only transiently and be populated to a small extent, consistent with NMR findings. Consistent with past results14 and recent deletion and mutagenesis analyses (Suppl. Figs. 1 and 2), we propose that electrostatic interactions between Glu and Asp residues in H1 and H2 of Hdm2-ABD and Arg residues of A1-mini drive the co-assembly process. Further, both the H1 and H2 segments of Hdm2-ABD, and A1-mini, contain a significant number of hydrophobic residues14. The sequestration of these in the core of fibril-like structures through the hydrophobic interactions is likely to also be a significant driving force for co-assembly. Finally, interactions between adjacent, oppositely charged segments of Hdm2 and Arf are likely to be mediated by inter-molecular, backbone hydrogen bonds that stabilize parallel (e.g. between H1 and A1-mini in Fig. 6A) and anti-parallel (e.g. between H2 and A1-mini in Fig. 6A) orientations of β-strands.
Fig. 6.

Schematic models of Hdm2/Arf bi-molecular oligomers. (A) Model of the putative 1:1 Hdm2-ABD/A1-mini oligomer. β-strands formed by the H1 and H2 segments of Hdm2 are illustrated as red and orange zig-zags, respectively, and that formed by A1-mini as a blue zigzag. The arrowheads indicate the C-terminal of the β-strand segments. The location of H3 is indicated in gray. (B) Two models of the bi-molecular oligomer with 3:4 Hdm2-ABD/A1-mini stoichiometry using the same color scheme as in (A). The shaded region indicates that the model on the left involves repetition of the β-strand topology illustrated for the 1:1 species in (A). The gray arrows illustrate a possible mechanism for propagation of the structure through additional A1-mini (shown as dotted blue zig-zags)-mediated edge-to-edge assembly of 3:4 Hdm2-ABD/A1-mini structural units, leading to the formation ribbon-like structures comprised of parallel tracks of β-strands. The model on the right illustrates a similar type of structure with alternative β-strand interactions. The region enclosed in the dotted box is modeled in greater detail in (C). (C, top) Atomic model of a portion of the bi-molecular oligomer illustrated in (B), shown on the right and enclosed by the dotted box. The atomic models on the top are comprised of alternating and anti-parallel β-strands from a portion of the H1 segment from Hdm2-ABD (H1 and H1′; dark gray tubes) and A1-mini (A1 and A1′; light gray tubes). Amino acid side chains are represented as sticks: acidic side chains (Asp, Glu) are colored red; basic side chains (Arg), blue; hydrophobic residues (Ile, Leu, Phe, Val), yellow; and Ser in gray and red. One face of the four-stranded β-sheet (electrostatic face, left) exhibits many charged residues which are proposed to form an electrostatic network; the opposite face exhibits predominantly hydrophobic residues (hydrophobic face, right). (C, bottom) Further edge-to-edge assembly of these bi-molecular oligomers leads to ribbon-like structures as schematically illustrated in the bottom panel, with colored spheres representing amino acid side chains according to the color scheme for the top panel. (D) Schematic illustration of putative bi-molecular oligomers formed between Hdm2-ABD and mArf-N37, with the A1 and A2 segments of mArf-N37 shown in light and dark blue, respectively. The topology of this oligomer is similar to that illustrated in panel B on the right.
The structure illustrated in Fig. 6A is unlikely to mediate assembly of higher order bimolecular oligomers corresponding to species identified by AUC with s-values greater than 1.0 S. Further, AUC and NMR evidence suggests that this 1:1 species exists only transiently and can be considered to be a proto-oligomer. In contrast, a discrete bi-molecular oligomer which exhibited an s-value of 2.3 S using the c(s, f/f0) distribution model and 2.9 S using the simpler c(s) distribution model was observed in all samples containing Hdm2-ABD and A1-mini that were examined. Based on analysis of the sedimentation velocity data for the 1:1 Hdm2-ABD/A1-mini sample using the c(s, f/f0) distribution model, the molecular mass of this species was estimated to be ~35 kDa. Based on this approximate molecular mass, the bi-molecular assemblies may contain either two or three molecules of Hdm2-ABD (MW ~ 10,900 Da), and either ten or four molecules of A1-mini (MW ~ 1,100 Da), respectively. In addition, a second, discrete species was detected in the 1:1 Hdm2-ABD/A1-mini sample characterized by an s-value of 3.0 S and molecular mass approximately double that of the 2.3 S species (~65 kDa). It is possible that this species is comprised of two of the smaller, 3:4 (or 2:10) bi-molecular oligomers. For this discussion, we assume that the ~35 kDa species has 3:4 Hdm2-ABD/A1-mini stoichiometry, although the structural modeling we discuss next would be generally pertinent to a species with 2:10 stoichiometry. The interactions between β-strands containing the H1 and H2 segments of Hdm2-ABD and A1-mini illustrated for the 1:1 proto-oligomer (Fig. 6A) can be recapitulated in a 3:4 species, as illustrated on the left in Fig. 6B. In this model, β-strands comprised of H1, A1-mini, and H2 form two parallel tracks β-strands (indicated by gray arrows in Fig. 6B, left) connected by what are presumed to be flexible linkers between H1 and H2. A1-mini serves as “glue” between the three Hdm2-ABD molecules arranged in an alternating, head-to-tail manner. Edge-to-edge interaction of two such bi-molecular oligomer building blocks, mediate by additional A1-mini peptides (indicated by dotted, blue zig-zags in Fig. 6B, left) would give rise to the ~65 kDa species observed by AUC. Further, these building blocks may assemble into extended ribbons which themselves become bundled together to form fibrils.
An alternative structural model with 3:4 stoichiometry is proposed on the right in Fig. 6B in which Hdm2-ABD molecules are arranged in a head-to-head manner, with A1-mini strands again serving to mediate formation of parallel tracks of β-strands (Fig. 6B, right). We have modeled the atomic structure of one portion of this alternative bi-molecular oligomer (Fig. 6C, top), which revealed that the two faces of the β-sheet comprised of alternating and anti-parallel H1 and A1-mini strands have dramatically different characteristics. One face is comprised of alternating acidic (colored red in Fig. 6C, top, left) and basic (colored blue) residues from H1 and A1-mini, respectively, that can interact via a dynamic electrostatic network; this is termed the “electrostatic face”. The opposite face, illustrated in Fig. 6C, top, right, is predominantly comprised of hydrophobic residues (colored yellow) from both H1 and A1-mini, with one side comprised of alternating acidic and basic residues from H1 and A1-mini, respectively; this face is termed the “hydrophobic face”. The contrasting characteristics of these two β-sheet faces arise because acidic and hydrophobic residues alternate within the H1 segment of Hdm2-ABD (Fig. 1B), and because the Arg residues at the two ends of A1-mini are separated by five hydrophobic residues (Fig. 1A). This basic 3:4 Hdm2-ABD/A1-mini building block could further assemble into extended β-strand ribbons through edge-to-edge interactions mediated by additional A1-mini molecules (Fig. 6C, bottom). The contrasting physical characteristics of the two faces of such ribbons may mediate further assembly into multi-strand fibrils with pairs of ribbons alternatively stabilized by hydrophobic and electrostatic interactions. While we have not examined the structure of Hdm2-ABD/A1-mini bi-molecular oligomers using electron microscopy, past studies has shown that fibrilar structures form when fragments of Hdm2 and Arf interact14; 15. The models presented here, in general, are supported by our experimental data in that they are comprised β-strands that require both partners to form. In the absence of their oppositely charged partner, both Hdm2-ABD and A1-mini are intrinsically unstructured, probably due to extensive repulsion of the many similarly charged acidic or basic residues, respectively. However, when combined, attractive electrostatic forces probably mediate assembly of Hdm2-ABD and A1-mini into β-strand-rich structures like those illustrated in Fig. 6B. The importance of electrostatic interaction to co-assembly is exemplified by the salt-dependence of Hdm2-ABD/mArf-N37 interactions14, and the observation that substitution of any of the Arg residues within A1-mini with Gly prevents co-assembly with Hdm2-ABD (Suppl. Fig. 2). In contrast, individual hydrophobic residues within A1-mini are less critical for co-assembly, as shown by the ability of peptides with these five hydrophobic residues individually substituted with Gly to support either specific (Leu6Gly, Val7Gly, and Thr8Gly) or non-specific (Phe5Gly and Val9Gly) co-assembly with Hdm2-ABD (Suppl. Fig. 2).
Finally, the 9-residue A1-mini peptide did not cause cell cycle arrest when injected into the nuclei of Arf-null mouse fibroblasts, although the peptide did become localized in nucleoli and, in rare cases, exhibited co-localization with Mdm2. These results, together with our structural studies, indicate that, while A1-mini binds to Hdm2-ABD through the same general mechanism observed for longer Arf-derived peptides, its affinity (for Mdm2) is probably too low to fully sequester and inactivate Mdm2 in bi-molecular oligomers. A 20-residue peptide from the N-terminus of p14Arf fused to GFP19 and mArf-N3718 have previously been shown to bind and co-localize with Hdm2/Mdm2 resulting in activation of p53-dependent cell cycle arrest. We also showed previously that peptides corresponding to residues 1-15 and 5-20 of p14Arf bound to Hdm2-ABD, and that the first of these peptides irreversibly assembled into bi-molecular oligomers with Hdm2-ABD and with a 15-residue peptide corresponding to the H1 segment of Hdm214. Further, we showed that the N-terminus of p19Arf contains two copies of a motif in which Arg residues flank 5 to 7 hydrophobic residues18 and that individual peptides containing these regions, spanning residues 1-15 and 16-30, each bound to Hdm2-ABD14. We propose that segments A1 and A2 of p19Arf co-fold with Hdm2, forming highly stable bi-molecular oligomers that sequester and inactivate Hdm2 (Fig. 6D). It must be emphasized that different fragments of Arf and Hdm2, which have been shown to co-assemble into bi-molecular oligomers, do not self-assemble in isolation, nor do they exhibit secondary structure. Importantly, the sequence of the A1 segment of Arf is highly conserved in mammals4 (Fig. 1A). In addition, most features of the A2 segment of p19Arf are conserved in p14Arf (Fig. 1A), suggesting that a 29 residue long, or longer, peptide derived from p14Arf should recapitulate Arf tumor suppressor function in human cells.
In summary, our current and past14; 15; 18 results strongly suggest that Arf relieves the Hdm2 (and Mdm2)-mediated inactivation of p53 through an unprecedented mechanism involving the formation of β-strand-rich, bi-molecular oligomers. When Arf is not expressed, the intrinsically unstructured, central domain of Hdm2 functions as a flexible linker which may coordinate the activities of the folded N- and C-terminal domains of Hdm221; 22; 23, the former which binds specifically to p53 and the latter which functions as an E3 ligase to transfer ubiquitin to p5340; 41. We propose that Arf expression and subsequent formation of Hdm2/Arf bimolecular oligomers, 1) disrupts the functional relationship(s) between the N- and C-terminal domains, inhibiting p53 ubiquitination, and 2) sequesters Hdm2 in nucleoli, limiting access to nucleoplasmic p53. While several examples of biologically functional, β-strand-rich protein oligomers have been reported (reviewed in 42 and 43), we are not aware of published examples of bi-molecular assembly of domains from two proteins to form functional, β-strand-rich oligomers. As noted above, the sequence of the A1 segment, and to a lesser extent the A2 segment, are conserved in mammalian Arf sequences (Fig. 1A). Similarly, sequences of the H1 and H2 segments are conserved in mammalian Hdm2 sequences (Fig. 1B), suggesting that these domains of Arf and Hdm2 have co-evolved to give rise to this co-assembly mechanism as a means of regulating Hdm2 and, indirectly, p53. While naturally occurring examples of the Hdm2/Arf co-assembly mechanism cannot be found, Rich and co-workers44 showed that a synthetic peptide exhibiting an alternating pattern of charged residues and alanine, (AEAEAKAK)2, and related sequences45, self-assembled into β-strand-rich structures with fibrilar characteristics. These authors suggested that β-strand-rich fibrils were built up from layers of β-strands held together alternatively by electrostatic and hydrophobic interactions between opposite faces of amphipathic β-sheets. The alternation of Glu residues with hydrophobic or polar residues in the H1 segment of Hdm2 may support a similar mode of assembly, with the N-terminus of Arf supplying Arg residues for interactions with Glu residues in H1 as well as hydrophobic residues for interactions with the hydrophobic residues of H1 oriented on one face of a β-sheet. Crystallization and x-ray diffraction studies, or solid-state NMR studies, however, will be required in the future to determine the molecular details of the novel Hdm2/Arf co-assemblies.
Materials and Methods
Preparation of Hdm2-ABD and A1-mini
Hdm2-ABD was expressed in E. coli using a pET-28a vector (Novagen) and purified from the soluble fraction after lysis in 20 mM Tris-HCl (pH 8.0), 500 mM NaCl and centrifugation, as previously described14. Urea was added to the clarified extract to a concentration of 6 M followed by purification of His-tagged Hdm2-ABD using Ni2+ affinity chromatography using buffers containing 6 M urea. Fractions containing Hdm2-ABD were exhaustively dialyzed against 20 mM Tris-HCl (pH 8.0), 500 mM NaCl and treated with thrombin to cleave the His tag. Finally, cleaved Hdm2-ABD was further purified using anion exchange chromatography (Q Sepharose, Amersham Pharmacia Biotech, Inc.) using a urea-free, Tris/NaCl buffer system14.13C/15N- or 15N-labeled Hdm2-ABD were expressed using MOPS-based media containing 13C-glucose and/or 15NH4Cl46 and purified as described above. The A1-mini peptide and A1-mini peptides with single Gly substitutions were synthesized using standard FMOC chemistry and purified by high-performance liquid chromatography (HPLC) using a H2O/CH3CN/0.1% trifluoroacetic acid solvent system and a C18 column (Vydac). The solution concentration of Hdm2-ABD was determined using UV absorbance at 280 nm (ε = 16,500 AU M−1 cm−1) and that of A1-mini peptides was determined using CD ellipticity at 200 nm ([A1-mini] = 0.964 mg ml−1 mdeg−1 cm−1). Amino acid analysis was used to independently determine the concentration of some A1-mini solutions used for CD.
Preparation and characterization of Hdm2-ABD variants lacking the H1 and/or H2 segments
pET-28a-based expression constructs for Hdm2-ABD lacking the H1 (Hdm2-ABD-ΔH1; deletion of residues 241-255), H2 (Hdm2-ABD-ΔH2; deletion of residues 272-283), or both segments (Hdm2-ABD-ΔH1/2; deletion of residues 240-255 and 272-283) were prepared using synthetic oligonucleotides and the polymerase chain reaction; the coding regions of these plasmids were confirmed by DNA sequencing. These proteins were expressed and purified using the procedures for Hdm2-ABD described above.
Preparation of MTSL spin-labeled, single-Cys Hdm2-ABD variants
Nine different Hdm2-ABD expression vectors were prepared in which the codons corresponding to residues 229, 240, 250, 256, 262, 270, 284, 293, or 297 were mutated to that encoding cysteine using site-directed mutagenesis (QuikChange® procedure, Stratagene). Mutations were introduced into the pET28a-based vector developed previously to express His-tagged Hdm2-ABD14 and were confirmed by DNA sequencing. The single-Cys variants of Hdm2-ABD were expressed in BL21(DE3) E. coli cells using MOPS-based minimal media containing 15NH4Cl and purified as described above for Hdm2-ABD. The S297C Hdm2-ABD variant exhibited very limited solubility and was not pursued further. The eight other single-Cys Hdm2-ABD variants were concentrated to 1 mg/ml and exchanged into 20 mM sodium phosphate pH 7.2, 0.1 M NaCl by ultrafiltration (Amicon device, Millipore). The protein solutions were incubated with five molar equivalents of (1-Oxyl-2,2,5,5-tetramethyl-3-pyrroline-3-methyl) methanethiosulfonate (MTSL, Toronto Research Chemical, Inc.) for 12 hours. The MTSL-labeled, single-Cys Hdm2-ABD variants were purified using HPLC with a H2O/CH3CN/0.1% trifluoroacetic acid solvent system and a C4 column (Vydac). The identities of the single-Cys Hdm2-ABD variants were confirmed using mass spectrometry.
Fluorescent labeling
The peptide with the sequence, N-CGGGGGRRFLVTVR-C, was labeled on the Cys SH group with Texas Red maleimide (TR-A1-mini; Invitrogen) using the manufacturer’s protocols and purified using C18 HPLC.
Circular dichroism
CD spectra were recorded using an AVIV model 202-01 spectropolarimeter; four scans from 260 to 190 nm were averaged using 1 nm bandwidth and a 1 mm path length quartz cell (Helma). Wild-type Hdm2-ABD and the deletion constructs described above were exhaustively dialyzed against 10 mM sodium phosphate (pH 6.0) and 10 mM NaCl and the A1-mini peptide was dissolved in the same buffer and added to Hdm2-ABD protein solutions.
NMR spectroscopy
A series of two-dimensional (2D) and three-dimensional (3D) NMR spectra were recorded with uniformly 13C/15N-labeled Hdm2-ABD (2 mM) dissolved in NMR buffer (10 mM sodium phosphate, 10 mM NaCl, 0.01% sodium azide, 6 % D2O at pH 6.0 and 25 °C), including 2D 1H/15N HSQC, 3D CT-HNCA, 3D CT-HN(CO)CA, 3D HNCACB, and 3D CBCA(CO)NH47. These spectra were processed using NMR-Pipe48 and analyzed using Felix software (Accelerys, Inc.) to establish backbone resonance assignments. Side chain resonance assignments were established through the analysis of 3D C(CO)NH-TOCSY and 3D H(CCO)NH-TOCSY spectra. The 1H chemical shift scale was referenced to external TSP and the 13C and 15N indirect dimensions were referenced indirectly using ratios of the 1H and 13C, and 1H and 15N gyromagnetic ratios47. These NMR experiments were performed using either a 600 MHz Varian INOVA NMR spectrometer equipped with a 5 mm triple resonance, x, y, z-gradient probe or a 600 MHz Bruker AVANCE NMR spectrometer equipped with a triple-resonance TCI cryogenic probe. A 2D 1H/15N HSQC spectrum of 15N-Hdm2-ABD (dissolved in NMR buffer at 25 °C) showing resonance assignments is illustrated in Suppl. Fig. 7A.
In addition, {1H}-15N heteronuclear NOE and 3D 1H-15N NOESY-HSQC spectra were recorded for 15N-Hdm2-ABD in the absence and presence of A1-mini at 800 MHz using a Bruker AVANCE NMR spectrometer equipped with a triple-resonance TCI cryogenic probe at 25 °C. The perturbations of Hdm2-ABD 1H/15N chemical shift values caused by addition of A1-mini (Δδ1H/15N) were quantified using the following equation: Δδ1H/15N = [(δ1HN(15N-Hdm2-ABD/A1-mini) –δ1HN(free 15N-Hdm2-ABD))2 + 0.0289*(δ15NH(15N-Hdm2-ABD/A1-mini) – δ 15NH(free 15N-Hdm2-ABD))2]1/2. 1H-15N HSQC spectra of MTSL spin-labeled, single-Cys variants of 15N-Hdm2-ABD (0.25 mM) were also recorded on this spectrometer at 25 °C in the absence or presence of 4 molar equivalents of A1-mini. The MTSL spin label for each variant was then reduced with 5 mM ascorbic acid (pH 6) and a second set of 1H-15N HSQC spectra recorded. The ratios of peak volumes in 1H-15N HSQC spectra for oxidized (Iox) and reduced (Ired) samples prepared in triplicate were analyzed (Fig. 4).
Diffusion measurements were performed using a 600 MHz Varian INOVA NMR spectrometer using 1 mM 15N-labeled HDM2-ABD in the absence or presence of 4 mM unlabeled A1-mini in 10 mM sodium phosphate and 10 mM NaCl at pH 6 (Suppl. Fig. 6). The 15N-filtered BPP-MAXY-D pulse sequence49 was used to record 1D spectra at various gradient field strengths (1 – 60 G cm−1). The use of 15N-labeled Hdm2-ABD and unlabeled A1-mini allowed the influence of A1-mini on the diffusion properties of Hdm2-ABD to be specifically monitored. Dioxane was added as an internal standard to normalize for the changes in the solution conditions between samples of Hdm2-ABD in the absence and presence of A1-mini. The radius of hydration (Rh) of Hdm2-ABD was calculated using the approach of Wilkins, et al.33, using the relation Rh, Hdm2-ABD = (ddioxane/dHdm2-ABD) Rh, dioxane, where d is the decay rate of the NMR signal with increasing gradient strength and Rh,dioxane is 2.12 Å. Experimental data obtained at different gradient strengths (g) we fit using the following equation to obtain d: I(g)/I0 = Ae−dg^2, where I(g) is the NMR signal intensity at a particular value of g, I0 is the NMR signal intensity with g equal to 0, and A is a unitless calibration constant. To estimate the length of an unfolded protein (in number of residues, N) corresponding to a particular Rh value, the following equation was used: Rh (unfolded protein, Å) = (2.21 ± 1.07)N0.57 ± 0.02 33.
Analytical ultracentrifugation experiments
Sedimentation velocity experiments with Hdm2-ABD in the absence and presence of A1-mini were performed using a Beckman ProteinLab XL-I analytical ultracentrifuge equipped with an eight-hole Beckman An-50 Ti rotor and cells containing sapphire windows and charcoal-filled Epon double-sector centrepieces (Beckman Coulter). The density and viscosity of the ultracentrifugation buffers, 10 mM sodium phosphate pH 6.0, 10 mM NaCl (low ionic strength) and 10 mM sodium phosphate pH 6.0, 150 mM NaCl (high ionic strength), at 20 °C were calculated from their composition, and the partial specific volume at 20 °C and molecular weight of the proteins were calculated based on their amino acid composition using the software SEDNTERP50. All samples were dialysed against the ultracentrifugation buffer and the dialysate was used as an optical reference. The loading volume of 320-400 μl was identical for the reference and sample chambers. Fringe displacement data were recorded in 1 min intervals with the Rayleigh interference optical system at a rotor speed of 50,000 rpm. The velocity profiles were analysed with the software SEDFIT using models for continuous sedimentation coefficient distribution c(s) with deconvolution of diffusional effects31; 32 and well as a two-dimensional size-shape distribution, c(s, f/f0), with the one dimension the s-distribution and the other the f/f0-distribution30. The sedimentation coefficient distribution c(s) was calculated with maximum entropy regularization at a confidence level of p = 0.7 and at a resolution of sedimentation coefficients of n = 100. The s-value of the protein was determined by integration of the main peak of c(s). The molecular weight distribution, c(M), was calculated using the values determined from the c(s) distribution. The best-fit weight-average frictional ratio (f/f0) was determined from the c(s) analysis, and a single value was assumed31. For the c(s, f/f0) model30, an equidistant f/f0-grid from 1.2 to 2.2 with 0.10 steps, a linear s-grid from 0.1 to 5 S with 150 s-values, and Tikhonov-Phillips regularization at one standard deviation was calculated. The calculated c(s*) distribution (similar to the c(s) distribution, except that it does not make any assumptions on the frictional ratio) was transformed as c(s, M) and c(s, f/f0) distributions with M the molecular weight, f/f0 the frictional ratio and s the sedimentation coefficient and plotted as contour plots. This analysis was with regularization. The dotted lines of the c(s, M) distribution plot indicate lines of constant f/f0. The distributions were not normalized30.
Colocalization and DNA replication assays
NIH 3T3 Arf−/− cells (10-15 passages) were cultured in Dulbecco’s modified Eagle medium supplemented with 10% fetal bovine serum, 5 mM L-glutamine in the presence of 100 IU/mL of pencillin/streptomycin at 37 °C. The cells were plated onto a 35 mm poly-D-lysine glass coated glass bottom dish (Mattek) 24 hours prior to microinjection at a density of 1.5 × 10⁵ cells per dish. Texas Red labeled A1-mini peptide (0.5 mg/mL in 20 mM HEPES, 100 mM NaCl, pH 7.4) or Texas Red dextran (control) was injected into the nucleus of Arf-null NIH 3T3 cells using a Eppendorf FemtoJet injection system (Eppendorf) mounted on an Eclipse TE2000-U microscope (Nikon) with an ELDW Plan Fluor 20X Phase-contrast objective. All dishes were manipulated for less than 30 min during any one set of injections. After a 4 hour recovery period at 37 °C with 8% CO2 atmosphere the cells were washed thrice with PBS and fixed with 1:1 v/v acetone/methanol and incubated with mouse anti-mdm2 antibody (2A10, Calbiochem) for 1 hour. The primary antibody was removed and the dishes were washed thrice with PBS and incubated with FITC-labeled rabbit anti-mouse IgG (Abcam) for 40 minutes. After three additional washes in PBS, the cells were observed using an Eclipse TE2000-E confocal fluorescence microscope (Nikon) equipped with a C1Si detector (Nikon) with a Plan Fluor 40X (N.A. 1.3) or a 60X Plan Apo (N.A. 1.45) objective to determine the localization of A1-mini and Mdm2. Images acquired on this system were further manipulated using Adobe Photoshop 7.0.
DNA replication was monitored using a 5-bromodeoxyuridine (BrdU) incorporation assay. For this experiment, a small circle was marked on the 35 mm cell culture dish to locate the A1-mini-injected cells. A1-mini peptide was injected into the nuclei of all the cells in the marked circle at a peptide concentration of 2–4 mg/ml. The cells were allowed to recover for 30 minutes and then BrdU (10 μM) was added to the media. The cells were incubated at 37 °C for 8 hours and fixed as described above. The fixed cells there then treated with two cycles of 4 N HCl for 10 minutes each and stained with FITC-labeled anti-BrdU antibody (Abcam). Following staining the cells were washed with 10 mM sodium phosphate, pH of 7.4, 150 mM NaCl and observed on the Nikon C1Si confocal microscope as described above. The percentage of BrdU labeled cells within the circle was determined and compared to the percentage of BrdU labeled cells in the areas surrounding the circle. The data from 3 independent experiments was then averaged and the standard deviation determined. No significant differences in the percentage of cells undergoing DNA replication were observed between the control and A1-mini microinjected cells.
Supplementary Material
Acknowledgments
The authors acknowledge Dr. Rensheng Luo for assistance with the diffusion NMR experiments and Dr. Charles Galea for helpful discussion. This work was supported by grants from NIH (CA 82491 awarded to R. W. K. and P30CA21765 to St. Jude Children’s Research Hospital) and the American Lebanese Syrian Associated Charities (ALSAC) of St. Jude Children’s Research Hospital.
Footnotes
Publisher's Disclaimer: This is a PDF file of an unedited manuscript that has been accepted for publication. As a service to our customers we are providing this early version of the manuscript. The manuscript will undergo copyediting, typesetting, and review of the resulting proof before it is published in its final citable form. Please note that during the production process errors may be discovered which could affect the content, and all legal disclaimers that apply to the journal pertain.
References
- 1.Lin AW, Lowe SW. Oncogenic ras activates the ARF-p53 pathway to suppress epithelial cell transformation. Proc Natl Acad Sci U S A. 2001;98:5025–30. doi: 10.1073/pnas.091100298. [DOI] [PMC free article] [PubMed] [Google Scholar]
- 2.Zindy F, Eischen CM, Randle DH, Kamijo T, Cleveland JL, Sherr CJ, Roussel MF. Myc signaling via the ARF tumor suppressor regulates p53-dependent apoptosis and immortalization. Genes Dev. 1998;12:2424–2433. doi: 10.1101/gad.12.15.2424. [DOI] [PMC free article] [PubMed] [Google Scholar]
- 3.Russell JL, Weaks RL, Berton TR, Johnson DG. E2F1 suppresses skin carcinogenesis via the ARF-p53 pathway. Oncogene. 2006;25:867–76. doi: 10.1038/sj.onc.1209120. [DOI] [PubMed] [Google Scholar]
- 4.Sherr CJ. Divorcing ARF and p53: an unsettled case. Nat Rev Cancer. 2006;6:663–73. doi: 10.1038/nrc1954. [DOI] [PubMed] [Google Scholar]
- 5.Weber JD, Taylor LJ, Roussel MF, Sherr CJ, Bar-Sagi D. Nucleolar Arf sequesters Mdm2 and activates p53. Nat Cell Biol. 1999;1:20–26. doi: 10.1038/8991. [DOI] [PubMed] [Google Scholar]
- 6.Weber JD, Kuo ML, Bothner B, DiGiammarino EL, Kriwacki RW, Roussel MF, Sherr CJ. Cooperative signals governing ARF-mdm2 interaction and nucleolar localization of the complex. Mol Cell Biol. 2000;20:2517–2528. doi: 10.1128/mcb.20.7.2517-2528.2000. [DOI] [PMC free article] [PubMed] [Google Scholar]
- 7.Llanos S, Clark PA, Rowe J, Peters G. Stabilization of p53 by p14ARF without relocation of MDM2 to the nucleolus. Nat Cell Biol. 2001;3:445–452. doi: 10.1038/35074506. [DOI] [PubMed] [Google Scholar]
- 8.Korgaonkar C, Zhao L, Modestou M, Quelle DE. ARF function does not require p53 stabilization or Mdm2 relocalization. Mol Cell Biol. 2002;22:196–206. doi: 10.1128/MCB.22.1.196-206.2002. [DOI] [PMC free article] [PubMed] [Google Scholar]
- 9.Kamijo T, Zindy F, Roussel MF, Quelle DE, Downing JR, Ashmun RA, Grosveld G, Sherr CJ. Tumor suppression at the mouse INK4a locus mediated by the alternative reading frame product p19ARF. Cell. 1997;91:1–20. doi: 10.1016/s0092-8674(00)80452-3. [DOI] [PubMed] [Google Scholar]
- 10.Sato F, Harpaz N, Shibata D, Xu Y, Yin J, Mori Y, Zou TT, Wang S, Desai K, Leytin A, Selaru FM, Abraham JM, Meltzer SJ. Hypermethylation of the p14(ARF) gene in ulcerative colitis-associated colorectal carcinogenesis. Cancer Res. 2002;62:1148–51. [PubMed] [Google Scholar]
- 11.Onel K, Cordon-Cardo C. MDM2 and prognosis. Mol Cancer Res. 2004;2:1–8. [PubMed] [Google Scholar]
- 12.Menendez S, Khan Z, Coomber DW, Lane DP, Higgins M, Koufali MM, Lain S. Oligomerization of the Human ARF Tumor Suppressor and Its Response to Oxidative Stress. J Biol Chem. 2003;278:18720–18729. doi: 10.1074/jbc.M211007200. [DOI] [PubMed] [Google Scholar]
- 13.Bertwistle D, Sugimoto M, Sherr CJ. Physical and functional interactions of the Arf tumor suppressor protein with nucleophosmin/B23. Mol Cell Biol. 2004;24:985–96. doi: 10.1128/MCB.24.3.985-996.2004. [DOI] [PMC free article] [PubMed] [Google Scholar]
- 14.Bothner B, Lewis WS, DiGiammarino EL, Weber JD, Bothner SJ, Kriwacki RW. Defining the molecular basis of arf and hdm2 interactions. J Mol Biol. 2001;314:263–277. doi: 10.1006/jmbi.2001.5110. [DOI] [PubMed] [Google Scholar]
- 15.Bothner B, Aubin Y, Kriwacki RW. Peptides Derived from Two Dynamically Disordered Proteins Self-Assemble into Amyloid-like Fibrils. J Am Chem Soc. 2003;125:3200–3201. doi: 10.1021/ja028265w. [DOI] [PubMed] [Google Scholar]
- 16.Amente S, Gargano B, Diolaiti D, Della Valle G, Lania L, Majello B. p14ARF interacts with N-Myc and inhibits its transcriptional activity. FEBS Lett. 2007;581:821–5. doi: 10.1016/j.febslet.2007.01.062. [DOI] [PubMed] [Google Scholar]
- 17.Itahana K, Bhat KP, Jin A, Itahana Y, Hawke D, Kobayashi R, Zhang Y. Tumor suppressor ARF degrades B23, a nucleolar protein involved in ribosome biogenesis and cell proliferation. Mol Cell. 2003;12:1151–64. doi: 10.1016/s1097-2765(03)00431-3. [DOI] [PubMed] [Google Scholar]
- 18.DiGiammarino EL, Filippof I, Webster JD, Bothner B, Kriwacki RW. Solution structure of the p53 regulatory domain of the p19Arf tumor suppressor protein. Biochemistry. 2001;40:2379–2386. doi: 10.1021/bi0024005. [DOI] [PubMed] [Google Scholar]
- 19.Midgley CA, Desterro JM, Saville MK, Howard S, Sparks A, Hay RT, Lane DP. An N-terminal p14ARF peptide blocks Mdm2-dependent ubiquitination in vitro and can activate p53 in vivo. Oncogene. 2000;19:2312–2323. doi: 10.1038/sj.onc.1203593. [DOI] [PubMed] [Google Scholar]
- 20.Lohrum MA, Ashcroft M, Kubbutat MH, Vousden KH. Contribution of two independent MDM2-binding domains in p14(ARF) to p53 stabilization. Curr Biol. 2000;10:539–542. doi: 10.1016/s0960-9822(00)00472-3. [DOI] [PubMed] [Google Scholar]
- 21.Kussie PH, Gorina S, Marechal V, Elenbaas B, Moreau J, Levine AJ, Pavletich NP. Structure of the MDM2 oncoprotein bound to the p53 tumor suppressor transactivation domain. Science. 1996;274:948–953. doi: 10.1126/science.274.5289.948. [DOI] [PubMed] [Google Scholar]
- 22.Yu GW, Allen MD, Andreeva A, Fersht AR, Bycroft M. Solution structure of the C4 zinc finger domain of HDM2. Protein Sci. 2006;15:384–389. doi: 10.1110/ps.051927306. [DOI] [PMC free article] [PubMed] [Google Scholar]
- 23.Kostic M, Matt T, Martinez-Yamout MA, Dyson HJ, Wright PE. Solution structure of the Hdm2 C2H2C4 RING, a domain critical for ubiquitination of p53. J Mol Biol. 2006;363:433–50. doi: 10.1016/j.jmb.2006.08.027. [DOI] [PubMed] [Google Scholar]
- 24.Momand J, Zambetti GP, Olson DC, George D, Levine AJ. The Mdm-2 Oncogene Product Forms a Complex with the p53 Protein and Inhibits p53-Mediated Transactivation. Cell. 1992;69:1237–1245. doi: 10.1016/0092-8674(92)90644-r. [DOI] [PubMed] [Google Scholar]
- 25.Haupt Y, Maya R, Kazaz A, Oren M. Mdm2 promotes the rapid degradation of p53. Nature. 1997;387:296–9. doi: 10.1038/387296a0. [DOI] [PubMed] [Google Scholar]
- 26.Kubbutat MH, Jones SN, Vousden KH. Regulation of p53 stability by Mdm2. Nature. 1997;387:299–303. doi: 10.1038/387299a0. [DOI] [PubMed] [Google Scholar]
- 27.Bothner B. Molecular basis of the arf and hdm2 interaction. University of Tennessee; 2002. [Google Scholar]
- 28.DiGiammarino EL, Filippov I, Weber JD, Bothner B, Kriwacki RW. Solution structure of the p53 regulatory domain of the p19Arf tumor suppressor protein. Biochem. 2001;40:2379–86. doi: 10.1021/bi0024005. [DOI] [PubMed] [Google Scholar]
- 29.Harding SE, Chowdhry BZ. Protein-Ligand Interactions:hydrodynamics and calorimetry. Oxford University Press; Oxford: 2001. [Google Scholar]
- 30.Brown PH, Schuck P. Macromolecular size-and-shape distributions by sedimentation velocity analytical ultracentrifugation. Biophys J. 2006;90:4651–4661. doi: 10.1529/biophysj.106.081372. [DOI] [PMC free article] [PubMed] [Google Scholar]
- 31.Schuck P. Size-distribution analysis of macromolecules by sedimentation velocity ultracentrifugation and lamm equation modeling. Biophys J. 2000;78:1606–19. doi: 10.1016/S0006-3495(00)76713-0. [DOI] [PMC free article] [PubMed] [Google Scholar]
- 32.Schuck P, Perugini MA, Gonzales NR, Howlett GJ, Schubert D. Size-distribution analysis of proteins by analytical ultracentrifugation: strategies and application to model systems. Biophys J. 2002;82:1096–111. doi: 10.1016/S0006-3495(02)75469-6. [DOI] [PMC free article] [PubMed] [Google Scholar]
- 33.Wilkins DK, Grimshaw SB, Receveur V, Dobson CM, Jones JA, Smith LJ. Hydrodynamic radii of native and denatured proteins measured by pulse field gradient NMR techniques. Biochem. 1999;38:16424–31. doi: 10.1021/bi991765q. [DOI] [PubMed] [Google Scholar]
- 34.Kriwacki RW, Hengst L, Tennant L, Reed SI, Wright PE. Structural studies of p21(waf1/cip1/sdi1) in the free and Cdk2-bound state: Conformational disorder mediates binding diversity. Proc Natl Acad Sci USA. 1996;93:11504–11509. doi: 10.1073/pnas.93.21.11504. [DOI] [PMC free article] [PubMed] [Google Scholar]
- 35.Schwarzinger S, Kroon GJ, Foss TR, Chung J, Wright PE, Dyson HJ. Sequence-dependent correction of random coil NMR chemical shifts. J Am Chem Soc. 2001;123:2970–8. doi: 10.1021/ja003760i. [DOI] [PubMed] [Google Scholar]
- 36.Battiste JL, Wagner G. Utilization of site-directed spin labeling and high-resolution heteronuclear nuclear magnetic resonance for global fold determination of large proteins with limited nuclear overhauser effect data. Biochem. 2000;39:5355–65. doi: 10.1021/bi000060h. [DOI] [PubMed] [Google Scholar]
- 37.Iwahara J, Clore GM. Detecting transient intermediates in macromolecular binding by paramagnetic NMR. Nature. 2006;440:1227–30. doi: 10.1038/nature04673. [DOI] [PubMed] [Google Scholar]
- 38.Sherr CJ. The INK4a/ARF network in tumour suppression. Nat Rev Mol Cell Biol. 2001;2:731–737. doi: 10.1038/35096061. [DOI] [PubMed] [Google Scholar]
- 39.Lowe SW, Sherr CJ. Tumor suppression by Ink4a-Arf: progress and puzzles. Curr Opin Genet Dev. 2003;13:77–83. doi: 10.1016/s0959-437x(02)00013-8. [DOI] [PubMed] [Google Scholar]
- 40.Chen J, Marechal V, Levine AJ. Mapping of the p53 and mdm-2 interaction domains. Mol Cell Biol. 1993;13:4107–4113. doi: 10.1128/mcb.13.7.4107. [DOI] [PMC free article] [PubMed] [Google Scholar]
- 41.Honda R, Tanaka H, Yasuda H. Oncoprotein MDM2 is a ubiquitin ligase E3 for tumor suppressor p53. FEBS Lett. 1997;420:25–27. doi: 10.1016/s0014-5793(97)01480-4. [DOI] [PubMed] [Google Scholar]
- 42.Chiti F, Dobson CM. Protein misfolding, functional amyloid, and human disease. Annu Rev Biochem. 2006;75:333–66. doi: 10.1146/annurev.biochem.75.101304.123901. [DOI] [PubMed] [Google Scholar]
- 43.Fowler DM, Koulov AV, Balch WE, Kelly JW. Functional amyloid--from bacteria to humans. Trends Biochem Sci. 2007;32:217–24. doi: 10.1016/j.tibs.2007.03.003. [DOI] [PubMed] [Google Scholar]
- 44.Zhang S, Holmes T, Lockshin C, Rich A. Spontaneous assembly of a self-complementary oligopeptide to form a stable macroscopic membrane. Proc Natl Acad Sci U S A. 1993;90:3334–8. doi: 10.1073/pnas.90.8.3334. [DOI] [PMC free article] [PubMed] [Google Scholar]
- 45.Altman M, Lee P, Rich A, Zhang S. Conformational behavior of ionic self-complementary peptides. Protein Sci. 2000;9:1095–105. doi: 10.1110/ps.9.6.1095. [DOI] [PMC free article] [PubMed] [Google Scholar]
- 46.Neidhardt FC, Bloch PL, Smith DF. Culture medium for enterobacteria. J Bact. 1974;119:736–747. doi: 10.1128/jb.119.3.736-747.1974. [DOI] [PMC free article] [PubMed] [Google Scholar]
- 47.Cavanagh J, Fairbrother WJ, Palmer AG, III, Skelton NJ. Protein NMR Spectroscopy. Academic Press; New York: 1996. [Google Scholar]
- 48.Delaglio F, Grzesiek S, Vuister GW, Zhu G, Pfeifer J, Bax A. NMR Pipe: A multidimensional spectral processing system based on UNIX pipes. J Biomol NMR. 1995;6:277–293. doi: 10.1007/BF00197809. [DOI] [PubMed] [Google Scholar]
- 49.Luo R, Liu M, Mao XA. Eliminating systematic error in multiple quantum diffusion measurements by bipolar gradient pulses. Meas Sci Technol. 1998;9:1347–50. [Google Scholar]
- 50.Laue TM, Shah BD, Ridgeway TM, Pelletier SL. In: Analytical Ultracentrifugation in Biochemistry and Polymer Science. Harding SE, Rowe AJ, Horton JC, editors. The Royal Society of Chemistry; Cambridge: 1992. pp. 90–125. [Google Scholar]
Associated Data
This section collects any data citations, data availability statements, or supplementary materials included in this article.