

Abstract
Substantial questions have been raised about the validity of using computer-based testing to assess cognitive development with young children. However, little work has been done to assess the comparability of performance elicited using computerized methods with performance garnered using standard testing methods. The purpose of this study was to establish whether computerized testing resulted in performance that was different than established performance norms for infant monkeys (Macaca nemestrina) tested on four highly used cognitive tasks. Infants performed comparably on simple discrimination, reversal learning, and delayed nonmatch-to-sample rule learning. However, the infants tested in a computer testing-environment appeared to have difficulty on a task that required them to form response strategies. The results of the study reveal some apparent limitations of computer-based testing with infants, but do show that performance on several common cognitive tasks is comparable between the environments.
There has been a subtle methodological shift occurring in developmental psychology towards the increased use of computers to administer tasks and record direct responses from children. Some have noticed this switch and called into question the validity and generalizability of performance elicited in this environment (e.g. Carver, Meltzoff & Dawson, 2006). However, most researchers have ignored or not considered potential problems in directly comparing results of computer testing with those from standard testing methods despite substantial methodological differences that exists between the two environments (see Diamond & Kirkham, 2005 for an example). The biggest concern with computer-based testing focuses on whether children approach tasks administered via a computer in a way that is comparable to tasks administered with standard methods. In other words, there are doubts within the field that tasks administered in the two environments are measuring the same cognitive process. The validity of this concern has important implications for the field. Most tasks administered in MRI and EEG studies use computer methods. On the other hand, most studies addressing behavioral principles with young children or monkeys use humans conducting tests with 3-D stimuli (e.g. reversal learning in children by Overman et al, 1996 and in monkeys by Bachevalier, Hagger & Bercu, 1989). Despite these methodological differences, results from both approaches have been used interchangeably (see Clark, Cools, & Robbins, 2004 for an example).
There is indirect evidence that comparisons across these methodologies may not be wise in some situations. It has been shown that young children do not perform strategy formation tasks comparably between human and computer administration (Luciana & Nelson, 2002). There is also evidence that children have slower neurophysiological responses to 2-D than to 3-D objects (Carver, Meltzoff & Dawson, 2006). Furthermore, the brain areas associated with reward and reversal learning may be different when testing is done by humans than when testing is in a computer based environment (Wilson & Rolls, 2005).
The issue with using computers to administer behavioral tasks is not whether young children can perform the tests and learn in this environment, but rather whether they are performing comparably despite the inherent and in some cases, necessary changes in methodology. The issue of task comparability is especially germane when tasks have been administered across species or when the task is a “classic” behavioral tests that has a long history in the behavioral and neuropsychological literatures. Our knowledge of basic developmental processes and brain-behavior relations has been established with such tasks (see Roberts, 1996). Accordingly, the present study focuses how young monkeys (Macaca nemestrina) perform in a computer environment in relation with long-established norms gathered in Wisconsin General Testing Apparatus (WGTA) environment on widely used cognitive tasks. The purpose of the study is to establish whether the methodological differences between the two environments result in changes in the developmental trajectories and milestone attainment on these tasks.
Cognitive Tasks
Discrimination and Reversal Learning
The ability to form stimulus-reward associations is a fundamental aspect of learning, as is the ability to break these associations and reverse them (Schultz & Dickinson, 2000). It has been proposed that reversing stimulus-reward associations is a fundamental executive function (Clark, Cools, & Robbins, 2004). There has been a recent resurgence in the literature investigating the neural mechanisms underlying both initial formation of stimulus-reward associations and reversing these associations (see Rolls, 2000; Thorpe, Rolls, & Maddison, 1983; Clark, Cools, & Robbins, 2004; Schultz & Dickinson, 2000; Clarke, Dalley, Crofts, Robbins, et al., 2004)
Young children and monkeys make more errors on simple discrimination and reversal problems than older conspecifics (Harlow, Harlow, Ruepling & Mason, 1960; Kendler & Kendler, 1970; Smiley & Weir, 1966). However, performance on 2-object discrimination reaches mature levels earlier than it does on reversal tasks (Kendler & Kendler, 1970). The protracted development of reversal learning performance reflects the prolonged development of the prefrontal areas (e.g. Clark, Cools, & Robbins, 2004; Goldman-Rakic, 1987).
Learning Set
The learning set (LS) task was developed by Harlow in response to the contemporary view in psychology that animal learning was controlled by stimulus-reward associations (Harlow, 1949). Harlow’s intention was to develop a task that allowed the animal to demonstrate learning that could not be explained by stimulus-reward theories (e.g., Harlow & Hicks, 1957). In LS, the animal is tested on a series of discrimination problems. Animals who succeed on this task not only show improvement within problems, but also between problems. They become better at discriminating rewarded from nonrewarded objects regardless of specific stimulus features. This behavior indicates that they can learn a general concept about performing the task. LS has been used as a benchmark task of conceptual learning in both animal (Medin, 1972) and human (Levinson & Reese, 1967) developmental studies.
Preschool children younger than five (Levinson & Reese, 1967) and rhesus monkeys less than one year of age (Harlow, Harlow, Rueping & Mason, 1960) have poor within-problem performance and between-problem performance is also inferior to that of adults. Thus, not only do these young monkeys have difficulty learning the stimulus-reward association of each problem, they do not easily transfer what they have learned about the task between problems. The source of the immature performance may reflect an inability to form efficient strategies. Children have been shown to have difficulty performing strategy-based tasks in the computer environment in comparison to a standard testing-environment (Luciana & Nelson, 2002). Therefore, it is important to know whether this difficulty generalizes to other tasks that require strategy formation.
Nonmatch to Sample With Delays
Nonmatch to sample is considered to be a measure of recognition memory and associational processes. The duel nature of this task is demonstrated by the different brain areas implicated in learning the task versus remembering the sample over a delay. Learning the task rule is disrupted by lesions to the perirhinal cortex (Alvarado & Bachavalier, 2000, Malkova, Bachevalier, Webster & Mishkin, 2001) and in tracts that carry information from the medial temporal lobe to the frontal lobe (Buffalo, Ramus, Clark, Teng, et al., 1999). Amnesiacs with hippocampal (Squire, Zola-Morgan & Chen, 1988) or fornix (Gaffan, 1994) damage have difficulty with long delays between the sample and onset of the test phase, but can learn the nonmatching rule.
Interestingly, there is also a dissociation on this task during development. Children do not show the ability to learn the rule until 2-years old (Diamond, Towle & Boyer, 1994). However, they demonstrate good recognition memory much younger (Fagan, 1973). This developmental trend has also been documented with nonhuman primates. Both rhesus and pigtail macaques as young as 1 month of age show good working memory performance in a paired comparison paradigm (Bachevalier, 2001; Alvarado & Bachevalier, 2000; Gunderson & Swartz, 1985; Gunderson, Grant-Webster, & Fagan, 1987). However, rhesus monkeys do not show an ability to learn the nonmatching rule before the age of four months (Bachevalier & Mishkin, 1984). Young monkeys show improvement in the time it takes to learn the rule from four months to two years of age, when they demonstrate adult-like performance (Bachevavlier & Mishkin, 1984; Bachevalier, 2001). Infant children have been shown to be sensitive to the way in which stimulus-reward associations are presented in the task. Diamond and her colleagues (Diamond, Lee, & Hayden, 2003) found that children as young as 19 months can learn the task when the stimulus and reward are so closely paired that they are touching, but not when they are apart. Given the unusual stimulus reward pairings in the computer testing-environment, it is important to know whether performance by young monkeys on this widely used memory task is affected by the spatial discontinuity between stimulus and reward in the computer testing-environment.
Analysis Strategy
The overall analysis strategy in this study was to treat the WGTA data as population values representing pigtail macaques reared in the Infant Primate Research Laboratory (IPRL) under the standard conditions described by Ruppenthal and Sackett (1992). Thus, these data represent normative performance collected over the past 3 decades for typically developing animals reared in the IPRL. The purpose was to assess whether the data collected in the computer environment fall out of the range expected from the WGTA data. Therefore, the purpose was to investigate whether the methodological changes made between the environments were enough to change milestone attainment on these widely used tasks. Answering this question provides evidence for answering the bigger question of whether the same cognitive process is being measured in the two environments.
The WGTA data are considered the “standard” form of testing because WGTA-based methods have been the predominate method of data collection in studies of cognition with nonhuman primates and these methods closely mirror the way these tasks have been administered with children (see Overman, 1990). Performance by adult macaques has not been shown to be worse in computer testing versus WGTA presentation, and in some cases performance is better on computerized tests (Rumbaugh et al, 1989; Washburn, Hopkins & Rumbaugh, 1989). However, since young macaque monkeys have not been studied on computer versus WGTA performance, the data analyses were conducted with no expectations about the direction, or even existence, of any differences.
Methods
Subjects
Subjects were pigtailed macaques (Macaca nemestrina) brought to the IPRL within 1 or 2 days of birth. The monkeys were either noninvasive controls, a social partner for an animal in an invasive study, or a stock animal brought to the lab specifically for noninvasive test development. No attempt was made to exclude animals based on birth weight or gestational age. However, infants that had traumatic births requiring life-saving intervention were excluded. All animals were reared under standard nursery protocol. This rearing included ad libitum access to developmentally appropriate diets and enrichment toys, daily socialization with same-aged peers, human handling, and monitoring of physical, social, and cognitive development (Rupenthal & Sackett, 1992). The animals included in the WGTA analysis were tested between 1980 and 2003, whereas the computer tested animals were tested in 2004 and 2005. Animals tested in the 1970s were excluded from these data because it was found that they significantly and meaningfully differed from other cohorts on all outcome measures. These differences were likely due to the fact that this cohort was significantly older and had greater age variability (M = 202, SD = 111.8) when they began testing than the other 3 cohorts (M = 137, SD = 19.6). No additional meaningful differences were found in the remaining sample. The number of animals included in each analysis is outlined in table 1, as is the learning history of the computer tested animals. Causes of the disparate WGTA task sample sizes include animals leaving the IPRL before completing the battery, data being lost, or data being entered incorrectly. The number of subjects used to analyze the computer testing performance differs for each task because many of these subjects were used to test other behavioral hypothesis in accordance with administrative recommendations to reduce and reuse the number of animals in these studies.
Table 1.
Learning History of Computerized Tested Animals
| Group | Task 1 | Task 2 | Task 3 | Task 4 | Task 5 |
|---|---|---|---|---|---|
| A (n = 4) | 2-Object Discrimination | Reversal Learning | Learning Set Formation | Nonmatch to Sample | Delayed Nonmatch to sample |
| B (n = 4) | 2- Object Discrimination | Learning Set Formation | Reversal Learning | Nonmatch to Sample | Delayed Nonmatch to Sample |
| C (n = 4) | 2-Object Discrimination | Conditional Reversal Learning | Spatial Search | Learning Set Formation | Nonmatch to Sample |
| D (n =4) | 2-Object Discrimination | Spatial Search | Learning Set Formation | Conditional Reversal Learning | |
| WGTA | 2-Object Discrimination N = 220 | Reversal Learning N = 214 | Hamilton Search | Learning Set N = 192 |
Note. Tasks in italics were not included in this analysis
Animals tested in the WGTA began adaptation at 120 postnatal days of age (PND). Animals tested in the computer environment began touch screen training at 90 PND. This earlier start date was implemented so that computer tested animals would have enough time to be trained to use the touch screen and begin the first cognitive assessment in the battery at the same age as the WGTA tested animals.
The WGTA has been described extensively elsewhere (see Harlow & Bromer, 1938; Bachevalier & Mishkin, 1984; Overman, 1990). Briefly, the apparatus consists of an occluding barrier that allows the tester to set-up the trials out of the view of the animal. The trials are set on a presentation tray that has 3 food wells in which the reward is placed. These wells can be completely covered by the stimuli so that the reward is hidden. Once the trial is set, the tester then slides the tray towards the animal and the occluding barrier is raised allowing the animal to chose a stimulus and retrieve a reward if correct.
Computer Testing-Environment
Test Cage
Figure 1 illustrates the computer environment used in this study. Testing occurred in a 51 × 38 × 91.5 cm wire-mesh cage, similar to the animal’s homecage. The view from the sides of the cage was blocked by two removable plastic barriers. The view out of the door was occluded except for the top three inches, which allowed the animal to be monitored through closed circuit television.
Figure 1.
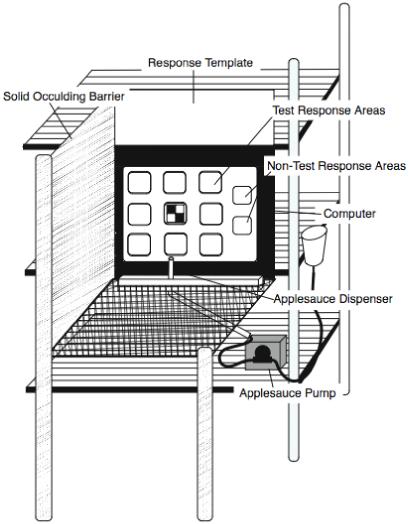
Illustration of the computer testing-environment.
The test end of the cage opposite the door had a Lexan insert (51 × 38 cm) with 11 (3.8 × 3.8 cm) square openings that served as a template. Each of these openings aligned to the 11 response areas - 9 test areas and 2 nontest areas - on the touch screen when the cage was pushed flush to the monitor. This template helped to restrict the young animal’s typical sweeping motor responses to only potentially active areas on the screen. The template was selectively darkened so that animals could only see the part of the screen containing the test areas.
Applesauce was delivered to the animal through a metal tube mounted through the bottom of the cage. The tube was placed 15 cm from the inside left edge of the cage and 5 cm from the template surface, making it centered with the 9 test areas on the screen. The tube was held in place by a steel mounting box. Dispensing applesauce was controlled by a pneumatic pump (MasterFlex L\S, Cole Palmer, Vernon Hill, IL) modified by the Washington National Primate Research Center’s Bioengineering Department. The pump was controlled by the software via a USB digital to analog relay device (PIO-USB-9472, National Instruments, Austin, TX).
Computer System
Computers used in this study were either Dynapro (now 3M) integrated 15 inch capacitive touch screen systems, or a 19 inch capacitive Microtouch 1500 (3M, St. Paul, MN) touch screen connected to an Optiplex CPU (Dell, Round Rock, TX). The CPUs for the Dynapro computers were 133 MHz Pentium I class processors with 13 gigabyte hard drives and 275 megabytes of random access memory (RAM). The computers ran Microsoft Windows 98 and were connected to a central server via an Ethernet connection. The Optiplex computer was a 1.5 Ghz Pentium III class processor with 80 gigabyte hard drive and 1 gigabyte of RAM. This computer ran Microsoft Windows XP SP2 and was connected to a central server via Ethernet. Despite the major computing difference between the computers, there were no differences in how the animal needed to interact with the touch screen or how the computers presented the tasks.
The software used in this study was written in Visual Basic.NET (Microsoft, Redmond, WA). All data collected by the software were written to an MS Access (Microsoft, Redmond, WA) database. The capabilities of the software and the structure of the database are explained extensively in the Advanced Learning User and Technical Manual available electronically from the authors. There are features of the software, however, that are important for understanding the overall test environment.
The software utilizes both positive and negative visual feedback. There were no auditory feedback signals. Both types of visual feedback signals are presented for 2 seconds and are initiated when a touch has been registered. The positive feedback signal clears all stimuli off the screen and changes the background color of the screen from dark gray to white. During a positive feedback signal the applesauce pump is turned on and reward is delivered. For the negative feedback signal, the screen goes blank and a 150 × 150 pixel black “X” on a white background appears where the touch was registered.
Training Procedure for Computer Testing Shaping Procedure
The touch screen training procedure was begun on the Monday closest to the monkey’s 90-day birthday. The training procedure has been described in depth in Mandell & Sackett (2008). A single stimulus (150 × 150 pixels) was randomly presented in 1 of the 9 test areas. The program randomly rotated through all nine response areas and through nine stimuli so that the animal was potentially seeing a different stimulus in a different location on each trial. During training, all nine response areas were active regardless of where the stimulus was located on the screen. As long as the animal triggered the touch screen in any one of the test areas, a screen activation event occurred. The result of this event, whether it was a positive feedback signal or a negative feedback signal, was controlled by the tester and was dependent upon the current training stage.
Training was based on shaping and instrumental learning principles. The animal was taught, through successive approximation, to approach the screen, touch the template surrounding the screen, touch the screen, and then to only touch where there was a stimulus on the screen. An animal was considered trained when it touched the stimulus and activated the screen on at least 90% of the 30 trials presented in 1 day, or on at least 80% of test trials 3 days in a row. All animals in this study (N = 16) passed in a mean of 23.25 days (SD = 7.25).
Discrimination and Reversal Learning
Upon completion of the adaptation procedure in each learning environment, animals began 2-object discrimination and subsequent reversal learning. They were presented with two objects differing on the single perceptual dimension of color in both the WGTA and computerized tasks. One of the objects was randomly assigned to be rewarded. Upon learning this response rule, the reward contingency was switched so that the previously non-rewarded item was now being rewarded.
WGTA Specific Methods
Objects in the WGTA were black and white blocks. They were randomly placed over two wells, with the rewarded item covering a baited well containing a piece of grape or a raisin. The location of the reward was pseudo-randomly determined so that the same well could not be baited on more than 3 trials in a row. Criterion for passing 2-object discrimination was 90% correct in a single test day of 25 trials. The session after reaching criterion, the reward contingency was switched to begin the reversal phase. The animal was again tested to a criterion of 90% correct in a single session of 25 trials.
The 220 subjects (113 male, 107 female) in this analysis had non-ambiguous start dates for the discrimination and reversal tasks. The discrimination task was passed by 214 animals and 211 animals passed the reversal task. Given the historical nature of these data, it was unclear why there were no passing scores for 9 animals. These animals were kept in the sample and no attempt was made to compensate for their missing data. The mean age to begin 2-object discrimination was 143.8 days (SD = 28.55, range 117-415 PND). Animals began reversal learning at a mean of 157.8 days (SD = 44.4, range 122-516 PND).
Computer Testing Specific Methods
Images were colored squares with a 4 square checkerboard pattern. The checkerboard was made from dark and light shades of the same color. The images were purple or orange blocks, novel colors in this environment. Animals were randomly assigned to orange or purple as the rewarded image. Each image appeared randomly in one of the nine possible test locations on each trial. There were no limitations placed on where the images could appear or if they could appear in the same location over the course of many trials.
Criterion for passing both 2-object discrimination and reversal learning was 80% correct on 25 trials in a single test day. This criterion was lower than that in the WGTA because we were concerned about animals being incorrect because of errant touches or equipment failure rather than a lack of learning. While strict criteria were used for passing adaptation, pilot work suggested that some animals were still refining their screen touching behavior during the 2-object discrimination task, which necessitated the lower criterion. The criterion for passing was set to a level that required substantial learning but did not overly penalize the animal for occasional errant touches such as leaving a hand resting on the screen.
Four animals that were tested on both 2-object discrimination and the comparable reversal task were included in the analysis. The other animals’ data were not included because they were tested on a form of 2-object discrimination and reversal learning that is not comparable to the WGTA version of the task. The average age to begin 2-object discrimination was 131 days (SD = 3.46, Median = 131 days). Animals began reversal learning at a mean of 137.25 days (SD = 2.98, Median = 137 days).
Analysis Strategy
The dependent measure of days to criterion for the WGTA data were not expected to be normally distributed because most animals pass 2-object discrimination in just a few test sessions. Therefore, survival analysis was used to calculate the median number of test sessions to criterion for the WGTA data for each task. This analysis also produced the probability of an animal passing on a particular test day. The performance of the computer tested animals was compared to these survival curves. Individual data from the four animals, as well as performance for the total sample, were compared to the survival curves to determine if the sample as a whole or if any individual animal was outside of the expected range established with the WGTA data.
Learning Set
In the LS procedure, animals were presented with 2-object stimulus sets that varied on multiple dimensions. One of the objects in the set was randomly assigned to be rewarded. The objects were presented for six trials, then a new set of objects was presented (Sterritt, Goodenough & Harlow, 1963). Six problems (object sets) were presented to the animal each test day until the animal was tested on 240 problems.
WGTA Specific Methods
The LS stimuli were 480 unique objects attached to plastic bases that completely covered two reward wells. The objects were small children’s toys paired so that were easy for humans to discriminate. The location of the rewarded object was pseudo-randomly determined so that no well contained the reward on more than three trials in a row. Each set was presented only once over the course of the procedure.
Animals began LS after completing Hamilton Search. This task, not reported here, is a spatial search task requiring the animal to find a reward hidden in one of four boxes. Animals began Hamilton Search after completing reversal learning. Upon completion of 15 test days of the search task, animals began LS testing.
The WGTA analysis included 192 animals who began LS at a mean age of 189.2 days (SD = 24.4, range: 150 - 368 days). Only animals completing all 240 problems were included in the analysis.
Computer Testing Specific Methods
Stimuli used for the computerized version of LS were digital photographs of the objects used in the WGTA version of the task. All photographs had a solid white background. The images were paired so that the foreground object and the predominate foreground color of the images were different.
Image sets, as well as which image in the set was rewarded, were randomly chosen by the computer each test day. Image sets could not repeat within a test day, but could repeat over the course of testing. Each animal saw an average of 153 unique sets (SD = 6.14, range 140 - 159). The most that any set repeated was six times over the course of 240 problems. The location of the images was randomly determined at the beginning of each trial so that each image appeared in one of the 9 possible response areas. There was no constraint on where the images were located with respect to each other or to previous trials.
Animals in the computerized version of LS either began testing the day after passing reversal learning (Groups A and B, M age = 159.3, SD = 19.6) or the day after completing 15 days of a spatial search task (Groups C and D, M age = 192.3, SD = 34.2). The spatial task, which is not reported here required the animal to touch one of four active areas on the screen until finding which area was rewarded. The learning history difference between the group tested on a spatial search task before learning set and the group that was not tested on this task assessed whether learning history impacted LS performance. While this spatial search task is not necessarily comparable to the Hamilton search task in the WGTA, the group that was tested on this task was thought to have a learning history that was more comparable to the WGTA animals.
Analysis Strategy
Data from each trial were summarized into 8 problem blocks, each consisting of 30 problems. Individual animals had data that can be conceptualized as a 6 trial by 8 problem block matrix. These summary data were analyzed with Repeated Measure ANOVA (RM-ANOVA) to test the effects of learning within a problem and learning across problem blocks. The key to this analysis, is the interaction between problem blocks and trials, which indicates whether learning transferred across problem blocks. A RM-ANOVA was done with the WGTA data independent of the computer testing data in order to describe the performance characteristics of these animals. The RM-ANOVA conducted with the computer tested animals contained a between subject variable differentiating the animals tested on spatial learning prior to LS (n = 8) and those who were not (n = 8). The Huynh-Feldt epsilon correction was used when there was a violation of sphericity. The epsilon and corrected p-values are reported with the ANOVA results.
The performance levels for the final 30 problems were then compared between the computer tested animals and the WGTA data. Z-scores were computed using the problem-block variance and mean from the WGTA data as the population values. Mean differences with z-scores that were more extreme than ±1.95 were judged to be different from the WGTA population norms
Nonmatch to Sample with Delays
Computer Testing Specific Methods
During the training phase of nonmatch to sample (NMS), animals learned the response rule - respond to the novel stimulus in a novel-familiar pair. Animals were presented with the sample in the center position of the computer screen. Upon touching it, the screen cleared for 2 seconds, then the familiar-novel test pair was presented. Neither of the test images were presented in the center position of the screen and both were symmetrically positioned from the center. A complete description of how these images were presented spatially can be found in the Advanced Learning User and Technical Manual, available electronically from the authors. The stimulus pairs were randomly chosen from an image bank. Images were not pre-paired as they were with the learning set images. No image repeated on a test day, but could repeat over the course of multiple days. Images pairs were drawn from a bank of 300 digital photos of the toys used as stimuli in the WGTA. These images were all novel to the animals.
Animals began the delay phase (DNMS) after they succeeded in responding to the novel stimulus on 80% of trials in three separate test sessions consisting of 25 trials each during NMS. The delay began after the animal cleared the sample by touching it. The test was presented after this delay. Animals were tested on delays of 5, 10, 15, 30 and 60 seconds. A single delay was presented within a test session. Animals were not moved to a longer delay until they passed the shorter one. Each session consisted of 25 trials, except the 60 second delay sessions which consisted of 18 trials. This adjustment in trials was needed to keep the session short enough to combat the resulting inattention or sleep that has been found when testing young animals with this long delay. Criterion for passing each delay was 80% correct in a single test session while responding to at least 80% of the trials.
There is a substantial difference between this NMS and DNMS procedure and those commonly described in the literature. This procedure does not reward responses to the sample. This historical IPRL procedure was implemented so that animals would not receive too many treats and become satiated. We kept this procedure in the computerized task, not only because of the issues of satiation but also because the time necessary for feedback and consumption of reward would result in a delay that would be detrimental to learning the task. There is no evidence to suggest that not rewarding the sample has a negative impact on learning. Some studies have even provided evidence that this procedure may be beneficial for learning the rule (Diamond, et al., 1994; Gaffan, et al., 1984).
Subjects were 12 animals trained on NMS - Groups A, B and C - and 8 animals that were then tested on DNMS - Groups A and B. Animals began NMS at 227 days of age (SD = 24.88, Range = 196 - 271 days). One animal was dropped from the DNMS analysis because of procedural irregularities due to experimenter error. One other animal was not included in the 60 second delay data because of excessive balking during this long delay. Excessive balking was defined as failure to respond within 60 seconds of the onset of a trial on more than 50% of the trials for 5 days in a row.
Analysis Strategy
There are no IPRL norms for the DNMS or NMS tasks. Therefore, the data for the computerized version of the task was compared to published data from comparable age pigtail and rhesus monkeys who were tested in the WGTA. Each animal’s performance was summarized in trials to criterion and test days to criterion. The means of these two measures were used to make comparisons between these data and published data.
Results
2-Object Discrimination and Reversal Learning
WGTA Norms
The mean days to criterion for 2-object discrimination was 4 (CI, 3 - 4) with a median of 3. By 6 days of testing 90% of the WGTA tested animals had passed 2-object discrimination. For reversal learning, the mean and median days to criterion were both 6 (CI, 6 - 7, 5 - 7, respectively). By 10 days of testing 90% of the WGTA tested animals had passed reversal learning. As has been reported with rhesus monkeys (Bachevalier et al, 1989), there was a significant sex difference with males performing better than females even after controlling for birth weight and gestational age (Cox regression for sex effect: expB(1)=.71, p=.05).
Computer Testing Performance
The computer tested animals completed 2-object discrimination in a median of 4 days, with all animals (n = 4) passing in 5 or fewer days. In the WGTA data, 87% of animals had passed this task by 5 days and 77% had passed by 4 days. Therefore, the performance of the computer tested animals was within the range of the normative WGTA data.
Computer tested animals passed reversal learning in a median of 8 days. All passed in 8 days or fewer. Within the WGTA data, 85% of animals passed reversal in 8 days or fewer. Thus, neither the performance of the group as a whole or of any individual animal was out of the normative WGTA range.
Learning Set
WGTA norms
Repeated measures ANOVA revealed a significant trial by problem block interaction, F(35, 6685) =18.5, p < .001. This outcome indicates that animals learned within a problem, as seen by their increase in responding to the rewarded item across the 6 trials. Additionally, animals transferred this learning between problem sets and their probability of being correct on trial 2 increased as the task progressed (figure 2).
Figure 2.
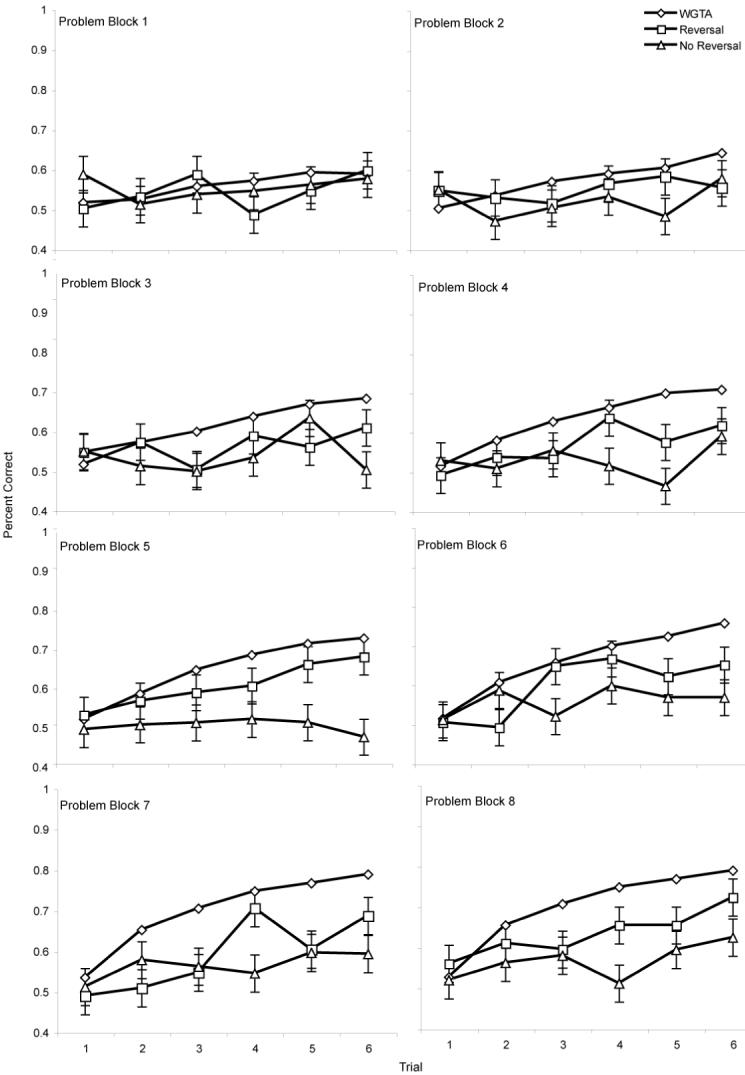
Learning set performance for computer tested animals in comparison to WGTA tested animals. Error bars are +/- 1 SE, utilizing the population standard deviation for each problem block to highlight the difference between the performance of the computer tested and WGTA animals.
Computer Testing Performance
Data from the computer tested animals were summarized in the same way as the WGTA data. These data were analyzed with RM-ANOVA with a between subjects factor added in order to explore differences between the 8 animals tested on the spatial search tasks and the 8 who were not.
There was a main effect for trial indicating that animals learned to discriminate within the problem, F(5, 70) = 7.11, p = .001, ε = .515. There was also a main effect for problem block indicating that performance changed over the course of the problems, F(7, 98) = 2.56, p = .024, ε = .873. However, there was not a significant trial by problem block interaction, F(35, 490) = 1.13, p = .122, ε = .112. The overall differences between the groups was also nonsignificant, F(1, 14) = .014, p = .91, suggesting that the spatial search task did not substantially impact performance. The lack of statistical findings was surprising because data from individual animals showed that there were animals who showed typical learning set performance and were performing at or above mean WGTA levels by the last block of problems.
The data were reanalyzed with a learning history distinction in order to explore whether the animals who succeeded on learning set could be grouped in a different way. The RM-ANOVA was rerun with a between subjects factor that distinguished the animals who were tested on some form of reversal learning before learning set (see Table 1; Groups A and C, n = 8) and those tested on a form of this task after learning set (Groups B and D, n = 8). In this analysis, there was a trend for a trial by block interaction, F(35, 490) = 1.38, p = .077, ε = 1.00. There was a significant trial by problem block by group interaction with the animals who were tested on reversal prior to LS showing the most improvement over the course of the task, F(35, 490) = 1.575, p = .021, ε = 1.00
Despite finding that there was a group of animals that showed evidence of learning across problems, both groups had performance levels significantly below the WGTA norms established in the IPRL. Figure 2 shows the performance of the computer tested animals in comparison to the WGTA normative performance. The group that was tested on reversal after LS was significantly below the WGTA norms on trials 2 - 6 for the last block of problems with z-score ranging from -2.2 to -5.6. The group that was tested on reversal learning before LS was also significantly below the WGTA norms on trials 3, 4, and 5 (z = - 2.7, -2.2, -2.2, respectively) but not on trial 2 (z = -1.1) or trial 6 (z = -1.3) in this last block of problems.
Nonmatch to Sample with Delays
Animals reached criterion on the NMS task in a mean of 24.4 days (SD = 9.17) using 596.6 trials (SD = 226.03). There was no significant relationship between age and trials to criterion (r = .01) or age and days to criterion (r = .03). Table 2 shows individual data on the DNMS task for each delay. The comparison between performance for these animals and animals tested in the WGTA will be drawn in the discussion section since the WGTA data for these tasks have been published elsewhere.
Table 2.
Data From Individual Animals Showing Days to Criterion to Pass The Training Phase and Each Delay on Nonmatch to Sample
| Delay in Seconds | |||||||
|---|---|---|---|---|---|---|---|
| Group | Animal | Training | 5s | 10s | 15s | 30s | 60s |
| A | K04184 | 15 | 4 | 1 | 1 | 4 | 5 |
| M04038 | 17 | 1 | 1 | 1 | 1 | 3 | |
| M04041 | 37 | 8 | 2 | 4 | 10 | --- | |
| M04183 | 19 | 1 | 1 | 1 | 2 | 3 | |
| Mean | 22 (10.13) | 3.5 (3.32) | 1.25 (0.50) | 1.75 (1.50) | 4.25 (4.03) | 3.67 (1.15) | |
| B | K04207 | 26 | 2 | 2 | 3 | 3 | 1 |
| M04203 | 42 | 2 | 1 | 1 | 1 | 1 | |
| M04205 | 18 | 9 | 1 | 6 | 1 | 2 | |
| K04216 | 28 | --- | --- | --- | --- | --- | |
| Mean | 28.5 (9.98) | 4.3 (4.04) | 1.3 (0.58) | 3.3 (2.52) | 1.7 (1.15) | 1.3 (0.58) | |
| C | K04362 | 29 | --- | --- | --- | --- | --- |
| K05105 | 17 | --- | --- | --- | --- | --- | |
| M04361 | 14 | --- | --- | --- | --- | --- | |
| M05065 | 31 | --- | --- | --- | --- | --- | |
| Mean | 22.75 (8.5) | ||||||
Note: Standard deviations are given in parenthesis.
Discussion
2-Object Discrimination and Reversal Learning
These analyses suggest that young animals performed comparably in the computer environment to animals in the WGTA environment. As a group, the number of test session needed to pass discrimination and reversal learning was within the normative range of the WGTA data. This finding provides evidence that a comparable cognitive process can be assessed with this task across environments.
Learning Set
There was little evidence that animals in the computerized version of learning set had performance levels comparable to the WGTA group. The poor performance by the computer tested groups in comparison to the WGTA norms is concerning. Rule learning and concept formation is a predominant feature of cognitive testing with nonhuman primates and young children. Therefore, it is important that any change in testing procedure or in test presentation does not interfere with the ability to learn concepts and rules.
The computer testing-environment has been shown to be an effective environment for adult rhesus monkeys to succeed on learning set formation despite substantial methodological differences (Washburn, Hopkins & Rumbaugh, 1989). It has even been touted as a better environment than the WGTA to test learning set formation (ibid). However, infant pigtail monkeys in this study did not show the same benefits afforded adult rhesus monkeys.
The problem that animals had on this task probably did not stem from a general deficit in learning rules or concepts in this environment. If animals could not learn response rules or concepts in this environment, they would not have performed well on NMS. Therefore, the problem with LS may be related to differences in the types of strategies afforded by the two environments. In the WGTA, strategies may be spatially oriented - respond to the same side - or object oriented - respond to the same stimulus (Harlow, 1950). However in the computer environment used here, spatial strategies are difficult to form or would be complex in nature if they were utilized because objects can be side by side, up and down or diagonal to one another. This complex spatial arrangement has not been found to be detrimental to adult monkey learning on LS (Washburn, Hopkins & Rumbaugh, 1989). However, this aspect of computerized testing may serve to confuse the infant monkey or result in “superstitious” strategies. It may also be that young animals approached the task differently in the computer environment than the WGTA environment and therefore used different strategies or no strategies. Because the computer environment is novel and has frequently changing contingencies, young animals may not generalize across problems easily and approach each problem separately rather than using previous experience to guide performance.
It is also reasonable to believe that the spatial discontiguity between stimulus and reward that is present in computerized testing maybe negatively impacting performance, as this has been found to affect learning with young children (Diamond, Lee & Hayden, 2003). The testing system used in this study, however, was designed to specifically address this problem by providing a visual signal - positive feedback - that is contiguous with the stimulus and conditioned to signal reward delivery (Mandell & Sackett, 2008). If discontiguity was negatively impacting learning, performance on other tasks would also be affected. Specifically, performance on NMS would likely be impacted as children have been shown to have problems with discontiguity on this task. Given that NMS performance was good, it seems unlikely that discontiguity between stimulus and reward is the source of the difficulty on LS. Rather, it is more likely that the problems on this task are specific to the way the task was presented or may reflect a general problem with strategy utilization that is independent of general learning processes.
If these hypotheses stand up to further testing, then our ability to compare strategy utilization between the environments could be compromised. This limitation could have effects on interpretation and comparison between test environments of LS data as well as search tasks (e.g self-ordered search) and planning tasks (e.g., Tower of London) where the strategy employed is a direct measure of performance. Others have also reported problems with these types of strategy-based tasks in the computerized testing-environment. Notably, there have been problems reported with young children’s performance on computerized versions of the Tower of London task included in CANTAB (Luciana & Nelson, 2002). Luciana and Nelson (1998 & 2002) reported that only 50% of 4-year-olds in their sample could begin the computerized version of the task, whereas others have successfully used non-computerized versions of this task with 3- and 4-year-olds (e.g. Carlson, Moses & Claxton, 2004). These results, paired with the difficulty that young animals in this study had with solving LS, suggests that caution should be used when assessing strategy-based skills in the computerized environment and that the cognitive processes tested by these tasks maybe different between the environments for the very young.
Nonmatch-to-Sample
The nonhuman primate literature on DNMS and learning the NMS rule indicates progressively better performance from 4 months to 2 years of age (Bachevalier & Mishkin, 1984). Data with pigtail monkeys show good acquisition of the response rule in the WGTA by the age of 2 years, with these monkeys reaching 80% correct on NMS within 400 trials (Fredrickson, et al., 1987). Cross-sectional work comparing learning across age groups shows that by 6 months of age rhesus monkeys learn this task in about 480 trials or 24 test days (Bachevalier & Mishkin, 1984; Bachevalier, 2001; but see Malkova, et al., 2001 for an example of quicker acquisition) and 12-month old rhesus monkeys (Bachevalier & Mishkin, 1984) can acquire the response rule in about 240 trials or 12 days. Based on these data, the average performance of the computer tested animals - 24 days to criterion or 596 trials - were at levels comparable to these published reports.
All animals performed well on DNMS, showing that they had learned the NMS rule and used it consistently in the computer environment. These results are comparable to published reports that also show high levels of performance on delays as long as 60 seconds with 6-month-old rhesus monkeys (Bachevalier & Mishkin, 1984; Bachevalier, 2001; Malkova, et al., 2001). This finding is promising for using the computer testing-environment to detect drug effects or other brain insults that are thought to affect medial temporal lobe and hippocampal functioning.
Conclusion
The purpose of this study was to explore how behavior on tasks administered with computer-based methods compared with standard testing methods. The performance of the animals in this study on 2-object discrimination, reversal learning and NMS was in line with what would be expected based on WGTA data from the IPRL and performance levels reported in the literature. This finding supports the conclusion that very young animals can learn in this environment and that performance levels and cognitive milestone attainment assessed with computerized testing follows what would be expected from WGTA testing.
However, our data combined with results reported in the literature with young children suggests that caution should be used when assessing strategy-based performance with very young children and young monkeys. While adult monkeys (Rumbaugh et al., 1989) and children as young as 5-years old (Luciana & Nelson, 2002) have been shown to be able to perform strategy-based tasks in the computer environment, the methods used in this environment may pose particular difficulties for the very young that compromises their ability to form or use strategies effectively. Specifically, the complex spatial arrangement of images may have hurt the animals rather than helped them focus on object oriented strategies. Until the source of this difficulty can be identified with further study driven by theoretical considerations of the learning environment and strategy utilization, computerized versions of these types of neuropsychological tasks should be used cautiously with very young age groups.
Acknowledgments
This work was supported by Royalty Research Fund Award 65-0451 from the University of Washington to G. P. Sackett, NIH grants RR00166 to the Washington National Primate Research Center and NIH grant HD02274 to the Center for Human Development and Disability. A portion of these data were presented at the annual meeting of the American Society of Primatologists, August 2006. Data from this paper were submitted as partial fulfillment of a doctoral degree by D. J. Mandell. The authors would like to thank Sarah Ward and Nahzinine Shakeri for their help with testing animals and the staff at the IPRL for support.
References
- Alvarado MC, Bachevalier J. Revisting the maturation of medial temporal lobe memory functions in primates. Learning & Memory. 2000;7:244–256. doi: 10.1101/lm.35100. [DOI] [PubMed] [Google Scholar]
- Bachevalier J. Neural bases of memory development: Insights from neuropsychological studies in primates. In: Nelson CA, Luciana M, editors. Handbook of developmental cognitive neuroscience. MIT Press; Cambridge, MA: 2001. pp. 365–379. [Google Scholar]
- Bachevalier J, Hagger C, Bercu BB. Gender differences in visual habit formation in 3-month-old rhesus monkeys. Developmental Psychobiology. 1989;22:585–599. doi: 10.1002/dev.420220605. [DOI] [PubMed] [Google Scholar]
- Bachevalier J, Mishkin M. An early and a late developing system for learning and retention in infant monkeys. Behavioral Neuroscience. 1984;98:770–778. doi: 10.1037//0735-7044.98.5.770. [DOI] [PubMed] [Google Scholar]
- Buffalo EA, Ramus SJ, Clark RE, Teng E, Squire LR, Zola SM. Dissociation between the effects of damage to perirhinal cortex and area TE. Learning and Memory. 1999;6:572–599. doi: 10.1101/lm.6.6.572. [DOI] [PMC free article] [PubMed] [Google Scholar]
- Carlson SM, Moses LJ, Claxton LJ. Individual differences in executive functioning and theory of mind: An investigation of inhibitory control and planning ability. Journal of Experimental Child Psychology. 2004;87:299–319. doi: 10.1016/j.jecp.2004.01.002. [DOI] [PubMed] [Google Scholar]
- Carver LS, Meltzoff AN, Dawson G. Event-Related potential (ERP) indices of infants’ recognition of familiar and unfamiliar objects in two and three dimensions. Developmental Science. 2006;9:51–62. doi: 10.1111/j.1467-7687.2005.00463.x. [DOI] [PMC free article] [PubMed] [Google Scholar]
- Clark L, Cools R, Robbins TW. The neuropsychology of ventral prefrontal cortex: Decision-making and reversal learning. Brain and Cognition. 2004;55:41–53. doi: 10.1016/S0278-2626(03)00284-7. [DOI] [PubMed] [Google Scholar]
- Clarke HF, Dalley JW, Crofts HS, Robbins TW, Roberts AC. Cognitive inflexibility after prefrontal serotonin depletion. Science. 2004;304:878–880. doi: 10.1126/science.1094987. [DOI] [PubMed] [Google Scholar]
- Diamond A, Kirkham N. Not quite as grown-up as we like to think: Parallels between cognition in childhood and adulthood. Psychological Science. 2005;16:291–297. doi: 10.1111/j.0956-7976.2005.01530.x. [DOI] [PMC free article] [PubMed] [Google Scholar]
- Diamond A, Lee E, Hayden M. Early success in using the relation between stimuli and reward to deduce an abstract rule: Perceived physical connection is key. Developmental Psychology. 2003;39:825–847. doi: 10.1037/0012-1649.39.5.825. [DOI] [PubMed] [Google Scholar]
- Diamond A, Towle C, Boyer K. Young children’s performance on a task sensitive to the memory functions of the medial temporal lobe in adults: The delayed nonmatching-to-sample task reveals problems that are due to non-memory-related task demands. Behavioral Neuroscience. 1994;108:659–680. doi: 10.1037//0735-7044.108.4.659. [DOI] [PubMed] [Google Scholar]
- Fagan JF., III. Infants’ delayed recognition memory and forgetting. Journal of Experimental Child Psychology. 1973;16:424–450. doi: 10.1016/0022-0965(73)90005-2. [DOI] [PubMed] [Google Scholar]
- Fredrickson WT, Gould PP, Gunderson VM, Grant-Webster KS. Complex learning by low-birth-weight and normal-birth-weight juvenile pigtailed macaques (Macaca nemestrina) Developmental Psychology. 1987;23:483–489. [Google Scholar]
- Gaffan D. Scene-specific memory for objects: A model of episodic memory impairment in monkeys with fornix transection. Journal of Cognitive Neuroscience. 1994;6:305–320. doi: 10.1162/jocn.1994.6.4.305. [DOI] [PubMed] [Google Scholar]
- Gaffan D, Shields C, Harrison S. Delayed matching by fornix-transected monkeys: The sample, the push and the bait. The Quarterly Journal of Experimental Psychology. 1984;36B:305–317. doi: 10.1080/14640748408402210. [DOI] [PubMed] [Google Scholar]
- Goldman-Rakic P. Development of cortical circuitry and cognitive function. Child Development. 1987;58:601–622. [PubMed] [Google Scholar]
- Gunderson VM, Grant-Webster KS, Fagan JF. Visual recognition memory in high- and low-risk infant pigtailed macaques (Macaca nemestrina) Developmental Psychology. 1987;23:671–675. [Google Scholar]
- Gunderson VM, Swartz KB. Visual recognition in infant pigtailed macaques after a 24-hour delay. American Journal of Primatology. 1985;8:259–264. doi: 10.1002/ajp.1350080309. [DOI] [PubMed] [Google Scholar]
- Harlow HF. The formation of learning sets. Psychological Review. 1949;56:51–65. doi: 10.1037/h0062474. [DOI] [PubMed] [Google Scholar]
- Harlow HF. Analysis of discrimination learning by monkeys. Journal of Experimental Psychology. 1950;40:26–39. [Google Scholar]
- Harlow HF, Bromer JA. A test apparatus for monkeys. Psychological Record. 1938;2:434–436. [Google Scholar]
- Harlow HF, Harlow MK, Rueping RR, Mason RR. Performance of infant rhesus monkeys on discrimination learning, delayed response, and discrimination learning set. Journal of Comparative and Physiological Psychology. 1960;53:113–121. doi: 10.1037/h0049272. [DOI] [PubMed] [Google Scholar]
- Harlow HF, Hicks LH. Discrimination learning theory: Uniprocess vs. duoprocess. Psychological Bulletin. 1957;64:104–109. doi: 10.1037/h0040181. [DOI] [PubMed] [Google Scholar]
- Kendler TS, Kendler HH. An ontogeny of optimal shift behavior. Child Development. 1970;41:1–27. [Google Scholar]
- Levinson B, Reese HW. Patterns of discrimination learning set in preschool children, 5th graders, college freshmen, and the aged. Monographs of the Society for Research in Child Development. 1967;32(7) Serial No. 115. [PubMed] [Google Scholar]
- Luciana M, Nelson CA. The functional emergence of prefrontally-guided working memory systems in four- to eight-year-old children. Neuropsychologia. 1998;36:273–293. doi: 10.1016/s0028-3932(97)00109-7. [DOI] [PubMed] [Google Scholar]
- Luciana M, Nelson CA. Assessment of neuropsychological function through use of the Cambridge Neuropsychological Testing Automated Battery: Performance in 4- to 12-year-old children. Developmental Neuropsychology. 2002;22:595–624. doi: 10.1207/S15326942DN2203_3. [DOI] [PubMed] [Google Scholar]
- Malkova L, Bachevalier J, Webster M, Mishkin M. Effects of neonatal inferior prefrontal and medial temporal lesions on learning the rule for delayed nonmatching to sample. Developmental Neuropsychology. 2001;18:399–421. doi: 10.1207/S1532694207Malkova. [DOI] [PubMed] [Google Scholar]
- Mandell DJ, Sackett GP. A computer touch screen system and training procedure for use with primate infants: Results from pigtail monkeys (Macaca nemestrina) Developmental Psychobiology. 2008;50:160–170. doi: 10.1002/dev.20251. [DOI] [PubMed] [Google Scholar]
- Medin DL. Role of reinforcement in discrimination learning set in monkeys. Psychological Bulletin. 1972;77:305–318. [Google Scholar]
- Overman WH. Performance on tradiational matching to sample, nonmatching to sample, and object discrimination tasks by 12-month-old to 32-month-old children: A developmental progression. Annals of the New York Academy of Sciences. 1990;608:365–393. doi: 10.1111/j.1749-6632.1990.tb48903.x. [DOI] [PubMed] [Google Scholar]
- Overman WH, Bachevalier J, Schuhmann E, Ryan P. Cognitive gender differences in very young children parallel biological based cognitive gender differences in monkeys. Behavioral Neuroscience. 1996;110:673–694. doi: 10.1037//0735-7044.110.4.673. [DOI] [PubMed] [Google Scholar]
- Roberts AC. Comparison of cognitive function in human and non-human primates. Cognitive Brain Research. 1996;3:319–327. doi: 10.1016/0926-6410(96)00017-1. [DOI] [PubMed] [Google Scholar]
- Rolls ET. The orbitofrontal cortex and reward. Cerebral Cortex. 2000;10:284–294. doi: 10.1093/cercor/10.3.284. [DOI] [PubMed] [Google Scholar]
- Rumbaugh DM, Richardson WK, Washburn DA, Savage-Rumbaugh ES, Hopkins WD. Rhesus monkeys (Macaca mulatta), video tasks, and implications for stimulus-response spatial contiguity. Journal of Comparative Psychology. 1989;103:32–38. doi: 10.1037/0735-7036.103.1.32. [DOI] [PubMed] [Google Scholar]
- Ruppenthal G, Sackett GP. Research Protocol and Technician’s Manual: A Guide to the Care, Feeding and Evaluation of Infant Monkey’s. Infant Primate Research Laboratory; Seattle, WA: 1992. [Google Scholar]
- Schultz W, Dickinson A. Neuronal coding of prediction errors. Annual Review of Neuroscience. 2000;23:473–500. doi: 10.1146/annurev.neuro.23.1.473. [DOI] [PubMed] [Google Scholar]
- Smiley SS, Weir MW. The role of dimensional dominance in reversal and nonreversal shift behavior. Journal of Experimental Child Psychology. 1966;4:221–216. [Google Scholar]
- Sterritt GM, Goodenough E, Harlow HF. Learning set development: Trials to criterion vs. six trials per problem. Psychological Reports. 1963;13:267–271. [Google Scholar]
- Squire LR, Zola-Morgan S, Chen KS. Human amnesia and animal models of amnesia: Performance of amnesic patients on tests designed for the monkey. Behavioral Neuroscience. 1988;102:210–221. doi: 10.1037//0735-7044.102.2.210. [DOI] [PubMed] [Google Scholar]
- Thorpe SJ, Rolls ET, Maddison S. Neuronal activity in the obitofrontal cortex of the behaving monkey. Experimental Brain Research. 1983;49:93–115. doi: 10.1007/BF00235545. [DOI] [PubMed] [Google Scholar]
- Wilson FAW, Rolls ET. The primate amygdala and reinforcement: A dissociation between rule-based and associatively-mediated memory revealed in neuronal activity. Neuroscience. 2005;133:1061–1072. doi: 10.1016/j.neuroscience.2005.03.022. [DOI] [PubMed] [Google Scholar]