Abstract
Comparisons of chromosome X and the autosomes can illuminate differences in the histories of males and females as well as the forces of natural selection. We compared the patterns of variation in these parts of the genome using two data sets that we assembled for this study that are both genomic in scale. Three independent analyses show that around the time of the dispersal of modern humans out of Africa, chromosome X experienced much more genetic drift than is expected from the pattern on the autosomes. This is not predicted by known episodes of demographic history, and we found no similar patterns associated with the dispersals into East Asia and Europe. We conclude that a gender-biased process that reduced the female effective population size, or an episode of natural selection unusually affecting chromosome X, was associated with the founding of non-African populations.
In a population with equal numbers of females and males there are three copies of chromosome X for every four autosomes. A consequence is that in a population of constant size in the absence of natural selection, the average time since the most recent common genetic ancestor (tMRCA) of two unrelated individuals should be ¾ on chromosome X of what it is on the autosomes, and allele frequency change on the autosomes should occur at ¾ the rate of chromosome X. Population genetic studies in small data sets have found deviations from these expectations. For example, one study1 found that the ratio of chromosome X-to-autosome diversity in non-African human populations was reduced below ¾, while a later study observed an increased ratio in both African and non-African populations2. Genomic-scale human variation data sets offer the possibility of more precise estimates3,4, and have generally found more allele frequency differentiation on chromosome X between populations3-6. However, these observations have been difficult to interpret in terms of history or selection because the frequency distributions on chromosome X and the autosomes were biased by the different ways in which single nucleotide polymorphisms (SNPs) were selected from these two parts of the genome (“ascertainment bias”)3,7,8.
We compared patterns of variation on chromosome X and the autosomes using two uniformly collected, genome-scale data sets that we originally assembled for the autosomes8 and now extend to chromosome X. Both data sets are several orders of magnitude larger than previous data sets that have been available for comparing these two parts of the genome, allowing qualitatively new insights into history. The first data set consists of about 130,000 SNPs that were discovered as differences between two chromosomes of either West African, North European or East Asian ancestry, and then were genotyped in more samples of all three ancestries8. Most of these data were mined from subsets of the International Haplotype Map (HapMap) using a strategy that produces allele frequency distributions that are indistinguishable from what is obtained by discovering SNPs in two chromosomes of known ancestry8. We supplemented this with an additional 1,087 SNPs that we discovered between two West African copies of chromosome X and genotyped in our laboratory. The second data set consists of over a billion base pairs of DNA that we compared between West Africans, North Europeans and East Asians to estimate sequence diversity within and between populations. Both data sets exclude exons and conserved non-coding sequences, since we were interested in learning about features of human variation that are not due to known effects of natural selection. These two data sets provide complementary information about history. Allele frequency data is fundamentally population-based, while sequence diversity data reflects the history of individual DNA sequences (the time that has elapsed since they shared a common ancestor; tMRCA). To illustrate the different information conveyed by these two types of data, allele frequency differences between two populations are affected only by the history after the populations split, while sequence diversity within and between these populations is also affected by the history of the ancestral population.
For our first line of analysis, we used the uniformly collected SNP data and allele frequency differentiation measurements (FST) to estimate the amount of genetic drift that occurred between pairs of populations since they split. By analyzing SNPs discovered between two chromosomes from population A, it is possible to estimate the genetic drift that has occurred between population A and a second population B, in a way that is unbiased by the history of expansions and contractions in B (Methods; Supp. Note). The only requirement for this theory to work is that population A has been effectively of constant size since the split from B, a requirement that is approximately satisfied in the context of our analysis (Supp. Note). To verify these theoretical predictions, we carried out simulations of scenarios of population expansion and contraction (including scenarios of gene flow) that fit the allele frequencies in all three populations8, and found that the simulated autosome-to-X genetic drift ratio is consistent with the expected ¾ (Methods; Supp. Note). By applying this theory to our data, we estimated that the autosome-to-X genetic drift ratio between North Europeans and East Asians is consistent with the expected ¾ (Table 1; P∼0.5). However, it is significantly reduced between North Europeans and West Africans (0.582±0.030; P=3.0×10⁻⁸), and between East Asians and West Africans (0.615±0.030; P=6.5×10⁻⁶) (Table 1), a reduction that is also significant when we compared with simulations of realistic demographic histories8 (Supp. Note). These results point to a period of accelerated drift on chromosome X that largely occurred after the split of West Africans and non-Africans, but before the separation of North Europeans and East Asians.
Table 1. Frequency differentiation between Africans and non-Africans is higher on chromosome X than is expected from the autosomes.
| Autosomes | Chromosome X | Comparison of autosomes and chromosome X | ||||
|---|---|---|---|---|---|---|
| (SNPs ascertained in bold population) | SNPs | FST | SNPs | FST | Observed autosome-to-X genetic drift ratio Q | P-value for observed versus expected ¾ |
|
North European
– East Asian |
62,830 | 0.106 (.002) | 2,668 | 0.133 (.006) | 0.771 (.036) | 0.57 |
|
East Asian
– North European |
45,423 | 0.098 (.002) | 1,247 | 0.131 (.009) | 0.715 (.050) | 0.48 |
|
West African
– East Asian |
13,606 | 0.178 (.003) | 1,087 | 0.256 (.010) | 0.615 (.030) | 6.5×10⁻⁶ |
|
West African
– North European |
13,606 | 0.144 (.003) | 1,087 | 0.221 (.009) | 0.582 (.030) | 3.0×10⁻⁸ |
Notes: Analyses are based on SNPs ascertained in two chromosomes of individuals from the ancestry indicated in bold. With this ascertainment strategy, estimates the ratio of autosome-to-X genetic drift. This estimate is independent of the demographic history of the population not used to ascertain SNPs, so that unlike the sequence diversity ratio (Table 2), we do not need to carry out modeling of demographic history to determine the autosome-to-X expected relationship. For the comparisons involving West Africans, the autosome-to-X genetic drift ratio is significantly below the expected ¾ (standard errors are based on 1,000 moving block bootstraps and account for linkage disequilibrium between SNPs; Supp. Methods).
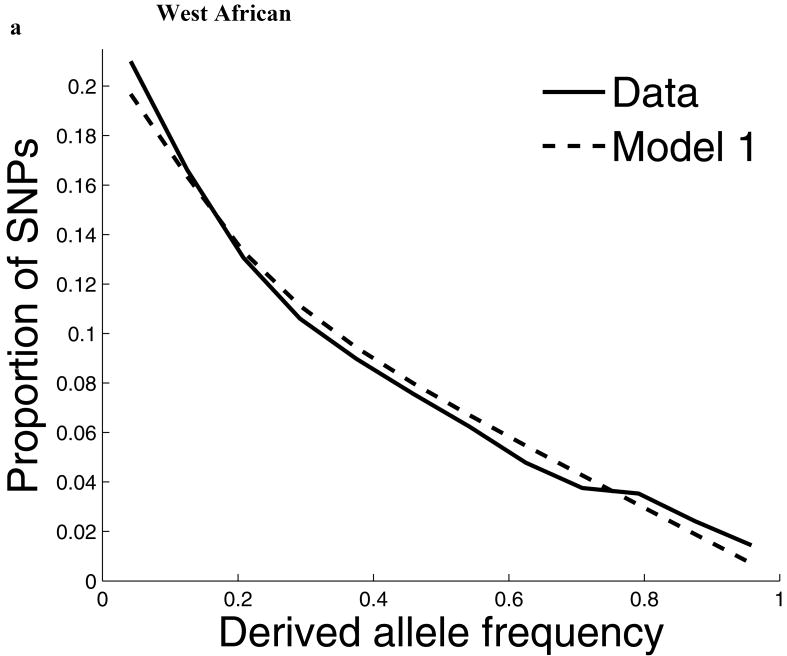
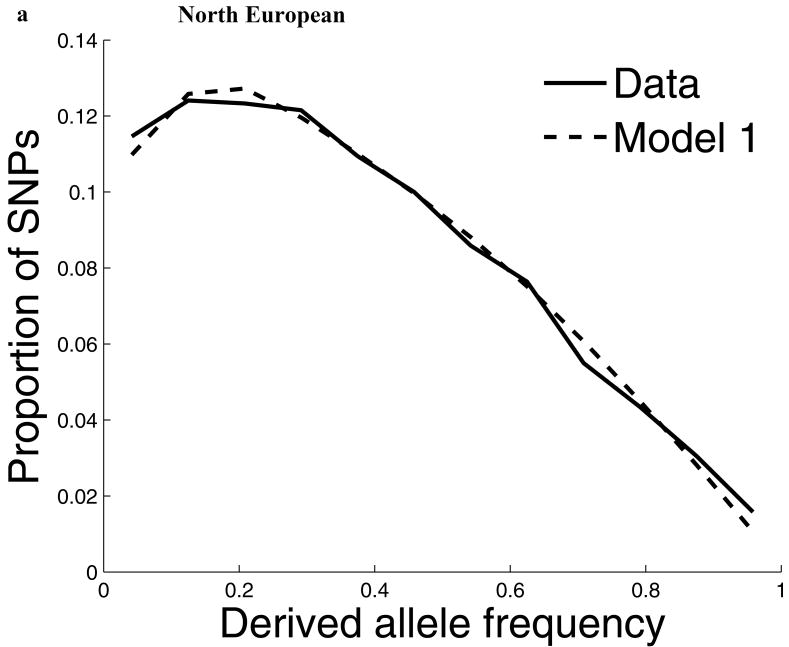
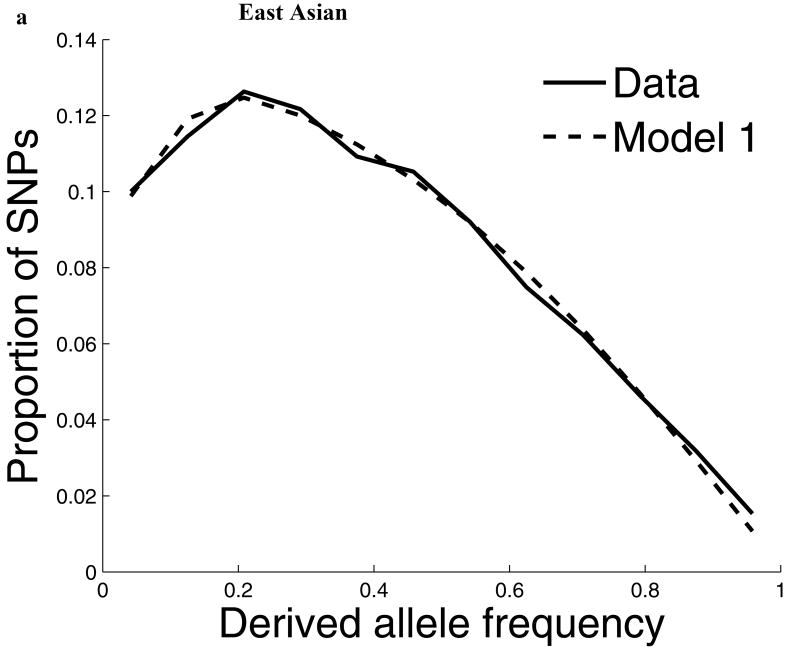
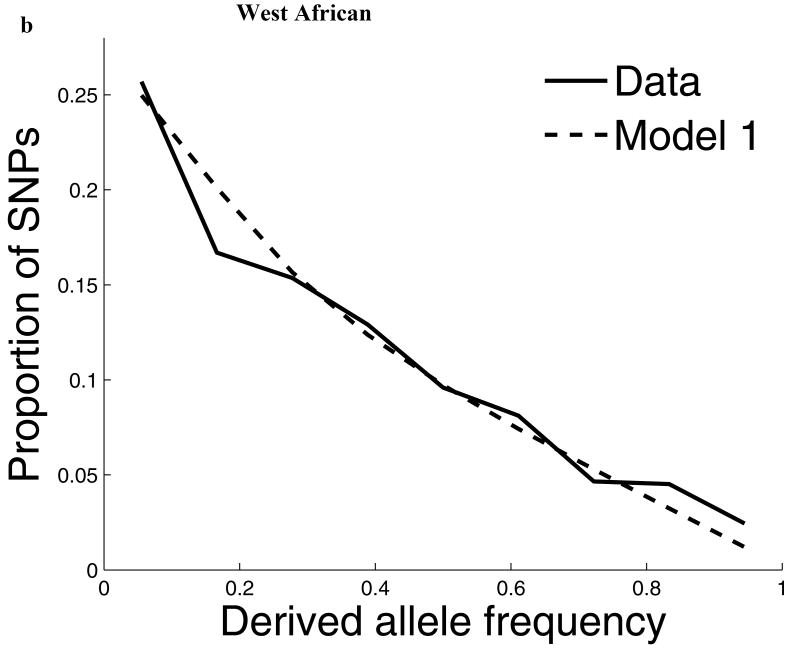
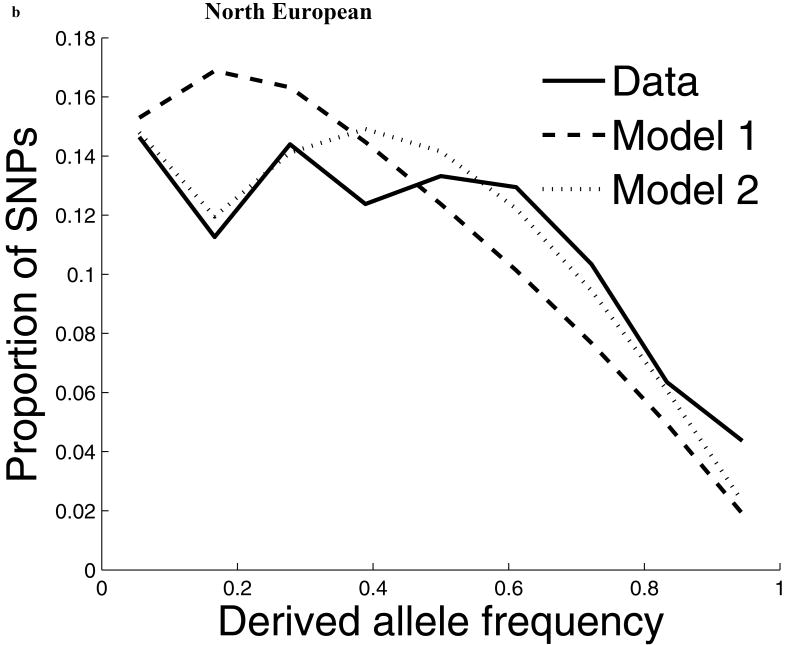
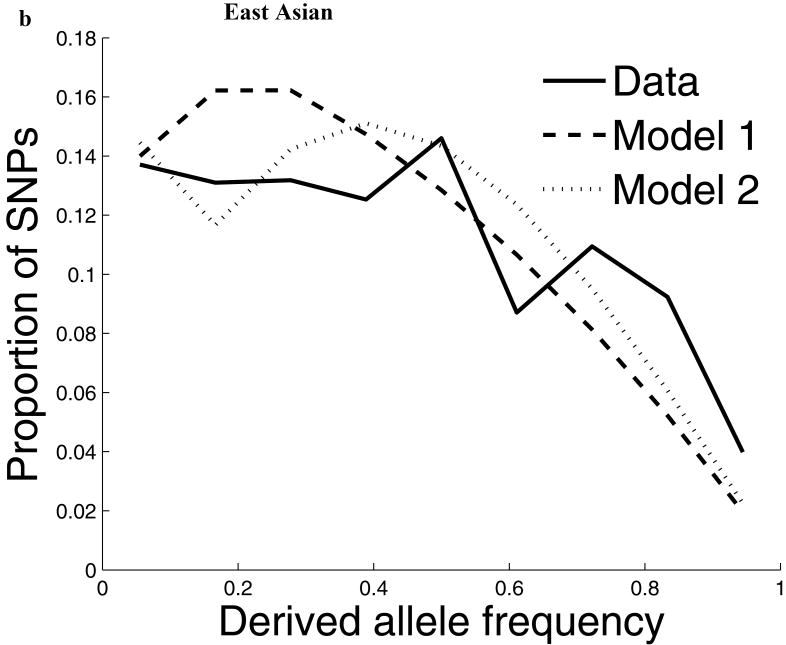
For our second line of analysis, we focused on SNP allele frequency distributions within populations (no longer comparing across populations). The shape of the chromosome X allele frequency distribution differs significantly from that on the autosomes, particularly for the non-African populations (P<10-11; Supp. Figure 1; Supp. Note). To examine whether known features of demographic history can account for these differences9,10, we examined models of history that we previously showed provided a good fit to autosomal data8. While these models fit the West African data after adjusting by a ¾ ratio of X-to-autosome population size (Figure 1), the fit is poor for the North European and East Asian populations, with both populations harboring more high frequency derived alleles on chromosome X than expected (Figure 1). To formally test for stronger chromosome X drift in these populations, we separately fit a model of a population bottleneck to the autosomes and chromosome X allele frequencies and found evidence for a much more intense bottleneck on chromosome X than is expected based on adjusting for a ¾ difference in population size (P≪10-12 for North Europeans and P=6×10⁻⁴ for East Asians; Figure 1; Supp. Table 1; Supp. Note). These results provide independent support for an acceleration in the rate of genetic drift on chromosome X since the separation of African and non-African populations, and also show that the pattern is observed independently of any data from African populations. Putting the two lines of evidence together we conclude that the accelerated genetic drift on chromosome X occurred in the ancestral population of non-Africans, after the split from West Africans.
Figure 1.
The distribution of allele frequencies on chromosome X does not match the expectation from the autosomes in non-African populations. (a) Distribution of derived allele frequencies on the autosomes compared with the expectation for our best fit models of history8, for SNPs discovered in two chromosomes of an ancestry and then genotyped in a larger number of samples of the same ancestry from HapMap. Derived allele refers to the new mutation, which we infer by requiring that both chimpanzee and orangutan match the other allele. (b) Analogous plots for chromosome X compare the observed data to the expectation from the autosomal best fit models after rescaling all effective population sizes by ¾ (‘Model 1’). While the fit of the model to the chromosome X data is excellent for West Africans, the fit of the models is poor in North Europeans and East Asians, both of which exhibit more high derived allele frequencies than expected from the models. ‘Model 2’ separately fits the out-of-Africa bottleneck on chromosome X, resulting in a more intense bottleneck than is expected from the autosomes even after adjusting for the ¾ expected difference in population size (Supp. Note). The fit to the observed data is greatly improved in Model 2 compared to Model 1, with mean squared errors reduced by 79% for North Europeans and 34% for East Asians. (The panels in this figure use different scales reflecting the numbers of sampled chromosomes used in each analysis; modeling adjusts for the differences in sample size.8)
For our third line of analysis, we examined the sequence diversity data from both chromosome X and the autosomes by counting the number of differences per base pair between two unrelated DNA sequences and then translating to estimates of time (tMRCA) by normalizing by an outgroup (human-macaque divergence) to adjust for differences in mutation rates between these two parts of the genome. (The tMRCA of human and macaque is expected to be slightly less for chromosome X due to ancestral polymorphism, which upwardly biases our estimate of the X-to-autosome tMRCA ratio and is conservative for our analyses.) The ratio of the tMRCA between chromosome X and the autosomes in West Africans is consistent with the expected ¾: 0.763±0.026, but it is reduced below ¾ in non-African populations: 0.635±0.024 in North Europeans and 0.613±0.026 in East Asians (Table 2; Supp. Note; Supp. Table 2). We assessed whether this reduction of the ratio can be explained by known features of human history including the out-of-Africa bottleneck that occurred during this period11. While the demographic models8 predict reductions below ¾ (0.702±0.004 for North Europeans and 0.690±0.004 for East Asians) the observed ratios are significantly below these values (P=0.005 for North Europeans, P=0.003 for East Asians; Table 2). The reduction is significant for several models of history we considered, further supporting the hypothesis of accelerated chromosome X drift, and showing that it occurred in non-African history after the split from Africans (Supp. Note).
Table 2. Ratio of sequence diversity on chromosome X to the autosomes is reduced outside Africa.
| Autosomes | Chromosome X | Comparison of autosomes and chromosome X | |||||
|---|---|---|---|---|---|---|---|
| Aligned bases (millions) | Divergent sites/base pair (×10-3) | Aligned bases (millions) | Divergent sites/base pair (×10-3) | Observed X-to-autosome ratio normalized by macaque divergence | Expected X-to-autosome ratio from best fit demographic model | P-value for difference between observed and expected | |
| West African | 641.7 | 1.081 (.005) | 22.0 | 0.722 (.017) | 0.763 (.026) | 0.780 (.001) | 0.514 |
| North European | 657.2 | 0.827 (.004) | 34.6 | 0.460 (.013) | 0.635 (.024) | 0.702 (.004) | 0.005 |
| East Asian | 296.8 | 0.772 (.005) | 23.5 | 0.414 (.014) | 0.613 (.026) | 0.690 (.004) | 0.003 |
Notes: We aligned sequence from unrelated individuals from each population to calculate genetic diversity per base pair (Methods and Supp. Table 4). Standard errors are obtained by a jackknife method to account for correlated diversity in neighboring regions of the genome (Methods). The X-to-autosome ratio is obtained by dividing the chromosome X diversity column by the autosome diversity column, normalizing each by human-macaque divergence in the same section of the genome, and combining all standard errors appropriately (Supp. Methods). We also compared the observed data to the expectation from the best-fit autosomal demographic model8 (Supp. Note; standard errors reflect uncertainty in model fitting). Tests for significance use a two-sided z-test between the observed and expected value.
We have used three independent lines of evidence to show that there was a period of intense chromosome X drift in the history of non-Africans, during which the effective population size on chromosome X was transiently reduced below the expected ¾ of the autosomes. This process seems to have largely occurred after the ancestors of West Africans split from the ancestors of non-Africans, but before the divergence of North Europeans and East Asians. We found no similar acceleration of chromosome X drift associated with other major human migrations to new environments: the autosome-to-X drift ratio comparing North Europeans and East Asians (Table 1), and Chinese and Japanese (Supp. Note), are both consistent with ¾.
Deviations in the X-to-autosome ratio from ¾ have been documented in several species, especially in Drosophila where natural selection is usually hypothesized to be the explanation12-14 since recessive alleles on chromosome X are exposed in hemizygous males15,16, although demographic processes have also been explored14,17. In humans, the dispersal out of Africa was a period when humans were moving to new environments, and thus is a time when selective pressures could have changed18.
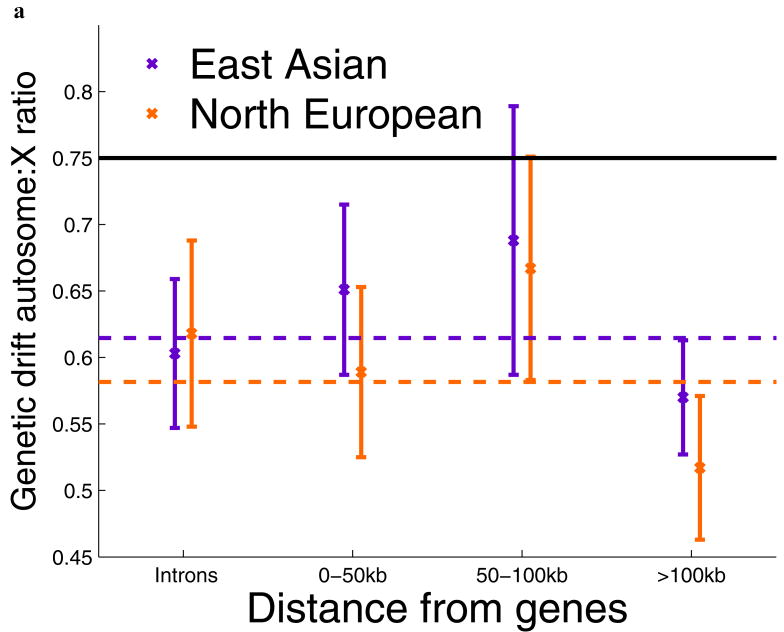
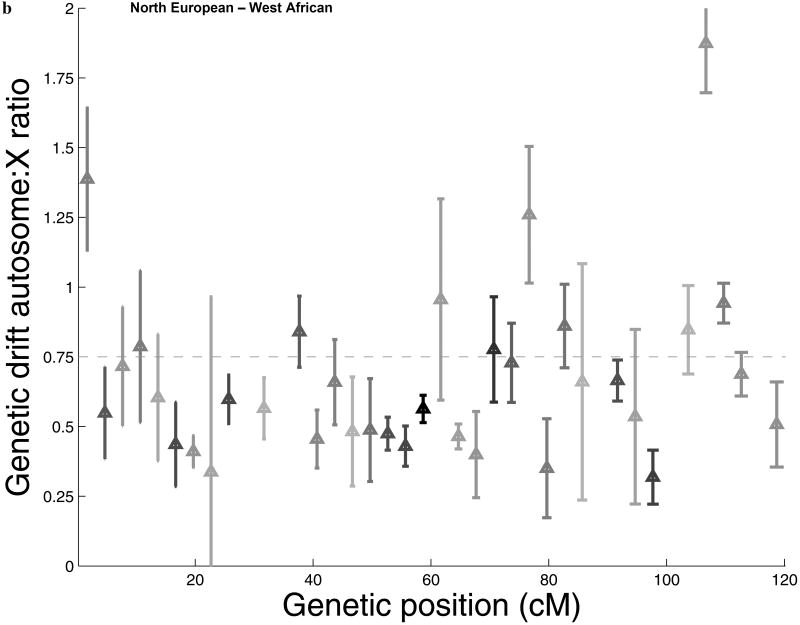
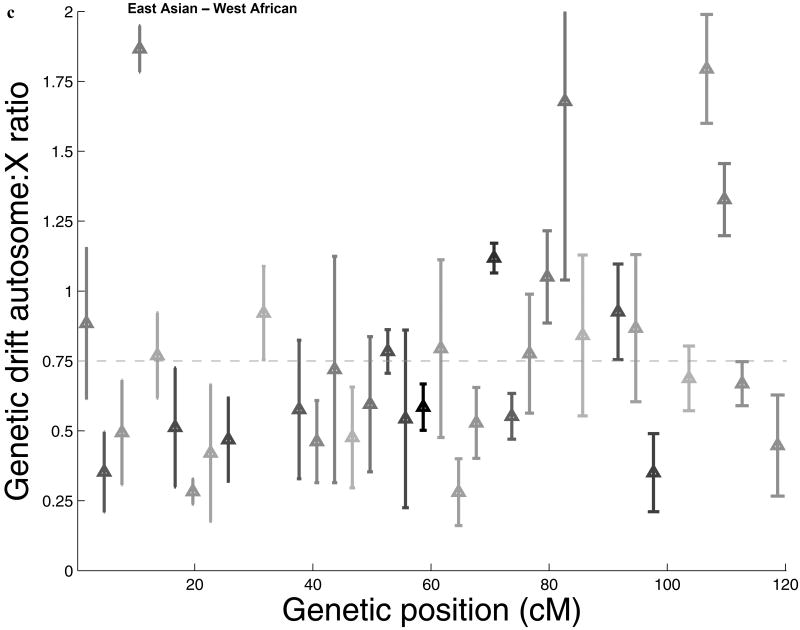
To search for additional features of the data that could shed light on natural selection, we carried out three analyses. First, we marked all the SNPs by their distance from genes, but found no attenuation of the signal with increased distance (Figure 2a; Supp. Figure 2), indicating that selection affecting a large proportion of chromosome X genes is unlikely to explain our results. However, our results could potentially still be explained by intense selection that acted over a larger distance scale than we could measure (Figure 2a; Supp. Note). Second, we studied the physical distribution of accelerated drift across chromosome X, and found that it is widespread across the chromosome (Figure 2b,c), ruling out the possibility that selection was focused on just a few loci. Third, we found no evidence that the difference between chromosome X and the autosomes is explained by selection on mutations that newly arose after the split of Africans and non-Africans, since this would be expected to produce characteristic effects on the allele frequency distributions and diversity data in North Europeans and East Asians that we do not observe (Supp. Note). We conclude that if selection explains our results, it is likely to have been on pre-existing alleles across chromosome X (“standing variation”) that were nearly neutral in the ancestral environment and only came under intense selection after the split of non-Africans from West Africans. While this is an extreme scenario (and we see no similar signal associated with other major human dispersals into new environments such as North Europe and East Asia), we cannot rule out this possibility.
Figure 2.
Gene-centric natural selection, or natural selection localized to specific regions of chromosome X, fail to explain the signal of accelerated genetic drift. (a) Dividing the chromosome X and autosome data sets based on distance from the nearest gene, we find no evidence that the ratio of autosome-to-X genetic drift Q between West Africans and East Asians and between West Africans and North Europeans increases with distance, as would be expected if selection explains our results. In particular, the bin furthest from genes (>100kb) is significantly below the expectation of ¾ (horizontal black line; error bars indicate ±1 standard error). Dotted lines show the values for all data for comparison to the individual bins. A related plot for the sequence diversity data also shows no significant effect of distance from genes (Supp. Figure 2). (b,c) The ratio of autosome-to-X genetic drift Q between West Africans and (b) North Europeans (c) East Asians, presented spatially across chromosome X. For each of 40 bins 3 cM in size on chromosome X, Q is presented as the reciprocal of the ratio of genetic drift in that bin to the average across the autosomes. A triangle's gray level indicates the number of SNPs in the bin, which is between 15 and 60 (bins with fewer than 15 SNPs are excluded from the figure). Error bars indicate one standard error below and above Q, which we obtain by a jackknife over 5 windows of 0.6 cM. The reduction of Q below the expectation of ¾ (horizontal line) has a complex pattern. However, it is widely distributed across chromosome X rather than being localized to a few regions. This rules out the possibility that the signal of accelerated drift on chromosome X can be explained by selection at a small number of loci.
Gender-biased demographic processes provide an alternative class of explanations for the observed skew from an autosome-to-X genetic drift ratio of ¾, since men carry only half the number of X chromosomes as women. Gender-biased migration is particularly plausible: anthropological studies of hunter gatherers have shown that female migration usually dominates at short distances19,20, and male migration at longer distances19,21, and gender-biased migration is also documented in modern populations22-25. Our observations could be explained if after the ancestral population of non-Africans was established, it received long-range male migration from an African source (either quickly or over thousands of years), which retarded drift twice as effectively on the autosomes as on chromosome X. Another gender-biased demographic process that could contribute to our observations is if women had a much shorter generation time than men, which would reduce the effective population size on chromosome X relative to the autosomes. Our observations also rule out variability in reproductive success as sufficient to explain our observations26,27. While polygyny (males having multiple female mates) is a gender-biased process that has been observed in some human populations2, it would predict a rise in the ratio above ¾, which is opposite to what we observe. The alternative of a tiny fraction of women having almost all the offspring during the out-of-Africa dispersal could in principle explain our observations26,27, but is inconsistent with the pattern seen in human populations including hunter-gatherers21, and is implausible considering the large investment females place in childbirth and child rearing. Our observations could also be consistent with other gender-biased demographic processes, and future work should explore these scenarios.
We have shown that there was a period of accelerated genetic drift on chromosome X associated with the human dispersal out of Africa, which was qualitatively different from what occurred during the subsequent human dispersals into Northern Europe and East Asia. Our results are also methodologically interesting. Chromosome Y and mitochondrial DNA (mtDNA) are usually analyzed to study gender-biased demographic events. However, these loci provide limited resolution about ancient demographic processes. For example, few independent non-African lineages stretch back all the way to the time of the out-of-Africa dispersal, and estimates of gender-biased demographies at that time therefore have large errors. By contrast, chromosome X and the autosomes encompass thousands of independent genetic loci, each of which probes more ancient times than the mtDNA and the Y chromosome. By averaging measurements over these loci, it is possible to obtain high resolution measurements of gender-biased processes, revealing previously undocumented events in history.
Methods
SNP data mined from HapMap
For analyses of allele frequency differentiation across populations and allele frequency distributions, we used subsets of SNPs from HapMap (Public Release #21a) which were ascertained uniformly across the genome so that the data sets are appropriate for population genetic analysis8. All the SNPs in our study are therefore uniformly ascertained as divergent sites in exactly two chromosomes of the same ancestry (two each of either West African, North European or East Asian ancestry) and genotyped in all HapMap samples, including 120 unrelated West African chromosomes from Ibadan, Nigeria (YRI), 120 unrelated European American chromosomes from Utah, USA (of North European ancestry; CEU), and 180 unrelated East Asian chromosomes (90 Han Chinese from Beijing, China (CHB) and 90 Japanese from Tokyo, Japan (JPT), which we pooled for most analyses). Since males carry a single copy of chromosome X, the counts for chromosome X are at most 90, 90, and 135 (our modeling adjusts appropriately for the sample size of every SNP used in our analysis8). We removed all sites that were in hypermutable CpG dinucleotides, and determined the ancestral allele by requiring a match to both the chimpanzee and orangutan sequence8. In addition to expanding the data from ref. 8 to chromosome X (Supp. Table 3), we made two improvements. First, we no longer required SNP discovery in two chromosomes from the same individualfsf; instead, we allow SNPs to be discovered by comparing two chromosomes, one from each of two individuals of the same ancestry, which we found generates an indistinguishable frequency distribution. Second, for the autosomal SNPs discovered in West Africans, we used data from an African American sample (NA17109) who we determined had 4% European ancestry on average based on the ANCESTRYMAP software28. We restricted the SNPs used for analysis to sections of this individual's genome where we were >95% confident of African ancestry in both chromosomes based on an analysis with ANCESTRYMAP. In Supp. Note, we present analyses showing that this procedure generates results that are indistinguishable from what is obtained by using two chromosomes from a West African.
Genotyping of SNPs in our laboratory
As the African American sample (NA17109) used for mining SNPs in HapMap was male, we could not use this individual to identify sites that were different between two West African copies of chromosome X. To fill this gap, we used four West African (YRI) samples (NA18517, NA18507, NA19240 and NA19129) for which shotgun sequencing data was available in public databases to discover SNPs. We randomly dropped sequencing reads until we had no more than two unrelated chromosomes at each site, and then used ssahaSNP29 to identify 4,884 SNPs on chromosome X for which we could confidently identify the ancestral allele based on comparison to both chimpanzee and orangutan, for which we were able to successfully design primers, and which passed all the other filters we applied to the SNPs mined from HapMap. We attempted to genotype a randomly chosen subset of 1,366 of these SNPs in all HapMap samples using the Sequenom iPLEX method30. This resulted in 1,087 SNPs after removing SNPs with <85% genotyping completeness, with 4 or more heterozygous genotypes in males, out of Hardy-Weinberg equilibrium (P<0.01 in a statistic combined across populations), or monomorphic. From the 210 unrelated samples in HapMap, we filtered to 189 after dropping samples that had <85% genotyping completeness, an excess of heterozygous genotypes in males or a deficiency of heterozygous genotypes in females compared with others from the same population, or that were one of 6 YRI samples related to those used in SNP discovery. This left us with 77 YRI, 82 CEU and 122 CHB+JPT X chromosomes for analysis.
Sequence diversity data
We obtained DNA sequence reads from public databases for 5 individuals of North European ancestry (European Americans), 4 of East Asian ancestry (from China, Japan and the United States), and 5 of West African ancestry (4 Nigerians and 1 African American, whose genome was only analyzed in sections where we were >95% confident of two African-origin chromosomes based on the ANCESTRYMAP software28) (Supp. Table 4). To identify divergent sites using these sequence reads, we aligned them to Build 35 of the human reference sequence by ssahaSNP29 with the settings Qsnp>=40, Qneighbor>=15, Nneighbor=5, maxNeighborhoodDiffs=1, maxSNPs/kb=15. A subset of non-overlapping sequence reads for each individual was selected at random, providing a single mosaic, haploid genome that was not biased according to the strand of DNA from which a read derived. Within-population sequence diversity was estimated by only analyzing bases where there were two or more individual haploid genomes, and then counting differences by selecting two haploid genomes at random. To similarly compute between-population diversity (Supp. Table 2), the individual haploid genomes of each population were combined so that at any base only one individual was represented. To estimate standard errors correcting for correlation between neighboring sites, we used a jackknife analysis, dividing the genome into blocks of 100,000 aligned bases, and removing each block in turn.8
Allele frequency differentiation analysis
To estimate allele frequency differentiation across populations, we used the FST statistic as formulated in ref. 8. Briefly, when (i) a SNP is discovered as polymorphic in population A, and (ii) population A has been of effectively constant size since the split from population B, the expected value of FST is , where τA and τ B are scaled drift times. Multiplying τi by 4/3, the equivalent expression for chromosome X is , thus . To test this expectation, we simulated models of history for each pair of populations and found all values to be close to ¾ (Supp. Note).
Supplementary Material
Acknowledgments
We thank C. Aquadro, O. Bar-Yosef, M. Bernstein, B. Charlesworth, A. Helgason, E. Lander, D. Lieberman, K. Lohmueller, S. Myers, S. Pääbo, A. Price, S. Schaffner and C. Stringer for comments, and J. Neubauer and A. Waliszewska for genotyping 1,087 SNPs discovered in two West African X chromosomes. The orangutan sequence reads were generated by the Washington University genome sequencing center (ftp.ncbi.nih.gov/pub/TraceDB/pongo_pygmaeus_abelii); we thank R. Wilson for permission to use these data. J.C.M. was supported by the Intramural Research Program of the NHGRI, N.P. by a K-01 career transition award from the NIH, and D.R. by a Burroughs Wellcome Career Development Award in the Biomedical Sciences. A.K., N.P. and D.R. were also supported by NIH grant U01 HG004168.
Footnotes
Author Contributions: A.K. and D.R. designed the study; J.C.M. and A.K. assembled data sets; D.R, A.K. and J.C.M. conducted genotyping; A.K., J.C.M. and D.R. performed analyses; N.P. provided guidance on statistical analyses.; A.K. and D.R. interpreted results and wrote the manuscript, which was edited by all co-authors.
URLs: The SNP data sets are available from our website (http://genepath.med.harvard.edu/∼reich).
References
- 1.Hammer MF, et al. Heterogeneous patterns of variation among multiple human x-linked Loci: the possible role of diversity-reducing selection in non-Africans. Genetics. 2004;167:1841–53. doi: 10.1534/genetics.103.025361. [DOI] [PMC free article] [PubMed] [Google Scholar]
- 2.Hammer MF, Mendez FL, Cox MP, Woerner AE, Wall JD. Sex-biased evolutionary forces shape genomic patterns of human diversity. PLoS Genet. 2008;4:e1000202. doi: 10.1371/journal.pgen.1000202. [DOI] [PMC free article] [PubMed] [Google Scholar]
- 3.The International HapMap Consortium. A second generation human haplotype map of over 3.1 million SNPs. Nature. 2007;449:851–861. doi: 10.1038/nature06258. [DOI] [PMC free article] [PubMed] [Google Scholar]
- 4.Li JZ, et al. Worldwide human relationships inferred from genome-wide patterns of variation. Science. 2008;319:1100–4. doi: 10.1126/science.1153717. [DOI] [PubMed] [Google Scholar]
- 5.Akey JM, Zhang G, Zhang K, Jin L, Shriver MD. Interrogating a high-density SNP map for signatures of natural selection. Genome Res. 2002;12:1805–14. doi: 10.1101/gr.631202. [DOI] [PMC free article] [PubMed] [Google Scholar]
- 6.Voight BF, Kudaravalli S, Wen X, Pritchard JK. A map of recent positive selection in the human genome. PLoS Biol. 2006;4:e72. doi: 10.1371/journal.pbio.0040072. [DOI] [PMC free article] [PubMed] [Google Scholar]
- 7.Clark AG, Hubisz MJ, Bustamante CD, Williamson SH, Nielsen R. Ascertainment bias in studies of human genome-wide polymorphism. Genome Res. 2005;15:1496–502. doi: 10.1101/gr.4107905. [DOI] [PMC free article] [PubMed] [Google Scholar]
- 8.Keinan A, Mullikin JC, Patterson N, Reich D. Measurement of the human allele frequency spectrum demonstrates greater genetic drift in East Asians than in Europeans. Nat Genet. 2007;39:1251–5. doi: 10.1038/ng2116. [DOI] [PMC free article] [PubMed] [Google Scholar]
- 9.Fay JC, Wu CI. A human population bottleneck can account for the discordance between patterns of mitochondrial versus nuclear DNA variation. Mol Biol Evol. 1999;16:1003–5. doi: 10.1093/oxfordjournals.molbev.a026175. [DOI] [PubMed] [Google Scholar]
- 10.Garrigan D, Hammer MF. Reconstructing human origins in the genomic era. Nat Rev Genet. 2006;7:669–80. doi: 10.1038/nrg1941. [DOI] [PubMed] [Google Scholar]
- 11.Pool JE, Nielsen R. Population size changes reshape genomic patterns of diversity. Evolution Int J Org Evolution. 2007;61:3001–6. doi: 10.1111/j.1558-5646.2007.00238.x. [DOI] [PMC free article] [PubMed] [Google Scholar]
- 12.Andolfatto P. Contrasting patterns of X-linked and autosomal nucleotide variation in Drosophila melanogaster and Drosophila simulans. Mol Biol Evol. 2001;18:279–90. doi: 10.1093/oxfordjournals.molbev.a003804. [DOI] [PubMed] [Google Scholar]
- 13.Betancourt AJ, Kim Y, Orr HA. A pseudohitchhiking model of X vs. autosomal diversity. Genetics. 2004;168:2261–9. doi: 10.1534/genetics.104.030999. [DOI] [PMC free article] [PubMed] [Google Scholar]
- 14.Wall JD, Andolfatto P, Przeworski M. Testing models of selection and demography in Drosophila simulans. Genetics. 2002;162:203–16. doi: 10.1093/genetics/162.1.203. [DOI] [PMC free article] [PubMed] [Google Scholar]
- 15.Charlesworth B, Coyne JA, Barton NH. The relative rates of evolution of sex chromosomes and autosomes. The American Naturalist. 1987;130:113–146. [Google Scholar]
- 16.Charlesworth B, Morgan MT, Charlesworth D. The effect of deleterious mutations on neutral molecular variation. Genetics. 1993;134:1289–303. doi: 10.1093/genetics/134.4.1289. [DOI] [PMC free article] [PubMed] [Google Scholar]
- 17.Haddrill PR, Thornton KR, Charlesworth B, Andolfatto P. Multilocus patterns of nucleotide variability and the demographic and selection history of Drosophila melanogaster populations. Genome Res. 2005;15:790–9. doi: 10.1101/gr.3541005. [DOI] [PMC free article] [PubMed] [Google Scholar]
- 18.Storz JF, Payseur BA, Nachman MW. Genome scans of DNA variability in humans reveal evidence for selective sweeps outside of Africa. Mol Biol Evol. 2004;21:1800–11. doi: 10.1093/molbev/msh192. [DOI] [PubMed] [Google Scholar]
- 19.Kayser M, et al. Reduced Y-chromosome, but not mitochondrial DNA, diversity in human populations from West New Guinea. Am J Hum Genet. 2003;72:281–302. doi: 10.1086/346065. [DOI] [PMC free article] [PubMed] [Google Scholar]
- 20.Seielstad MT, Minch E, Cavalli-Sforza LL. Genetic evidence for a higher female migration rate in humans. Nat Genet. 1998;20:278–80. doi: 10.1038/3088. [DOI] [PubMed] [Google Scholar]
- 21.Marlowe FW. Hunter-gatherers and human evolution. Evolutionary Anthropology. 2005;14:54–67. [Google Scholar]
- 22.Bedoya G, et al. Admixture dynamics in Hispanics: a shift in the nuclear genetic ancestry of a South American population isolate. Proc Natl Acad Sci U S A. 2006;103:7234–9. doi: 10.1073/pnas.0508716103. [DOI] [PMC free article] [PubMed] [Google Scholar]
- 23.Hammer MF, et al. Hierarchical patterns of global human Y-chromosome diversity. Mol Biol Evol. 2001;18:1189–203. doi: 10.1093/oxfordjournals.molbev.a003906. [DOI] [PubMed] [Google Scholar]
- 24.Helgason A, et al. Estimating Scandinavian and Gaelic ancestry in the male settlers of Iceland. Am J Hum Genet. 2000;67:697–717. doi: 10.1086/303046. [DOI] [PMC free article] [PubMed] [Google Scholar]
- 25.Parra EJ, et al. Estimating African American admixture proportions by use of population-specific alleles. Am J Hum Genet. 1998;63:1839–51. doi: 10.1086/302148. [DOI] [PMC free article] [PubMed] [Google Scholar]
- 26.Caballero A. On the effective size of populations with separate sexes, with particular reference to sex-linked genes. Genetics. 1995;139:1007–11. doi: 10.1093/genetics/139.2.1007. [DOI] [PMC free article] [PubMed] [Google Scholar]
- 27.Charlesworth B. The effect of life-history and mode of inheritance on neutral genetic variability. Genet Res. 2001;77:153–66. doi: 10.1017/s0016672301004979. [DOI] [PubMed] [Google Scholar]
- 28.Patterson N, et al. Methods for high-density admixture mapping of disease genes. Am J Hum Genet. 2004;74:979–1000. doi: 10.1086/420871. [DOI] [PMC free article] [PubMed] [Google Scholar]
- 29.Ning Z, Cox AJ, Mullikin JC. SSAHA: a fast search method for large DNA databases. Genome Res. 2001;11:1725–9. doi: 10.1101/gr.194201. [DOI] [PMC free article] [PubMed] [Google Scholar]
- 30.Tang K, et al. Chip-based genotyping by mass spectrometry. Proc Natl Acad Sci U S A. 1999;96:10016–20. doi: 10.1073/pnas.96.18.10016. [DOI] [PMC free article] [PubMed] [Google Scholar]
Associated Data
This section collects any data citations, data availability statements, or supplementary materials included in this article.


