Abstract
Spasticity, contracture and muscle weakness often occur together poststroke and cause considerable motor impairments to stroke survivors. The underlying changes in contractile properties of muscle fascicles are still not clear. The purpose of this study was to investigate the contractile property changes of the medial gastrocnemius muscle fascicles poststroke. Ten stroke survivors and ten healthy subjects participated in the study. The medial gastrocnemius fascicular length was measured at various combinations of ankle and knee positions using ultrasonography, with the muscle activated selectively using electrical stimulation. The stimulation intensity was kept constant across different ankle and knee positions to establish the active force-length relationship of the muscle fascicles. It was found that stroke survivors showed a shift of the force-length curve with a significantly shorter optimal fascicle length (33.2 ± 3.2 mm) compared with that of healthy controls (47.4 ± 2.7 mm) with P < 0.001. Furthermore, the width span of the fascicular force-length curve of stroke survivors was significantly narrower with steeper slopes than that of controls (P ≤ 0.001), suggesting reduced number of sarcomeres along the fascicles and/or reduced sarcomere length poststroke. Regression analysis showed that the medial gastrocnemius fascicular length of stroke survivors varied significantly less with ankle and knee flexions (P ≤ 0.001) than that of controls, suggesting shorter and stiffer muscle fascicles poststroke, which might be attributed to muscle architectural adaptation. This study showed that there are considerable changes in the contractile properties of muscle fascicles poststroke, which may contribute directly to the joint-level changes of decreased range of motion, increased stiffness, muscle weakness, and impaired motor functions in stroke survivors.
Keywords: stroke, ultrasound, muscle fascicle, force length, spasticity, gastrocnemius
stroke survivors often develop spasticity, contractures, and muscle weakness, which severely affect their daily activities (33). Clinically, the ankle is often affected post stroke, with ∼60% of stroke survivors discharged from in-patient rehabilitation requiring an ankle orthosis and ∼34% of stroke survivors developing ankle contracture (38, 39, 47). The impaired ankle dorsiflexion poststroke makes it hard for the foot to clear the ground in the early swing phase during locomotion, and the associated lack of ankle plantar flexion results in reduced forward propulsion (47, 52). Although poststroke biomechanical changes at ankle have been investigated in a number of studies, there is a lack of evaluation on the changes of contractile properties of muscle fascicles.
Ultrasonography has been used in recent studies to investigate muscle/tendon functions in vivo and noninvasively (10, 11, 16, 18, 21, 24, 26, 29, 32, 40, 41, 48). However, only few ultrasonic studies have been conducted to examine spastic muscles in patients poststroke (20, 36) or children with cerebral palsy (5, 28, 31, 44). Most of the studies focused on changes in muscle architecture under passive condition and did not evaluate the contractile properties of muscle fascicles. Some studies have been done to establish the force-length relation of individual muscles of healthy subjects (4, 20, 22, 23, 26). Maganaris (26) investigated the medial gastrocnemius (MG) muscle force-length relationship during maximal voluntary contraction on healthy subjects, with the MG force derived assuming a constant load sharing among the triceps surae muscles across the test conditions and different subjects. There has been a lack of knowledge on contractile properties of paretic muscle fascicles of patients with neurological disorders.
The purpose of this study was to evaluate the contractile properties of the MG muscle fascicles, including the active force-length relation poststroke. Considering that it is difficult for patients poststroke to perform maximum voluntary contractions reliably, the muscles were activated at submaximal levels. It was hypothesized that spasticity, contracture, and muscle weakness at the ankle poststroke were associated with significant changes in the force-length relation of the MG muscle fascicles in terms of its shift, operating range, and dependence on ankle and knee positions.
METHODS
Subjects
Ten male stroke survivors (age, 56.8 ± 6.8 yr; body mass, 85.4 ± 16.0 kg; height, 177.6 ± 5.2 cm; stroke history of 88.0 ± 52.6 mo with the right side impaired) and ten male healthy subjects (age, 45.1 ± 17.7 yr; body mass, 73.8 ± 12.7 kg; height, 175.0 ± 5.2 cm) without any neurological disorder participated in the study. The modified Ashworth score (2) at the ankle of the stroke survivors in this study was 2.6 ± 0.6. All subjects gave informed consent before participating in the study.
Experimental Procedure
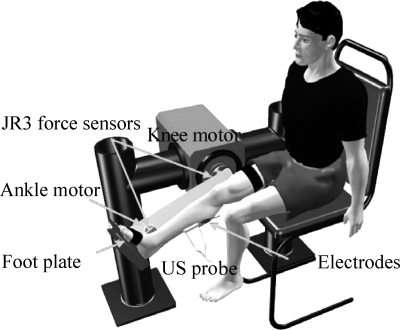
An adjustable leg-foot linkage with six-axis force/torque sensors (JR3, Woodland, CA) mounted at both the knee and ankle joints was used to constrain the shank and foot (Fig. 1). The knee and ankle joint axes were aligned with the Z-axis (normal to the mounting surface of the sensor) of the corresponding JR3 sensors. Only the flexion moment at each joint was used in this study. The knee and ankle positions were adjusted systematically throughout the ranges of motion during the experiment.
Fig. 1.
Experimental setup. Medial gastrocnemius muscle fascicular images were measured using the ultrasound (US) probe together with the ankle and knee positions and torques at various ankle and knee joint positions.
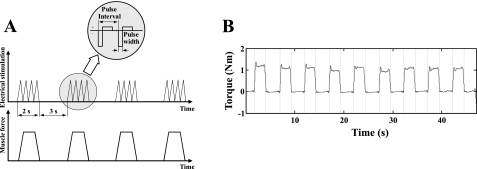
For both groups bipolar stimulation was applied at the motor point to activate the MG muscle selectively, with the motor point determined as the most sensitive location to induce strong contraction by palpating the tendon or by checking the amplitude of the induced torque (36, 54). A Compex electrical stimulator was used to generate trains of electrical pulses with pulse width of 300 μs and frequency of 40 Hz. There parameters were selected in such a way that subjects did not feel much discomfort. and a clearly detectable and steady contraction torque could be reached (peak torques ranging from 0.48 ± 0.31 to 0.70 ± 0.38 N·m and from 0.40 ± 0.07 to 0.83 ± 0.31 N·m for control and stroke, respectively). Notice that different from the maximum activation of the calf muscles using very large surface electrodes as reported by Sale et al. (41), relatively low level of stimulation delivered through small electrodes was used in this study to reach selective activation of the MG muscle. Still, similar torque-angle relationships were observed across the different levels of activations. The pattern of the torque-angle relationship obtained in this study was consistent with those obtained under higher levels of activation, as reported in the literature (30, 42). The duration of each electrical pulse train was 2 s, and the interval between the pulse trains was 3 s to minimize fatigue (Fig. 2). The stimulation amplitude was adjusted for each individual subject to achieve a proper level of ankle plantar flexion torque, strong enough for reliable measurement and tolerated by the subject. The targeted MG muscle was activated selectively to a steady level of contraction during each of the 2-s stimulation.
Fig. 2.
A: Electrical stimulation was used to activate the medial gastrocnemius muscle selectively across the various ankle and knee positions. Top: schematics of the trains of electrical pulses applied to the muscle. Bottom: force produced by the activated muscle. B: example of the measured ankle plantar flexion torque induced by electrical stimulation of the medial gastrocnemius muscle.
The subject was seated upright on a custom chair with the thigh secured using Velcro straps. Four knee positions, starting from full extension with an increment of 30° flexion, were tested. At each knee flexion, the ankle flexion was systematically varied between 20° dorsiflexion and 45° plantar flexion, with an increment of 10° in dorsiflexion and 15° in plantar flexion. Because stroke survivors had reduced ankle range of motion, the tested ankle positions for stroke survivors might be smaller than the range described above and were adjusted individually if needed. The extreme ankle positions that could be reached for the stroke survivors were 43 ± 6.1 ° in plantar flexion and 9.9 ± 8.0 ° in dorsiflexion.
Ultrasound images were collected using a B-mode ultrasound scanner with 12 MHz high-resolution linear array probe (M12L matrix probe, GE LOGIQ-9). Working in the LOGIQView mode, the probe was placed perpendicular to the skin and moved smoothly and distally along the middle line of the MG. During the movement, the probe was kept perpendicular to the skin under moderate pressure to maintain proper contact between the probe and skin without deforming the muscle significantly.
Each stimulation trial lasted 50 s, and there were about 10 stimulation-induced contractions per trial. Longitudinal scan of the MG using LOGIQView was conducted as the muscle reached a steady level of contraction. Out of the 10 stimulation-induced contractions in each trial, 3 ultrasound scans were performed randomly along the same paths and the averaged values were used in further analysis.
Data Analysis
Joint torque signal processing.
The torque signals were digitally filtered with a fourth-order Butterworth low-pass filter (5-Hz cutoff frequency). Torque change from immediately before the contraction to the average of the middle 75% of the steady contraction window were taken as the torque induced by the stimulation. Notice that although the stimulation intensity was kept constant, the induced torque might still fluctuate due to variations such as changes in the baseline torque and in the muscle response to the stimulation. Outliers of the peak torque signal defined as those out of the 75 percentile were excluded from further analysis (36, 54).
Ultrasound images analysis.
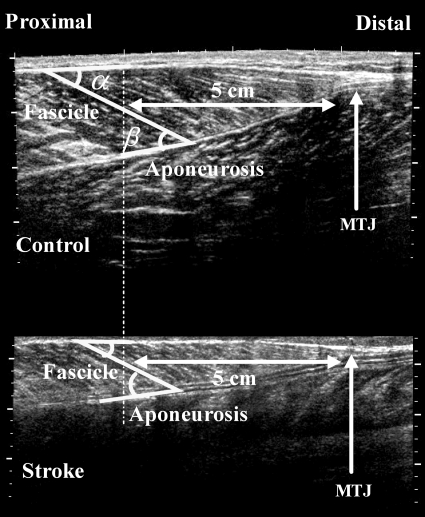
Ultrasound images were saved as image files and analyzed in MATLAB (The MathWorks, Natick, MA). As shown in Fig. 3, connective tissues surrounding the muscles and fascicles were echogenic. The posterior and anterior muscle aponeuroses met each other to form the musculotendon junction. The fascicle length has been shown to be fairly consistent with small variations along the length of the muscle in different regions (27). In the present study, the length of fascicles at a single location (5 cm proximal to the musculotendon junction) was measured (Fig. 3) (19). The posterior and anterior pennation angles were measured as the angle between the fascicle and the posterior and anterior aponeuroses, respectively.
Fig. 3.
Representative ultraound image of the medial gastrocnemius muscle under contraction induced by electrical stimulation (from both a healthy control subject and a stoke survivor). Muscle fascicle length was measured at 5 cm proximal to the musculotendon junction (MTJ). Pennation angles were measured at the fascicular insertion at both deep and superficial aponeuroses, namely, the anterior pennation α and the posterior pennation angle β, respectively.
Active force-length relationship.
The MG fascicular force F was determined across various ankle and knee positions as follows:
 |
(1) |
where τ is the ankle joint torque generated by selective activation of the MG muscle, MA is the moment arm determined using SIMM (MusculoGraphics, Santa Rosa, CA), and α is the anterior pennation angle. For each subject, the force F was normalized to its peak value across the various fascicle lengths obtained at the various ankle and knee positions.
The relation between the normalized fascicular force (F) and the corresponding fascicle length (L) measured through ultrasonography was established by curve-fitting the scattered data points for each subject with the model proposed by Kaufman et al. (Eq. 2 in Ref. 17, ω was a parameter that controls width), after evaluating a number of models for the force-length relation (3, 35, 50).
 |
(2) |
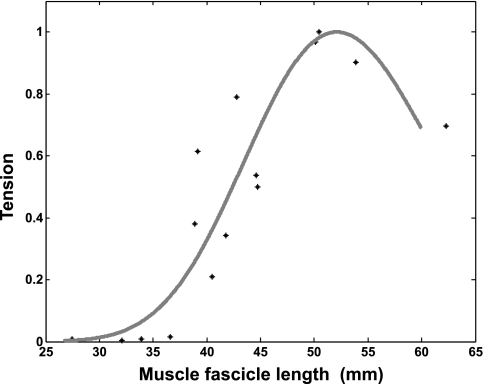
For both groups, the peak of the fitted force-length curve and the corresponding optimal fascicle length were determined from the model. The shape of the fitted curve was characterized by the spanning width and slope. The spanning width was measured at specified tension levels, over the range corresponding to 70–90% peak force with an increment of 10% (Fig. 4). In addition, slopes were also determined at specified tension levels ranging from 70 to 90% peak force for both the ascending and descending limbs (Fig. 4). Group average was calculated across the tension levels ranging from 70 to 90%.
Fig. 4.
Representative curve fitting of the active force-length relationship using the model in Eq. 2. Force was normalized to the peak force generated across the different fascicle lengths. Data are from a healthy subject with an optical fascicle length of 52 mm.
Multilinear regression was calculated with the knee (θknee) and ankle (θankle) positions as the independent variables and the muscle fascicle length (lmf) as the dependent variable for individual subjects:
 |
(3) |
where a, b, and c represented the coefficients for the ankle angle, knee angle, and offset, respectively.
Statistical Analysis
ANOVA with repeated measures was performed on the dependent variables with the knee and ankle joint positions as the factors. Student's t-test was used for comparison of the dependent variables between the stroke and control groups. The dependent variables include the optimal fascicle length of the force-length curve, the spanning width and slope of the force-length curve at a specified tension, the muscle fascicle length, and the coefficients of the multilinear regression. Statistical significance was set as P < 0.05. All statistics was done in SPSS (SPSS, Chicago, IL).
RESULTS
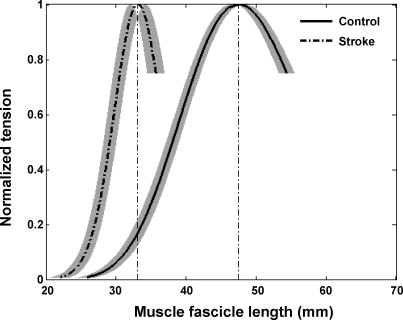
Compared with healthy controls, stroke survivors showed a left-shifted force-length curve with significantly shorter optimal fascicle length (Fig. 5; P ≤ 0.001), suggesting reduced number of sarcomeres along the fascicles. The optimal fascicle length was 47.4 ± 2.7 and 33.2 ± 3.2 mm (mean ± SD) for the normal controls and the stroke survivors, respectively (Fig. 5).
Fig. 5.
Active-force-length relationship of the stroke and control groups (mean ± SE). For each subject, the force was normalized to the peak force generated across the different fascicle lengths. For each group, the mean is shown with the SE in fascicle length represented by the shaded area.
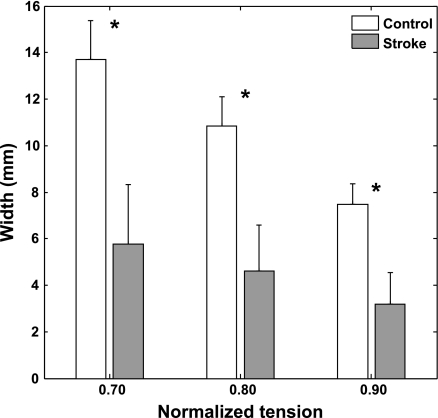
Compared with healthy controls, stroke survivors showed a significantly narrower spanning width of the active force-length relationship across the different levels of normalized tension (P ≤ 0.001). With the bell-shaped pattern, the spanning width decreases with the increment of the normalized tension. Compared with healthy control, stroke survivors had a more gradual decrease of the spanning width with increasing normalized tension (Fig. 6; P ≤ 0.001), reflecting the smaller fascicle length change.
Fig. 6.
Mean fascicle spanning width at 3 tension levels for the stroke and control groups (group mean and SD). *Differences in spanning width between the 2 groups were significant (P ≤0.001).
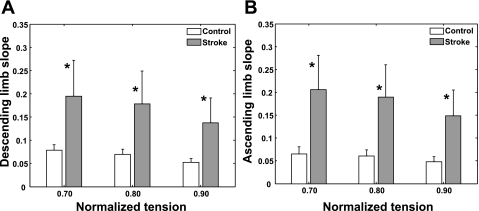
Across various tension levels of the force-length curve, stroke survivors showed significantly steeper slopes for both the ascending and descending limbs compared with their counterparts of the control group (P ≤ 0.005; Fig. 7), indicating faster rate of tension change with the fascicle length change and reduced number of sarcomeres along the fascicles.
Fig. 7.
Slopes (absolute values) of the ascending (A) and descending (B) limbs of the force-length relationship (mean and SD). *Slope differences between the 2 groups were significant (P ≤0.005).
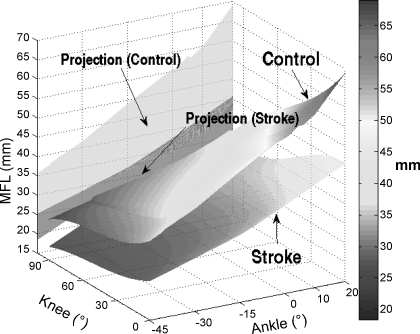
At comparable joint positions, stroke survivors showed shorter muscle fascicle lengths compared with healthy controls (Fig. 8). For instance, with the knee at full extension and ankle at 0° dorsiflexion, stroke survivors showed significantly shorter muscle fascicle length (37.7 ± 4.2 mm) than that of the healthy controls (55.6 ± 8.2 mm; P < 0.001). Across the ankle and knee positions, the muscle fascicle length ranged from 25.4 ± 3.7 to 68 ± 5.7 mm and from 18.4 ± 6.8 to 45.4 ± 6.4 mm for the healthy controls and stroke survivors, respectively (Fig. 8). However, the surface plot was generated based on extrapolated data, and one should be cautious interpreting the data points beyond the physical range.
Fig. 8.
Three-dimensional surface plot of the mean muscle fascicle length (MFL) of the stroke and control groups as a function of the ankle and knee flexion angles. Projections to plane of MFL as a function of the ankle position are also shown for the 2 groups.
The coefficients of multilinear regression in Eq. 3 showed altered dependence of the muscle fascicle length on the ankle and knee flexion positions post stroke, compared with that of healthy controls. The MG fascicle length of stroke survivors varied with ankle flexion significantly less than that of healthy control, as shown by the smaller ankle coefficient of the stroke survivors [a = 0.24 ± 0.06 (mean ± SD)] compared with that of healthy control (a = 0.37 ± 0.08), with P = 0.001. Similarly, the fascicle length of stroke survivors varied significantly less with knee flexion angle than that of the control (the knee coefficient b was −0.21 ± 0.05 and −0.07 ± 0.05 for the control and stroke groups, respectively; P < 0.001). With full knee extension and 0° dorsiflexion, the corresponding muscle fascicle length, or coefficient c (intercept of the linear regression equation), was significantly lower in stroke (37.4 ± 4.2 mm) than in control (55.6 ± 8.2 mm) with P < 0.001, indicating again reduced fascicle length post stroke.
DISCUSSION
In vivo ultrasonic and biomechanical measurements were done systematically at various ankle and knee positions, combined with constant electrical stimulation across various ankle and knee positions, to evaluate changes in MG contractile properties characterized as force-length relationship poststroke. Compared with healthy control subjects, patients poststroke showed significant changes in the active force-length relation, including shorter muscle fascicles, narrower range of fascicle length change, and steeper slopes of the MG fascicle force-length relation.
The MG fascicle length of healthy subjects in this study falls in the range of MG fascicle length reported in the literature (1, 13, 16, 18, 21, 26, 32). For instance, Arampatzis et al. (1) reported a range from 37 to 67 mm across six ankle and knee angle combinations. Compared with the previous studies, a larger range of combined ankle-knee positions were used in the present study, which resulted in a larger range of change in muscle fascicle length for healthy control, ranging from 25.4 ± 3.7 to 68 ± 5.7 mm. Although Maganaris (26) reported a significantly smaller range of fascicular length change for the MG, ranging from 24 ± 4 to 39 ± 6 mm, it was measured under maximal voluntary contraction, which could shorten the MG fascicular length by 49% and reduced from 45 ± 2.3 mm to 23.4 ± 1.9 mm (27).
In this study, the force-length relation was characterized in the range of the whole ascending limb with an extension to 70% of the peak force in the descending limb. In the literature, Cutts et al. (7) showed that the gastrocnemius muscle operated across the range of the tension-length curve with the sarcomere length ranging from 1.0 μm (at 125° knee flexion and 43° plantar flexion) to 4.4 μm (at 13° knee flexion and 18° dorsiflexion) (7). On the other hand, Maganaris (26) evaluated the force-length characteristic of the MG muscle in vivo and showed a linear instead of a bell-shaped relationship between the fascicular length and force. The linear relationship might be associated with the limited range of muscle fascicle length change involved in the study and the assumption of constant load sharing between the lateral and medial heads across different test conditions (26). Sale et al. (42) evaluated the contractile properties of the whole group of the triceps surae muscles by stimulating the gastrocnemius and soleus muscles using large surface electrodes (cathode of 20 × 15 cm over the gastrocnemius and soleus and anode of 18 × 12 cm encircling the ankle). The contraction torque and joint angle relationship crossed the whole ascending limb and part of the descending limb with the optimal angle for ankle torque production being at 15° dorsiflexion (42). In the present study, the MG muscle was activated selectively at the motor point using small surface electrodes, and the range of the force-length curve covered the operational range of the MG fascicles during functional activities.
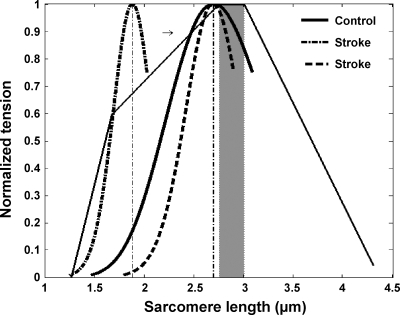
The present study showed that compared with normal controls, stroke survivors showed a shifted fascicle force-length relationship toward the shorter fascicle length, narrower span of the force-length relationship, and steeper slopes at both the ascending and descending limbs, which indicated reduced number of sarcomeres in series along the muscle fascicles. Considering that the optimal fascicle length of healthy control was 47.4 ± 2.7 mm as obtained in this study and the number of sarcomeres in series was about 17,600 for the normal human MG muscle (15), the corresponding sarcomere length was ∼2.7 μm (black thin line in Fig. 9), which was consistent with the range of optimal sarcomere length of 2.6–3 μm reported in the literature (26, 49). In contrast, assuming the same 17,600 sarcomeres in series, the corresponding sarcomere length of stroke survivors would be 1.9 μm (dashed and dash-dotted curves in Fig. 9), considerably shorter than that of healthy control. However, the assumption that the spastic muscle fascicles consist of the same number of sarcomeres in series as that in normal fibers may not hold, considering that the number of sarcomeres is highly adaptable to changes in muscle loading (14, 46, 51). Shah et al. (43) reported that a significant decrease in sarcomere number was observed in shortened soleus in rats with immobilization, ranging from 12 to 26% (43). Tabary et al. (45) reported a 40% reduction of number of sarcomeres due to immobilization at shortened muscle length. Some studies have compared the resting ankle positions between these two groups with zero-resistance torque, and stroke survivors have demonstrated a slightly plantar flexed resting ankle position compared with healthy control (Gao F, Grant TH, Roth EJ, Zhang LQ, unpublished observations). The shift of the fascicle force-length relation, including the optimal fascicle length toward the shorter length as reported in the present study indicated a reduction of the number of sarcomeres in series. Potentially, a reduction in the number of sarcomeres would bring sarcomere length back to near the optimal sarcomere length (51) and match the left-shifted fascicular force-length curve observed in stroke survivors in this study. Hypothetically, a 30% reduction in the number of sarcomeres in series would make the length of sarcomere near the optimal length (the dashed curve in Fig. 9).
Fig. 9.
Potential force-length relations at the sarcomere level. Black thick lines shows the tension-length relationship reported by Walker and Schrodt (49) with the optimal region highlighted by the shaded area. Solid and dashed-dotted curves show the operating range of the control and stroke groups, respectively, assuming the same 17,600 sarcomeres along the MG fascicles. Dashed curve represents the hypothetical curve of stroke survivors, assuming a 30% reduction of the number of sarcomeres.
The potential reduction in the number of sarcomeres in series may be tangled with sarcomere length change post stroke. A better understanding of the sarcomeric adaptation in spastic muscles poststroke has direct clinical relevance, such as in understanding the mechanisms underlying potentially increased fiber tension and stiffness in spastic muscles and in evaluating tendon lengthening operations (8). It may also provide guidance to rehabilitation treatment such as stretching a joint with spasticity/contracture, which may affect the sarcomere operating point on the force-length curve. Further studies at the muscle fiber and sarcomere levels need to be carried out to examine the relationship between the muscle architectural and biomechanical changes at the joint and fiber/sarcomere levels (53).
By using a multilinear regression, we have shown that for both stroke and control groups both knee and ankle positions affect the fascicular length of the biarticular MG muscle. The significantly smaller coefficients (in absolute value) for stroke survivors indicates that they have smaller change in muscle fascicle length than that in control, given the same amount of change of knee/ankle flexion angles. The significant smaller coefficients (in absolute value) for stroke survivors agree with the shorter fascicle length and narrow span of the force-length curve reported above and also indicate higher stiffness of the spastic muscle fascicles. This agrees with the reported increased ankle joint stiffness poststroke (6) and with the reported stiffer and shorter spastic muscle cell compared with control (9). The stiffness increase may be attributed to ultrastructural changes. For instance, in a study on the spastic muscle in spinal cord injured subjects, Olsson et al. (34) showed that increased passive tension arose not only from extracellular matrix remodeling, but also from structural and functional adaptation inside the muscle cells.
There are limitations with the present study. First, LOGIQView was good for recording relatively larger field of view but care needs to be taken to obtain the images with well-controlled linear movement. Second, the intensity of electrical stimulation depended on the skin condition and on locating the muscle motor point accurately. Skin movement across the different joint positions might affect the stimulation intensity to the muscle and change the fitted force-length curve. Third, in determining the MG muscle force, we assumed that the force was completely transmitted through tendon. However, the myofascial linkages might also affect the force transmission from muscle fascicles to bone (25). Fourth, the intensity of electrical stimulation applied on individual subjects varied from person to person to elicit plantar flexion torque within the subject's comfort limit, which might cause inconsistent contractions across the subjects. However, the muscle activation level in this study was much lower than maximal voluntary contraction with the typical peak torque at ∼0.4–0.8 N·m, which was similar across the subjects. Under the low levels of activation, the change in fascicle length from the resting length was rather small [around 1–2% assuming the maximum torque generated by MG is 50 N·m and the shortening of fascicle length is 49% under MVC (26)], and the difference in fascicle length between the two groups due to the different activation levels would be negligible. Lastly, the data and results were obtained from the MG muscle only, which may not be true for other muscles.
In summary, this study showed that there were considerable changes in muscle contractile and architectural properties poststroke, including shorter muscle fascicles, smaller range of fascicle length variation, and steeper slopes in the active force-length relation. Quantitative evaluations of the muscle contractile properties may help us gain insight into the mechanisms underlying motor impairments post stroke and other neurological disorders and develop more effective rehabilitation treatment and outcome evaluations.
GRANTS
The authors acknowledge the support of the National Institutes of Health and National Institute on Disability and Rehabilitation Research (Grants 5ROIH-0044295-04 and H133F070012).
The costs of publication of this article were defrayed in part by the payment of page charges. The article must therefore be hereby marked “advertisement” in accordance with 18 U.S.C. Section 1734 solely to indicate this fact.
REFERENCES
- 1.Arampatzis A, Karamanidis K, Stafilidis S, Morey-Klapsing G, DeMonte G, Bruggemann GP. Effect of different ankle- and knee-joint positions on gastrocnemius medialis fascicle length and EMG activity during isometric plantar flexion. J Biomech 39: 1891–1902, 2006. [DOI] [PubMed] [Google Scholar]
- 2.Bohannon RW, Smith MB. Interrater reliability of a modified Ashworth scale of muscle spasticity. Phys Ther 67: 206–207, 1987. [DOI] [PubMed] [Google Scholar]
- 3.Brown IE, Liinamaa TL, Loeb GE. Relationships between range of motion, lo, and passive force in five strap-like muscles of the feline hind limb. J Morphol 230: 69–77, 1996. [DOI] [PubMed] [Google Scholar]
- 4.Chang YW, Su FC, Wu HW, An KN. Optimum length of muscle contraction. Clin Biomech (Bristol, Avon) 14: 537–542, 1999. [DOI] [PubMed] [Google Scholar]
- 5.Cheatwood AP, Rethlefsen SA, Kay RM, Wren TAL. Changes in medial gastrocnemius architecture with spasticity and contracture. In: 52nd Annual Meeting of the Orthopaedic Research Society (May 19–22, 2006. Chicago: ORS, 2006, p. 137.
- 6.Chung SG, van Rey E, Bai Z, Roth EJ, Zhang LQ. Biomechanic changes in passive properties of hemiplegic ankles with spastic hypertonia. Arch Phys Med Rehabil 85: 1638–1646, 2004. [DOI] [PubMed] [Google Scholar]
- 7.Cutts A The range of sarcomere lengths in the muscles of the human lower limb. J Anat 160: 79–88, 1988. [PMC free article] [PubMed] [Google Scholar]
- 8.Delp SL, Statler K, Carroll NC. Preserving plantar flexion strength after surgical treatment for contracture of the triceps surae: a computer simulation study. J Orthop Res 13: 96–104, 1995. [DOI] [PubMed] [Google Scholar]
- 9.Friden J, Lieber RL. Spastic muscle cells are shorter and stiffer than normal cells. Muscle Nerve 27: 157–164, 2003. [DOI] [PubMed] [Google Scholar]
- 10.Fukunaga T, Ichinose Y, Ito M, Kawakami Y, Fukashiro S. Determination of fascicle length and pennation in a contracting human muscle in vivo. J Appl Physiol 82: 354–358, 1997. [DOI] [PubMed] [Google Scholar]
- 11.Fukunaga T, Kawakami Y, Kuno S, Funato K, Fukashiro S. Muscle architecture and function in humans. J Biomech 30: 457–463, 1997. [DOI] [PubMed] [Google Scholar]
- 13.Herbert RD, Moseley AM, Butler JE, Gandevia SC. Change in length of relaxed muscle fascicles and tendons with knee and ankle movement in humans. J Physiol 539: 637–645, 2002. [DOI] [PMC free article] [PubMed] [Google Scholar]
- 14.Herring SW, Grimm AF, Grimm BR. Regulation of sarcomere number in skeletal muscle: a comparison of hypotheses. Muscle Nerve 7: 161–173, 1984. [DOI] [PubMed] [Google Scholar]
- 15.Huijing PA Architecture of the human gastrocnemius muscle and some functional consequences. Acta Anat (Basel) 123: 101–107, 1985. [DOI] [PubMed] [Google Scholar]
- 16.Ishikawa M, Pakaslahti J, Komi PV. Medial gastrocnemius muscle behavior during human running and walking. Gait Posture 25: 380–384, 2007. [DOI] [PubMed] [Google Scholar]
- 17.Kaufman KR, An KN, Chao EY. Incorporation of muscle architecture into the muscle length-tension relationship. J Biomech 22: 943–948, 1989. [DOI] [PubMed] [Google Scholar]
- 18.Kawakami Y, Ichinose Y, Fukunaga T. Architectural and functional features of human triceps surae muscles during contraction. J Appl Physiol 85: 398–404, 1998. [DOI] [PubMed] [Google Scholar]
- 19.Kawakami Y, Kumagai K, Huijing PA, Hijakata T, Fukunaga T. The length-force characteristics of human gastrocnemius and soleus muscles in vivo. In: Skeletal Muscle Mechanics: From Mechanisms to Function, edited by Herzog W. Chichester, UK: Wiley, 2000, p. 327–341.
- 20.Li L, Tong KY, Hu X. The effect of poststroke impairments on brachialis muscle architecture as measured by ultrasound. Arch Phys Med Rehabil 88: 243–250, 2007. [DOI] [PubMed] [Google Scholar]
- 21.Lichtwark GA, Bougoulias K, Wilson AM. Muscle fascicle and series elastic element length changes along the length of the human gastrocnemius during walking and running. J Biomech 40: 157–164, 2007. [DOI] [PubMed] [Google Scholar]
- 22.Lieber RL, Bodine-Fowler SC. Skeletal muscle mechanics: implications for rehabilitation Phys Ther 73: 844–856, 1993. [DOI] [PubMed] [Google Scholar]
- 23.Lieber RL, Friden J. Functional and clinical significance of skeletal muscle architecture. Muscle Nerve 23: 1647–1666, 2000. [DOI] [PubMed] [Google Scholar]
- 24.Loram ID, Maganaris CN, Lakie M. Use of ultrasound to make noninvasive in vivo measurement of continuous changes in human muscle contractile length. J Appl Physiol 100: 1311–1323, 2006. [DOI] [PubMed] [Google Scholar]
- 25.Maas H, Baan GC, Huijing PA. Intermuscular interaction via myofascial force transmission: effects of tibialis anterior and extensor hallucis longus length on force transmission from rat extensor digitorum longus muscle. J Biomech 34: 927–940, 2001. [DOI] [PubMed] [Google Scholar]
- 26.Maganaris CN Force-length characteristics of the in vivo human gastrocnemius muscle. Clin Anat 16: 215, 2003. [DOI] [PubMed] [Google Scholar]
- 27.Maganaris CN, Baltzopoulos V, Sargeant AJ. In vivo measurements of the triceps surae complex architecture in man: implications for muscle function. J Physiol 512: 603–614, 1998. [DOI] [PMC free article] [PubMed] [Google Scholar]
- 28.Malaiya R, McNee AE, Fry NR, Eve LC, Gough M, Shortland AP. The morphology of the medial gastrocnemius in typically developing children and children with spastic hemiplegic cerebral palsy. J Electromyogr Kinesiol 17: 657–663, 007. [DOI] [PubMed] [Google Scholar]
- 29.Martin DC, Medri MK, Chow RS, Oxorn V, Leekam RN, Agur AM, McKee NH. Comparing human skeletal muscle architectural parameters of cadavers with in vivo ultrasonographic measurements. J Anat 199: 429–434, 2001. [DOI] [PMC free article] [PubMed] [Google Scholar]
- 30.McDonald MF, Kevin Garrison M, Schmit BD. Length-tension properties of ankle muscles in chronic human spinal cord injury. J Biomech 38: 2344–2353, 2005. [DOI] [PubMed] [Google Scholar]
- 31.Mohagheghi AA, Khan T, Meadows TH, Giannikas K, Baltzopoulos V, Maganaris CN. Differences in gastrocnemius muscle architecture between the paretic and non-paretic legs in children with hemiplegic cerebral palsy. Clin Biomech (Bristol, Avon) 22: 718–724, 2007. [DOI] [PubMed] [Google Scholar]
- 32.Narici MV, Binzoni T, Hiltbrand E, Fasel J, Terrier F, Cerretelli P. In vivo human gastrocnemius architecture with changing joint angle at rest and during graded isometric contraction. J Physiol 496: 287–297, 1996. [DOI] [PMC free article] [PubMed] [Google Scholar]
- 33.O'Dwyer NJ, Ada L, Neilson PD. Spasticity and muscle contracture following stroke. Brain 119: 1737–1749, 1996. [DOI] [PubMed] [Google Scholar]
- 34.Olsson MC, Kruger M, Meyer LH, Ahnlund L, Gransberg L, Linke WA, Larsson L. Fibre type-specific increase in passive muscle tension in spinal cord-injured subjects with spasticity. J Physiol 577: 339–352, 2006. [DOI] [PMC free article] [PubMed] [Google Scholar]
- 35.Otten E A myocybernetic model of the jaw system of the rat. J Neurosci Methods 21: 287–302, 1987. [DOI] [PubMed] [Google Scholar]
- 36.Peng Q, Zhang LQ. Ultrasound Evaluation of Mechanical Properties of Individual Muscles-Tendons during Active Contraction. In: Engineering in Medicine and Biology Society 2005. IEEE-EMBS 2005. 27th Annual International Conference. (Sept. 1–4, 2005) Shanghai, China: IEEE, 2005, p. 7436–7439. [DOI] [PubMed]
- 38.Pfeffer MM, Reding Stroke Rehabilitation MJ. In: Principles of Neurologic Rehabilitation, edited by Lazar RB. New York: McGraw-Hill, 1998, p. 105–119.
- 39.Redings MJ, McDowell F. . Stroke rehabilitation. Neurol Clin 5: 601–630, 1987. [PubMed] [Google Scholar]
- 40.Reeves ND, Narici MV. Behavior of human muscle fascicles during shortening and lengthening contractions in vivo. J Appl Physiol 95: 1090–1096, 2003. [DOI] [PubMed] [Google Scholar]
- 41.Rosager S, Aagaard P, Dyhre-Poulsen P, Neergaard K, Kjaer M, Magnusson SP. Load-displacement properties of the human triceps surae aponeurosis and tendon in runners and non-runners. Scand J Med Sci Sports 12: 90–98, 2002. [DOI] [PubMed] [Google Scholar]
- 42.Sale D, Quinlan J, Marsh E, McComas AJ, Belanger AY. Influence of joint position on ankle plantarflexion in humans. J Appl Physiol 52: 1636–1642, 1982. [DOI] [PubMed] [Google Scholar]
- 43.Shah SB, Peters D, Jordan KA, Milner DJ, Friden J, Capetanaki Y, Lieber RL. Sarcomere number regulation maintained after immobilization in desmin-null mouse skeletal muscle. J Exp Biol 204: 1703–1710, 2001. [DOI] [PubMed] [Google Scholar]
- 44.Shortland AP, Harris CA, Gough M, Robinson RO. Architecture of the medial gastrocnemius in children with spastic diplegia. Dev Med Child Neurol 43: 796–801, 2001. [DOI] [PubMed] [Google Scholar]
- 45.Tabary JC, Tabary C, Tardieu C, Tardieu G, Goldspink G. Physiological and structural changes in the cat's soleus muscle due to immobilization at different lengths by plaster casts. J Physiol 224: 231–244, 1972. [DOI] [PMC free article] [PubMed] [Google Scholar]
- 46.Tabary JC, Tardieu C, Tardieu G, Tabary C, Gagnard L. Functional adaptation of sarcomere number of normal cat muscle. J Physiol (Paris) 72: 277–291, 1976. [PubMed] [Google Scholar]
- 47.Vattanasilp W, Ada L, Crosbie J. Contribution of thixotropy, spasticity, and contracture to ankle stiffness after stroke. J Neurol Neurosurg Psychiatry 69: 34–39, 2000. [DOI] [PMC free article] [PubMed] [Google Scholar]
- 48.Wakahara T, Ushiyama J, Kanehisa H, Kawakami Y, Fukunaga T. Effects of passive ankle and knee joint motions on the length of fascicle and tendon of the medial gastrocnemius muscle. Int J Sports Health Sci 3: 75–82, 2005. [Google Scholar]
- 49.Walker SM, Schrodt GR. I segment lengths and thin filament periods in skeletal muscle fibers of the Rhesus monkey and the human. Anat Rec 178: 63–81, 1974. [DOI] [PubMed] [Google Scholar]
- 50.Whitehead NP, Weerakkody NS, Gregory JE, Morgan DL, Proske U. Changes in passive tension of muscle in humans and animals after eccentric exercise. J Physiol 533: 593–604, 2001. [DOI] [PMC free article] [PubMed] [Google Scholar]
- 51.Williams PE, Goldspink G. Changes in sarcomere length and physiological properties in immobilized muscle. J Anat 127: 459–468, 1978. [PMC free article] [PubMed] [Google Scholar]
- 52.Winter DA Biomechanics and Motor Control of Human Movement. New York: Wiley, 2004.
- 53.Wu YN, Ren Y, Zhang LQ. In vivo sarcomere length and fiber tension measurements. In: American Society of Biomechanics (Aug 5–9, 2008). Ann Arbor, MI: ASB, 2008.
- 54.Zhang LQ, Butler JP, Nishida T, Nuber GW, Huang H, Rymer WZ. In vivo determination of the direction of rotation and moment-angle relationship of individual elbow muscles. J Biomech Eng 120: 625–633, 1998. [DOI] [PubMed] [Google Scholar]


