Abstract
Lung recruitment and derecruitment contribute significantly to variations in the elastance of the respiratory system during mechanical ventilation. However, the decreases in elastance that occur with deep inflation are transient, especially in acute lung injury. Bates and Irvin (8) proposed a model of the lung that recreates time-varying changes in elastance as a result of progressive recruitment and derecruitment of lung units. The model is characterized by distributions of critical opening and closing pressures throughout the lung and by distributions of speeds with which the processes of opening and closing take place once the critical pressures have been achieved. In the present study, we adapted this model to represent a mechanically ventilated mouse. We fit the model to data collected in a previous study from control mice and mice in various stages of acid-induced acute lung injury (3). Excellent fits to the data were obtained when the normally distributed critical opening pressures were about 5 cmH2O above the closing pressures and when the hyperbolically distributed opening velocities were about an order of magnitude greater than the closing velocities. We also found that, compared with controls, the injured mice had markedly increased opening and closing pressures but no change in the velocities, suggesting that the key biophysical change wrought by acid injury is dysfunction of surface tension at the air-liquid interface. Our computational model of lung recruitment and derecruitment dynamics is thus capable of accurately mimicking data from mice with acute lung injury and may provide insight into the altered biophysics of the injured lung.
Keywords: lung elastance, hydrochloric acid instillation, recruitment maneuver, surface tension, mechanical ventilation
during mechanical ventilation, lung recruitment and derecruitment are known to contribute significantly to changes in the apparent stiffness of the respiratory system. Though derecruitment can be reduced by the application of positive end expiratory pressure (PEEP), there exists an intrinsic propensity for airway collapse that is exacerbated during acute lung injury (ALI). The prevailing viewpoint treats recruitment and derecruitment as static functions of pressure. However, recent experimental data demonstrate that the decreases in elastance following deep inflation are transient (1–5), suggesting that dynamic peripheral airway collapse becomes more rapid and profound as lung injury matures (3). It is also known that the lung can tolerate periodic deep inflations to recruit collapsed lung regions but that continued volleys of large breaths are injurious and significantly exacerbate the pathology (5). Clinically, physicians struggle to balance the impact of these potentially detrimental phenomena.
The present convention, driven by the results of a highly influential clinical trial (32a), is to ventilate the lung using low tidal volumes over a moderate level of PEEP. Recruitment maneuvers are occasionally delivered in a somewhat ad hoc fashion, often manually (11), the goal usually being to establish open lung conditions from which regular mechanical ventilation subsequently proceeds. The recruitment maneuvers themselves, however, have generally not been shown to be of much benefit in the management of ALI (9, 12). One of the reasons for this may be a lack of appreciation for the dynamic nature of recruitment and derecruitment. In other words, the relevant question with regard to recruitment maneuvers is not whether they should be given but how often (5). To answer this question, an understanding of the dynamics of recruitment and derecruitment in ALI is essential.
Bates and Irvin (8) have proposed a model of the lung that recreates time-varying changes in pulmonary mechanics as a result of progressive recruitment and derecruitment of lung units. This model is capable of simulating both the hysteretic pressure-volume behavior of the lung and the transient changes in lung elastance that frequently occur during an extended period of mechanical ventilation in ALI. In the present study, we adapted the model of Bates and Irvin (8) appropriate to a mechanically ventilated mouse. We fit the model to data collected from control mice and mice in various stages of acid-induced ALI. The goal of the study was twofold. First, we wanted to determine the extent to which the transient changes in lung stiffness seen during ventilation in these animals can be accurately modeled in terms of recruitment and derecruitment dynamics. Second, we wanted to see whether the way that estimated model parameters change from health to disease provides any insight into the biophysical alterations taking place in the injured lung.
MATERIALS AND METHODS
Model development.
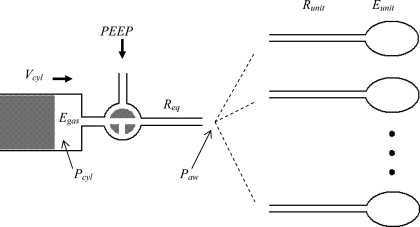
Our model of the lung consists of 1,250 parallel pathways, each having an identical airway resistance, Runit, leading into an alveolar unit having an elastance, Eunit (Fig. 1). The individual airways are either open or closed, according to a mechanism described below. The model is driven by a mechanical ventilator, with inspiration controlled by the movement of a piston and expiration determined by elastic recoil of the respiratory system against a set level of PEEP. The compressibility of the gas in the cylinder of the ventilator (Egas) and the flow resistance attributable to the ventilator tubing and tracheal cannula (Req) are also taken into account in the model.
Fig. 1.
Schematic of the computational model showing a piston ventilator pushing a volume (Vcyl) that is divided into compression of the cylinder gas [determined by cylinder pressure (Pcyl) and gas elastance (Egas)] and flow into the lung through equipment resistance (Req). The airway pressure (Paw) is applied to all parallel lung units, each having resistance (Runit) and elastance (Eunit). Positive end expiratory pressure (PEEP) is applied to the lung during expiration.
The inspiratory movement of the ventilator piston is a quarter of a sinusoid terminated at its peak. The volume output from the ventilator attributable to displacement of the piston in the cylinder, Vcyl, is divided between volume lost in gas compression within the cylinder, Vgas, and volume that proceeds into the breathing circuit. That is,
 |
(1) |
The pressure generated by compressed gas within the cylinder is given by
 |
(2) |
where we make the simplifying assumption that Egas does not change with the position of the piston in the cylinder. (This assumption ignores the fact that the volume of compressible gas changes as the piston moves. However, the volume displaced by the cylinder during measurements was less than 5% of the total volume of gas in the cylinder and connecting tubing, so the change in Egas was also less than 5%.) The pressure at the entrance to the airways of the lung itself, Paw, is equal to Pgas less the pressure drop across Req. Paw is also equal to the pressure that overcomes the total lung resistance (RL) and elastance (EL). That is,
 |
(3) |
In the present application, however, we do not have to deal with Req explicitly because it acts simply as an additive component to RL.
Inspiration terminates once the ventilator piston has reached its target displacement volume, at which point expiration begins. Paw during expiration is again the pressure balancing the resistive and elastic pressure drops across the lung, this time incremented by the level of PEEP. Thus
 |
(4) |
RL and EL are functions of time in Eqs. 3 and 4 because they are determined by the number of airways that are open (Nopen) at any point in time according to
 |
(5) |
 |
(6) |
Flow only enters those lung units that have open airways, so flow into the ith unit is given by
 |
(7) |
where α is either 1 (airway open) or 0 (airway closed). Thus, when an airway is open, it will accumulate flow in a manner governed by the local and global mechanical properties of the lung, whereas a unit that is closed will experience no changes in its volume. This allows units to become derecruited while partially inflated, which provides a mechanism for peripheral air trapping. The total flow into the lung is obtained by summing Eq. 7 over i. We also numerically checked that the summed flows from all compartments calculated using Eq. 7 equaled total flow as per Eqs. 3 and 4.
The present volume in each unit is obtained from its volume at the previous time point by
 |
(8) |
where Δt is the time step.
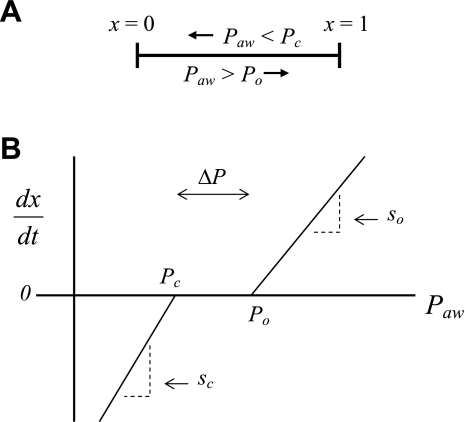
To account for the recruitment and derecruitment behavior for an individual airway, we adapted the model of Bates and Irvin (8). Airways are allowed to exist in one of two states, either fully open or fully closed, with the transition between the two states being determined by movement of a variable x along a virtual trajectory over the range 0 to 1 (Fig. 2A). An airway remains either open or closed for 0 < x < 1. If the airway is closed and x achieves a value of 1, then the airway opens. If the airway was already open, it remains so. Conversely, if an airway is open and x reaches 0, then the airway will close. Whether x moves to the right or to the left along the virtual trajectory depends on whether Paw is greater or less than a critical pressure. The critical pressure for movement toward the right-hand end of the trajectory that results in airway opening (i.e., x = 1) is Po, whereas the critical pressure for closing is Pc. The speed with which x moves along the virtual trajectory is proportional to the difference between Paw and either Po or Pc, with the constants of proportionality being so and sc, respectively (Fig. 2B). Thus x for the ith airway obeys the differential equation
 |
(9) |
Fig. 2.
A: depiction of the virtual trajectory along which x moves between the limits 0 (airway closes) and 1 (airway opens) depending on whether Paw is above or below the critical opening (Po) or closing (Pc) pressures. B: rate of change of x as a function of pressure. so and sc are the slopes of the linear relationships of dx/dt to the amounts by which Paw is above or below Po and Pc, respectively. ΔP is the dead zone within which Paw induces no movement in x.
The new value for xi at each time step is given by first-order Euler integration
 |
(10) |
In this way, recruitment and derecruitment of airways have a dynamic nature that depends on pressure history even though the transition between the open and closed states is instantaneous once x reaches a value of either 0 or 1.
The overall recruitment/derecruitment behavior of the model is set by the particular values of Po, Pc, so, and sc that are assigned to the various lung units. We chose these values randomly from the following the Gaussian probability distributions
 |
(11) |
 |
(12) |
and the hyperbolic distributions
 |
(13) |
 |
(14) |
where N(μ,σ) is the normal distribution with mean μ and standard deviation σ, unif [0,1] is the uniform distribution between 0 and 1, and So and Sc are constants that scale, respectively, the distributions of the slopes of the opening and closing velocity relationships (Fig. 2).
We investigated four variants of the above model.
Model A.
Opening and closing characteristics are identical. That is, μ = μ
= μ σ
σ = σ
= σ and So = Sc. This is the simplest model, with three free parameters.
Model B.
Rate of change of x along the virtual trajectory is different right from left. That is, μ = μ
= μ and σ
and σ = σ
= σ but So ≠ Sc. This model has four free parameters.
Model C.
Movement of x is the same in both directions, but open pressures are shifted up by a fixed amount, ΔP, relative to closing pressures. That is, μ = μPc + ΔP, σ
 = σ
= σ and So = Sc. This model also has four free parameters.
Model D.
Movement of x is different right to left, and opening pressures are shifted up relative to closing pressures. That is, μ = μ
= μ + ΔP, σ
 = σ
= σ and So ≠ Sc. This is the most general model we investigated and has five free parameters.
Experimental data.
Models A through D were fit to lung elastance data from mice with ALI obtained in a previous study from our laboratory. The experimental and ethics approval details have already been published (3), but we repeat here the salient points. The lungs of 8–10-wk-old female C57BL/6 mice were instilled, under anesthesia, with 75 μl of either sterile phosphate-buffered saline at pH of 7.4 (control) or pH 1.8 hydrochloric acid (ALI). The control and injured animals were each divided into 4 groups (n = 8 per group) that were studied at 4, 14, 24, and 48 h, respectively, after instillation. The study consisted of placing the anesthetized mice on a computer-controlled small-animal mechanical ventilator (Flexivent; Scireq, Montreal, Quebec, Canada) via an 18-gauge tracheal cannula. The mice were ventilated with a tidal volume of 0.25 ml at a rate of 180 breaths/min at three levels of PEEP (1, 3, 6 cm H2O) in random order. Two pressure-limited deep breaths (rate 30 breaths/min, maximum pressure 30 cmH2O) were administered immediately before each change in PEEP to recruit collapsed lung. Measurements of respiratory impedance were then made every 15 s for the next 8 min using the forced oscillation technique, and the constant-phase model (17) was fit to each impedance estimate. The constant-phase model of lung impedance has been described in detail in numerous previous publications (7, 15, 17). The key point about this model for the present study is that it contains a parameter (H) that accounts for the contribution the lung tissue makes to the imaginary part of total lung impedance. By following the progression of H, we thus obtain a time course for lung elastance (3, 17).
Model fitting.
The computational model described above was driven with a Vcyl(t) signal that gave a ventilatory pattern matching that used experimentally in the mice. The initial conditions for each simulation were all units closed and all x = 0. Simulations began with 30 s of regular ventilation using a tidal volume of 0.25 ml at 180 breaths/min and a PEEP of 1 cmH2O. This brought the model to a steady-state level of openness. Two deep inflations to 30 cmH2O were then given to further recruit collapsed lung, mimicking the standardization of lung volume history that was applied experimentally. This was followed by 8.5 min of regular ventilation at a set PEEP level. The entire procedure was repeated for PEEP levels of 1, 3, and then 6 cmH2O/s. The equations of the model were integrated with a time step of 0.005 s during the deep inflations and with a step of 0.01666 s during the periods of regular ventilation so that each simulated breath had the same number of points at the same times relative to the start of the breath (we checked to ensure that halving the time step made no discernible difference to the simulated data). The model values of Req and Egas were set at 0.41 cmH2O·s−1·ml−1 and 185 cmH2O/ml, respectively, to match the values measured in the experimental apparatus during its standard dynamic calibration procedure (15, 29). We assigned Runit = 2,500 cmH2O·s−1·ml−1 and Eunit = 27,500 cmH2O/ml so that RL and EL predicted by the model under control conditions matched values obtained experimentally from normal mice (3). Runit and Eunit do not correspond to any particular structures within the lung but merely allow the model to mimic the behavior of the lung.
During the periods of regular ventilation at each PEEP level, the elastance (EL) of the model was determined every 15 s (i.e., synchronized to the experimental measurements of H) by fitting Eq. 3 to the simulated values for Paw(t), VL(t), and V̇L(t) over four consecutive breaths. In particular, a larger value of EL indicates a lung that is stiffer because it has fewer open units. We thus obtained an average EL over the breaths, within which EL may change because of intratidal recruitment and derecruitment. Model simulations were performed using the Matlab software package (Mathworks, Natick, MA) running under Microsoft Windows XP on a Dell Pentium 4 desktop computer with a CPU clock speed of 3.40 GHz and 1.00 GBytes of RAM. The simulation of one experiment, consisting of ventilation during the initialization procedure plus at each PEEP level, took ∼28 s.
For each of the four model variants listed above, the time courses of E obtained from the simulated data at each PEEP level were compared with the corresponding experimental time courses of H obtained from each group of mice. The model parameters were then adjusted so as to minimize the root-mean-square error between E and H according to
 |
(15) |
where K is the number of measurements of H, θ is the vector of model parameters, and M denotes the particular model (A, B, C, or D). We searched for the minimum in ΦM using the Nelder-Mead simplex algorithm (Mathworks), terminating the search when the fractional change in ΦM at each step fell below 5 × 10⁻⁴, at which point the relative changes in the parameters were below 5 × 10⁻⁴. This was generally achieved in less than 250 iterations.
We compared the fits provided by each of the model variants A through D on the basis of the corrected Akaike Information Criterion (AICC) defined as (20)
 |
(16) |
where Lθ is the length of the parameter vector for model M. AICc is a generalized measure of model performance that rewards goodness of fit while penalizing large numbers of free parameters. The most appropriate model for a given data set is that with the minimum value of AICc (minAICc) because this model achieves the optimum balance between being able to accurately describe the data without relying on too many parameters.
The model with the minAICc for each group of mice was fit to the individual H profiles for each mouse within the group, yielding mean values and standard deviations for each model parameter. Two-way ANOVA was used to compare the parameter values between different groups of mice to test for an effect of injury vs. control and of time following acid instillation. Statistical significance was taken as P < 0.05.
Sensitivity analysis.
For the model with the minAICc in each group of mice, we determined the sensitivity (ɛi) of the quality of the model fit to each of the Lθ free model parameters (i = 1,… , Lθ). We define
 |
(17) |
as the sensitivity of the model fit to an increase in a parameter value, where Φmin is the minimum value of ΦM (Eq. 15), and  is the value of ΦM obtained by increasing the value of the ith parameter above its optimum value while keeping all other parameters at their respective optimum values (collectively represented by the parameter vector θ
 Corresponding sensitivities, ɛ
 to a decrease in each parameter were defined in terms of Φ
 and θ
and θ These sensitivity indices were determined using increases in σ
 σ
σ So, and Sc by 5% either side of their optimum values. The remaining free parameter, μ
 was often close to zero and was even negative in some cases. Consequently, perturbing its value by a given fractional amount frequently produced negligible changes in absolute terms. Accordingly, we perturbed μ
 by adding or subtracting the fixed amount of 0.25 cmH2O to determine its values of ɛ
 and ɛ
and ɛ
RESULTS
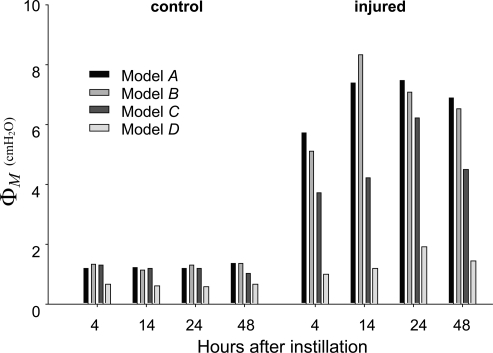
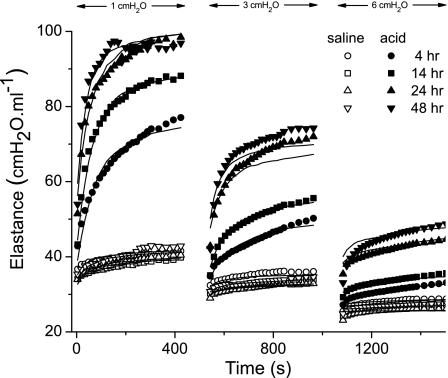
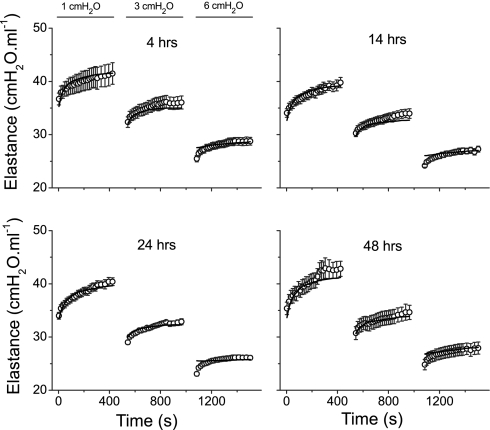
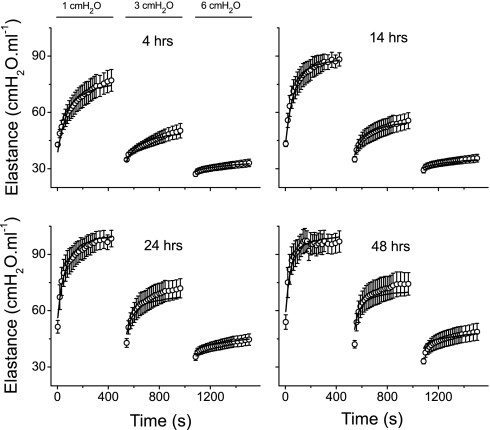
Measures of goodness of fit (Eq. 15) for each of the four model variants to the mean H data from each of the experimental groups at the three PEEP levels of 1, 3, and 6 cmH2O are shown in Fig. 3. In all experimental conditions, the residual error is lowest for Model D. The values of AICc determined for each of the models also showed that Model D overwhelmingly outweighs the others as the best model despite having the most free parameters. The fits to H provided by Model D to the means of each experimental data set are shown in Fig. 4. The root-mean-square error averaged over all fits is 1.003 cmH2O/ml.
Fig. 3.
Root-mean-square errors for the four model variants fitted to the H time-course data from all groups of mice.
Fig. 4.
Fits provided by Model D (lines) to the H time-course data from all groups of mice (symbols). The data were collected at PEEP levels of 1, 3, and 6 cmH2O as indicated.
Figure 5 shows the mean ± SE of the experimental H data from the control mice at 4, 14, 24, and 48 h after PBS instillation. Also shown are the mean time courses of E obtained from the models fits to each individual mouse. Corresponding plots for the mice with ALI are shown in Fig. 6. Virtually without exception, the mean model fits lie within the experimental standard errors. It should be noted that, since the model was fit to the data from each mouse individually, standard errors are also available for the mean fitted curves in Figs. 5 and 6. However, the variations in the fitted curves add little here because they reflect, in large part, the variations in the experimental data sets.
Fig. 5.
Mean fitted curves (lines) and the means ± SE data (○) from the control mice at the 4 times points after PBS instillation.
Fig. 6.
Mean fitted curves (lines) and the means ± SE data (○) from the injured mice at the 4 times points after hydrochloric acid instillation.
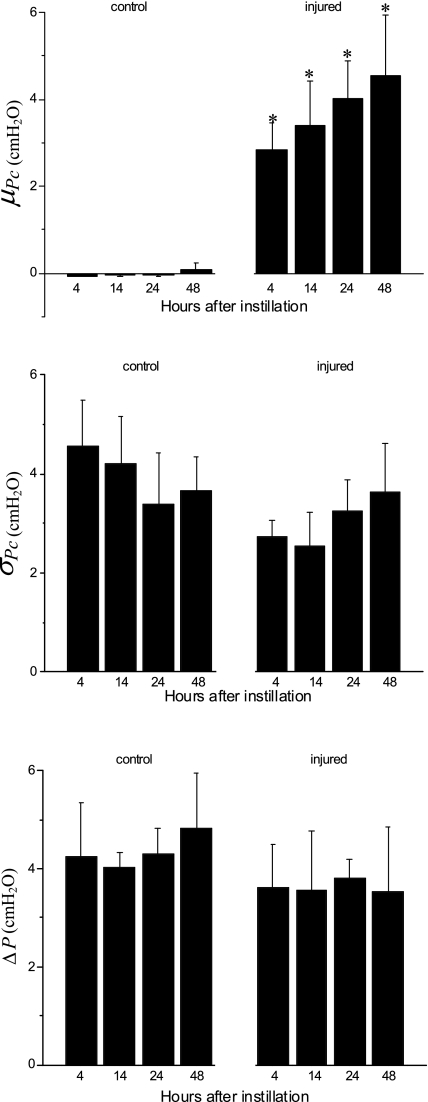
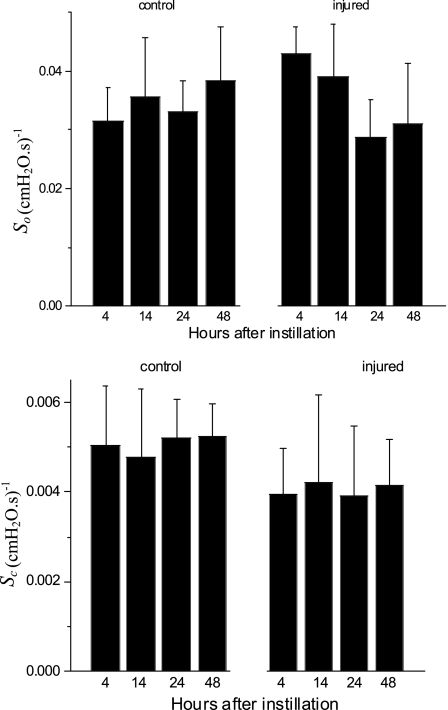
The means ± SE for the free parameters of Model D determining critical pressures for each group of mice are shown in Fig. 7, whereas those parameters determining speed along the virtual trajectory are shown in Fig. 8. No statistically significant differences were found in any parameter as a function of time (4, 14, 24, or 48 h) within either the control or injured mice. Furthermore, none of the parameters changed significantly between control and injured groups with the exception of μ which was increased markedly with injury at all time points. Because ΔP remained unchanged, this means that μ
 also increased significantly.
Fig. 7.
Values are means ± SD of the free parameters of Model D that pertain to critical opening and closing pressures; μ, mean; σ, standard deviation. *Statistically significant difference relative to all control groups.
Fig. 8.
Values are means ± SD of the free parameters of Model D that pertain to speed of movement of x along its virtual trajectory.
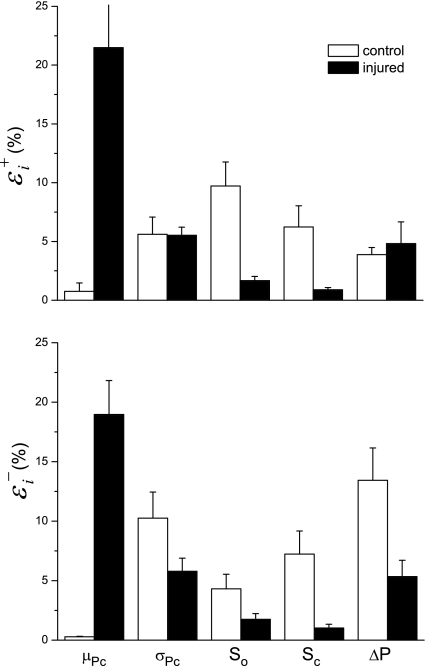
Figure 9 shows the sensitivity indices for each of the free parameters in Model D, averaged over all time points following instillation. Large values of these indices signify that the value of the parameter in question is strongly determined by the data; changing the parameter by a small amount causes a large decrement in the quality of the model fit. Interestingly, the largest values of ɛ and ɛ
and ɛ occur for the parameter μ
 which is also the only parameter that was affected by injury (Fig. 7). Thus the model strongly suggests that hydrochloric acid instillation into the lungs of mice increases critical closing and opening pressures substantially but has no noticeable effect on the delay in either opening or closing once the relevant critical pressure has been surpassed by a given amount.
Fig. 9.
Sensitivities of the root-mean-square residual to the parameters of Model D (means ± SE). A large value means the parameter is strongly determined by the data. ɛ and ɛ
and ɛ sensitivities to parameter increases and decreases, respectively.
DISCUSSION
We have demonstrated that a computational model of dynamic airway recruitment and derecruitment is capable of accurately simulating the PEEP and time dependence of lung elastance in ALI. Our model is based on that proposed by Bates and Irvin (8) but extends their original model in several ways. First, to make it relevant to the experimental data to which it was fit, we interfaced the Bates-Irvin model with a model of the mechanical ventilator used to collect the data. More importantly, however, we also found that we had to extend the details of recruitment and derecruitment in the model to obtain the best fits to the data. We began with the original Bates-Irvin formulation in which the critical opening and closing pressures are the same for each lung unit, and the rates of movement of x along the virtual trajectory are the same in both directions. However, this gave visually poor fits to the experimentally measured time courses of H (data not shown) and relatively large values for the root-mean-square residuals (Fig. 3). Progressively relaxing these constraints and allowing opening pressures to be greater than closing pressure and opening and closing velocities to be different significantly improved the fits of the model at all PEEP levels and at all time points after acid instillation (Figs. 4–6). The most general of the models (Model D) was found to be overwhelmingly more likely than the other simpler models, as judged by AICc, in both normal and injured mice.
Our finding that the time courses of H in mice demanded that we have a separation between Po and Pc (Fig. 7) is perhaps not surprising. Previous studies have suggested that the pressure required to open a closed airway is greater than the pressure below which the open airway closes (12, 18, 19, 25). By contrast, there are virtually no in vivo data to guide our expectations with regard to how quickly an airway will open or close once conditions conducive to such events have been established. Indeed, the notion that recruitment and derecruitment are dynamic processes has not received much formal attention to date, despite the fact that recruitment maneuvers are acknowledged to be more effective if peak inspiratory pressures are sustained (6, 28). Similarly, the gradual stiffening of the lungs that occurs during prolonged periods of mechanical ventilation, which becomes greatly pronounced in ALI (1), has been shown to be largely the result of progressive derecruitment of lung units (4). These observations leave little doubt that recruitment and derecruitment have important temporal aspects. What our model fitting seems to have added to the picture is that there is a difference in the latencies in opening and closing of lung units following the crossing of pressure thresholds (Fig. 7).
To make sense of a difference between So and Sc, we first need to consider what biophysical processes might be represented by the movement of x along its virtual trajectory. This construct was initially developed (8) as a purely empirical means of imparting dynamics to the process of recruitment and derecruitment, but it is at least superficially reminiscent of the mechanism by which liquid bridges across the lumen of small airways form and break. Otis et al. (24) have shown that, when a flexible conduit is lined with fluid, there are certain conditions under which the fluid layer becomes unstable and begins to spontaneously bulge inward until opposing sides meet to form a meniscus, or liquid bridge, that completely occludes the lumen. Conversely, Gaver and coworkers (14, 26, 33) have shown that to reopen an airway occluded by a liquid bridge, it is necessary to apply a pressure to move the bridge along the airway so that it deposits its contents along the tube wall until there is insufficient content left to maintain its integrity. It is not difficult to imagine that, once a liquid bridge has been formed, a significant increase in pressure above the formation point will be required to start moving the bridge and eventually break it. This could explain why μ is 4–5 cmH2O larger than μ
 (Fig. 7).
It is also not unreasonable to think that the time needed to form a meniscus from an unstable lining of airway liquid should be different to that involved in moving the meniscus along the airway to the point of breakage. After all, they are different physical processes. This could explain why So and Sc are very different even though neither varies between control and injured groups (Fig. 8). Of course, the breakage and formation of liquid bridges is not the only way that recruitment and derecruitment can occur; atelectatic collapse of alveoli or complete flooding of airspaces will achieve the same end. On the other hand, the biophysical properties of intra-airspace fluid, particularly its surface tension and viscosity, presumably play important roles in all these processes, so what applies to one may have some relevance to the others, such as the movement of a finger of air along an airway that is completely filled with liquid (26). Interestingly, the spread of Pc values about the mean (Fig. 7) indicate that Pc for some units is negative in control animals. This implies that some lung units would require a negative pressure to close, which suggests that the layers of liquid lining some of the airways were particularly stable.
The most interesting result of our study was the finding that the only effect of ALI was to increase μ and μ
and μ , the latter being linked to the former through their difference ΔP, which itself was not altered by injury (Fig. 7). Furthermore, among all the model parameters, μ
 for the injured mice had the largest values of ɛ (Fig. 9), meaning that this parameter is strongly supported by the data. This is likely a reflection of the fact that elastance varied substantially with PEEP in the injured mice (Fig. 4). The values of ɛ for the other two pressure-related parameters, σ
 and ΔP, are not as large in the injured mice but still indicate a reasonable degree of robustness (Fig. 9). By contrast, the two parameters related to speed of opening and closing, So and Sc, have rather small ɛ values in the injured animals, meaning that these parameters can vary rather widely without having a large impact on the goodness of fit of the model to the data examined in the present study. Interestingly, in the control mice the picture is more or less reversed because ɛ is quite large for So and Sc yet small for μ
 (Fig. 9). This probably reflects the fact that elastance shows little PEEP dependence in the control mice, yet its time course is similar at all PEEP levels (Fig. 4). In any case, given that our principal interest here is in how the model parameters are changed by ALI, the pattern of parameter sensitivities shown in Fig. 9 supports the reliability of our finding that parallel increases in opening and closing pressures account for the majority of the differences between the control and injured elastance data. There also seems to be a trend for this effect to increase as lung injury matures (Fig. 7) although the values of μ
 at the different time points after hydrochloric acid instillation were not significantly different.
The question that now arises is whether we can relate these changes in model parameters to any of the biophysical events that are involved in lung injury. In fact, several studies have shown that the pressures required to reopen collapsed airways (22, 26, 27) and the pressures below which airways close (10, 16) can both be increased by dysfunction of pulmonary surfactant. Surfactant dysfunction was a likely feature of the injured mice we studied because the lungs of these animals have previously been shown to contain increased levels of fibrin (3), a protein known to have a debilitating effect on surfactant. Our finding of an increased value of μ in the injured animals may therefore be a reflection of reduced surfactant function in this group. How, then, might we explain the corresponding lack of change in either So and Sc with lung injury? One possibility is suggested by the work of Perun and Gaver (26, 27) who showed that, even though surfactant affects the value of Po, once this critical pressure has been exceeded the rate of airway reopening becomes relatively insensitive to changes in surface tension but is dramatically affected by the viscosity of the airway lining fluid. Our results might thus be taken to suggest that, although hydrochloric acid instillation in mice changes the surface tension of the airway lining fluid, it does not change its viscosity.
Of course, any attempts to link the parameter values in our model to mechanisms governing recruitment and derecruitment in the lung must be tempered by the many assumptions inherent in the model itself. This model began as a purely empirical attempt to mimic the dynamics of recruitment and derecruitment (8). Consequently, the extent to which any of the model mechanisms (particularly those involved with the virtual trajectory) resemble putative biophysical events taking place in a real lung may be largely fortuitous, if not even somewhat contrived. Our results must therefore be viewed in light of the numerous limitations of the model. Most significant among these are that the units in the model are all identical and arranged in parallel, which neglects the regional heterogeneity of mechanical function that exists in a real lung. Also, the airway tree structure in a real lung permits airway opening during a recruitment maneuver to occur in a series of avalanches (31) that are not reproduced by the present model. Even the statistical distributions chosen for the individual parameter values in the model are rather arbitrary. At least in the case of Po and Pc there is radiological evidence in human patients (12, 13, 25) to support the use of normal distributions (Eqs. 11 and 12). Also, we experimented with log-normal distributions for these parameters and obtained poorer model fits (data not shown). In the case of so and sc, however, the use of hyperbolic distributions (Eqs. 13 and 14) was purely arbitrary and merely followed our original study (8). There are, of course, essentially limitless possibilities for these distributions. Accordingly, the most we can say about the particular distributions we chose for the present study is that they resulted in excellent model fits (Figs. 4–6).
The model has numerous other simplifications. For example, to keep the model as simple as possible, we neglected the known volume dependence of lung stiffness even though elastance depended on volume in the original model of Bates and Irvin (8). We also neglected any dependence resistance might have on either volume or flow, and we did not include any effects attributable to gravitational gradients, which are known to influence regional lung stiffness. This is not the end of the list of possible features we could have included in the model but chose not to in the interests of clarity. We do not believe these omissions would have affected our overall conclusions, but they may have changed some of the details of distributions of critical pressures and x velocities that we estimated.
Finally, the concept that recruitment and derecruitment are dynamic processes has some potentially significant implications for ventilator management of ALI. Foremost among these is that it greatly complicates the issue of how to ventilate the lung over an “optimal pressure range” that balances the deleterious effects of overdistension against those of cyclic airway reopening. The latency caused by movement of x along its virtual trajectory in our model means that the particular airways that open and close during a breath are highly dependent on the prior volume history of the lung. In other words, the optimal pressure range mentioned above is not fixed but varies depending on how the lung has been ventilated previously. This bears on the utility of recruitment maneuvers, which is often debated in binary terms. Such a debate clearly misses the point. The real question about recruitment maneuvers is surely not “Should they be used or shouldn't they?” but rather “How often?”. The dynamic nature of recruitment and derecruitment may also be key to understanding the efficacy of novel modes of mechanical ventilation that exploit intermittent variations in the ventilatory pattern, such as variable volume ventilation (21, 32) and airway pressure release ventilation (30). The efficacy of these modes may be as influenced by the timing of their various tidal volume components as by the magnitudes of those components. Our model may provide a means for addressing this question.
In summary, we have fit a computational model featuring the dynamics of pulmonary recruitment and derecruitment to lung elastance data obtained from normal mice and mice with ALI. Excellent fits to the data were obtained when the normally distributed critical opening pressures were about 5 cmH2O above the closing pressures and when the hyperbolically distributed opening velocities were about an order of magnitude greater than the closing velocities. We also found that hydrochloric acid-induced lung injury caused the opening and closing pressures to increase markedly with no change in the velocities, suggesting that the key biophysical change wrought by acid injury is dysfunction of surface tension at the air-liquid interface in the lungs. These conclusions are, of course, based on a computational model containing numerous assumptions, and they apply only to the particular mouse model of ALI that we studied here. As such, the conclusions are inferential in nature and must be further tested. Nevertheless, they serve as a useful starting point for further studies of other animal models of ALI. They also illustrate the importance of dynamics in the understanding of recruitment and derecruitment in the lung.
Acknowledgments
This study was funded by NIH grants HL75593 and NCRR-P20 RR15557.
The costs of publication of this article were defrayed in part by the payment of page charges. The article must therefore be hereby marked “advertisement” in accordance with 18 U.S.C. Section 1734 solely to indicate this fact.
REFERENCES
- 1.Allen G, Bates JH. Dynamic mechanical consequences of deep inflation in mice depend on type and degree of lung injury. J Appl Physiol 96: 293–300, 2004. [DOI] [PubMed] [Google Scholar]
- 2.Allen G, Lundblad LK, Parsons P, Bates JH. Transient mechanical benefits of a deep inflation in the injured mouse lung. J Appl Physiol 93: 1709–1715, 2002. [DOI] [PubMed] [Google Scholar]
- 3.Allen GB, Leclair T, Cloutier M, Thompson-Figueroa J, Bates JH. The response to recruitment worsens with progression of lung injury and fibrin accumulation in a mouse model of acid aspiration. Am J Physiol Lung Cell Mol Physiol 292: L1580–L1589, 2007. [DOI] [PubMed] [Google Scholar]
- 4.Allen GB, Pavone LA, DiRocco JD, Bates JH, Nieman GF. Pulmonary impedance and alveolar instability during injurious ventilation in rats. J Appl Physiol 99: 723–730, 2005. [DOI] [PubMed] [Google Scholar]
- 5.Allen GB, Suratt BT, Rinaldi L, Petty JM, Bates JH. Choosing the frequency of deep inflation in mice: balancing recruitment against ventilator-induced lung injury. Am J Physiol Lung Cell Mol Physiol 291: L710–L717, 2006. [DOI] [PubMed] [Google Scholar]
- 6.Amato MB, Barbas CS, Medeiros DM, Schettino Gde P, Lorenzi Filho G, Kairalla RA, Deheinzelin D, Morais C, Fernandes Ede O, Takagaki TY. Beneficial effects of the “open lung approach” with low distending pressures in acute respiratory distress syndrome. A prospective randomized study on mechanical ventilation. Am J Respir Crit Care Med 152: 1835–1846, 1995. [DOI] [PubMed] [Google Scholar]
- 7.Bates JH, Allen GB. The estimation of lung mechanics parameters in the presence of pathology: a theoretical analysis. Ann Biomed Eng 34: 384–392, 2006. [DOI] [PubMed] [Google Scholar]
- 8.Bates JH, Irvin CG. Time dependence of recruitment and derecruitment in the lung: a theoretical model. J Appl Physiol 93: 705–713, 2002. [DOI] [PubMed] [Google Scholar]
- 9.Brower RG, Morris A, MacIntyre N, Matthay MA, Hayden D, Thompson T, Clemmer T, Lanken PN, Schoenfeld D. Effects of recruitment maneuvers in patients with acute lung injury and acute respiratory distress syndrome ventilated with high positive end-expiratory pressure. Crit Care Med 31: 2592–2597, 2003. [DOI] [PubMed] [Google Scholar]
- 10.Cassidy KJ, Halpern D, Ressler BG, Grotberg JB. Surfactant effects in model airway closure experiments. J Appl Physiol 87: 415–427, 1999. [DOI] [PubMed] [Google Scholar]
- 11.Clayton TJ, Pittman JA, Gabbott DA. A comparison of two techniques for manual ventilation of the lungs by non-anaesthetists: the bag-valve-facemask and the cuffed oropharyngeal airway (COPA) apparatus. Anaesthesia 56: 756–759, 2001. [DOI] [PubMed] [Google Scholar]
- 12.Crotti S, Mascheroni D, Caironi P, Pelosi P, Ronzoni G, Mondino M, Marini JJ, Gattinoni L. Recruitment and derecruitment during acute respiratory failure: a clinical study. Am J Respir Crit Care Med 164: 131–140, 2001. [DOI] [PubMed] [Google Scholar]
- 13.Gattinoni L, Caironi P, Pelosi P, Goodman LR. What has computed tomography taught us about the acute respiratory distress syndrome? Am J Respir Crit Care Med 164: 1701–1711, 2001. [DOI] [PubMed] [Google Scholar]
- 14.Gaver DP, Samsel RW, Solway J. Effects of surface tension and viscosity on airway reopening. J Appl Physiol 69: 74–85, 1990. [DOI] [PubMed] [Google Scholar]
- 15.Gomes RF, Shen X, Ramchandani R, Tepper RS, Bates JH. Comparative respiratory system mechanics in rodents. J Appl Physiol 89: 908–916, 2000. [DOI] [PubMed] [Google Scholar]
- 16.Halpern D, Grotberg JB. Surfactant effects on fluid-elastic instabilities of liquid-lined flexible tubes: a model of airway closure. J Biomech Eng 115: 271–277, 1993. [DOI] [PubMed] [Google Scholar]
- 17.Hantos Z, Daroczy B, Suki B, Nagy S, Fredberg JJ. Input impedance and peripheral inhomogeneity of dog lungs. J Appl Physiol 72: 168–178, 1992. [DOI] [PubMed] [Google Scholar]
- 18.Hickling KG Best compliance during a decremental, but not incremental, positive end-expiratory pressure trial is related to open-lung positive end-expiratory pressure: a mathematical model of acute respiratory distress syndrome lungs. Am J Respir Crit Care Med 163: 69–78, 2001. [DOI] [PubMed] [Google Scholar]
- 19.Hickling KG The pressure-volume curve is greatly modified by recruitment. A mathematical model of ARDS lungs. Am J Respir Crit Care Med 158: 194–202, 1998. [DOI] [PubMed] [Google Scholar]
- 20.Hurvich CM, Tsai CL. Regression and time series model selection in small samples. Biometrika 76: 297–307, 1989. [Google Scholar]
- 21.Mutch WA, Lefevre GR, Cheang MS. Biologic variability in mechanical ventilation in a canine oleic acid lung injury model. Am J Respir Crit Care Med 163: 1756–1757, 2001. [DOI] [PubMed] [Google Scholar]
- 22.Naureckas ET, Dawson CA, Gerber BS, Gaver DP, 3rd Gerber HL, Linehan JH, Solway J, Samsel RW. Airway reopening pressure in isolated rat lungs. J Appl Physiol 76: 1372–1377, 1994. [DOI] [PubMed] [Google Scholar]
- 24.Otis DR, Johnson M, Pedley TJ, Kamm RD. Role of pulmonary surfactant in airway closure: a computational study. J Appl Physiol 75: 1323–1333, 1993. [DOI] [PubMed] [Google Scholar]
- 25.Pelosi P, Goldner M, McKibben A, Adams A, Eccher G, Caironi P, Losappio S, Gattinoni L, Marini JJ. Recruitment and derecruitment during acute respiratory failure: an experimental study. Am J Respir Crit Care Med 164: 122–130, 2001. [DOI] [PubMed] [Google Scholar]
- 26.Perun ML, Gaver DP 3rd. An experimental model investigation of the opening of a collapsed untethered pulmonary airway. J Biomech Eng 117: 245–253, 1995. [DOI] [PubMed] [Google Scholar]
- 27.Perun ML, Gaver DP 3rd. Interaction between airway lining fluid forces and parenchymal tethering during pulmonary airway reopening. J Appl Physiol 79: 1717–1728, 1995. [DOI] [PubMed] [Google Scholar]
- 28.Rimensberger PC, Cox PN, Frndova H, Bryan AC. The open lung during small tidal volume ventilation: concepts of recruitment and “optimal” positive end-expiratory pressure. Crit Care Med 27: 1946–1952, 1999. [DOI] [PubMed] [Google Scholar]
- 29.Schuessler TF, Bates JH. A computer-controlled research ventilator for small animals: design and evaluation. IEEE Trans Biomed Eng 42: 860–866, 1995. [DOI] [PubMed] [Google Scholar]
- 30.Seymour CW, Frazer M, Reilly PM, Fuchs BD. Airway pressure release and biphasic intermittent positive airway pressure ventilation: are they ready for prime time? J Trauma 62: 1298–1308; discussion 1308–1299, 2007. [DOI] [PubMed] [Google Scholar]
- 31.Suki B, Barabasi AL, Hantos Z, Petak F, Stanley HE. Avalanches and power-law behaviour in lung inflation. Nature 368: 615–618, 1994. [DOI] [PubMed] [Google Scholar]
- 32.Thammanomai A, Hueser LE, Majumdar A, Bartolak-Suki E, Suki B. Design of a new variable-ventilation method optimized for lung recruitment in mice. J Appl Physiol 104: 1329–1340, 2008. [DOI] [PubMed] [Google Scholar]
- 32a.The Acute Respiratory Distress Syndrome Network. Ventilation with lower tidal volumes compared with traditional tidal volumes for acute lung injury and the acute respiratory distress syndrome. N Engl J Med 342: 1301–1308, 2000. [DOI] [PubMed] [Google Scholar]
- 33.Yap DY, Liebkemann WD, Solway J, Gaver DP 3rd. Influences of parenchymal tethering on the reopening of closed pulmonary airways. J Appl Physiol 76: 2095–2105, 1994. [DOI] [PubMed] [Google Scholar]


