

Abstract
Brownian dynamics methodology was applied to simulate the encounter of aminoglycosidic antibiotics with the ribosomal A-site RNA. Studied antibiotics included neamine, neomycin, ribostamycin and paromomycin which differ in chemical structure, the number of pseudo-sugar rings and the net charge. The influence of structural, electrostatic and hydrodynamic properties of antibiotics on the kinetics of their association with the ribosomal A-site was analyzed. The computed diffusion limited rates of association are of the order of 1010 and they weakly depend on ionic strength. Prior to binding antibiotics often slide along the RNA groove with the time scale of approximately 10 ns per base pair in case of neamine. We observed that upon forming the encounter complex aminoglycosides displace from the binding pocket up to two Mg2+ ions.
Introduction
Aminoglycosidic antibiotics are a family of antibacterial drugs which are widely used in medical therapy for over 60 years. Most aminoglycosides interfere with translation by binding to the prokaryotic tRNA decoding A-site of the 16S RNA in the 30S ribosomal subunit.1 They interfere with the decoding process by decreasing the accuracy of translation and by blocking proper peptide synthesis.2, 3 Upon binding, aminoglycosides displace two universally conserved adenine residues (A1492 and A1493) which are involved in contacts with the mRNA-tRNA hybrid. This leads to reduced discrimination against non-cognate tRNAs and decreases translational fidelity.4–8 Unfortunately, aminoglycosides suffer from moderate affinity, inadequate specificity and are toxic to mammalian ear and kidney cells. Moreover, bacterial resistance limits their effectivenes in medical therapy. Therefore, there is a widely recognized need to understand their binding mechanism in order to improve their selectivity and efficiency.
Aminoglycosides are sugar derivatives with various number of amine and hydroxyl groups. Antibiotics considered in this work, i.e., neamine, ribostamycin, paromomycin and neomycin (see Figure 1), belong to the 4,5-disubstituted 2-deoxystreptamine neomycin class. They consist of a 2-deoxystreptamine ring with amino sugar ring substitutions at positions 4 and 5. Position 5 is the attachment point for auxiliary rings. Aminoglycosides are all positively charged at physiological pH due to the number of their amine groups9 and, therefore, possess high affinity for the negatively charged RNA. The nature of the RNA - aminoglycoside interactions was found to be predominantly electrostatic.10–12
Figure 1.
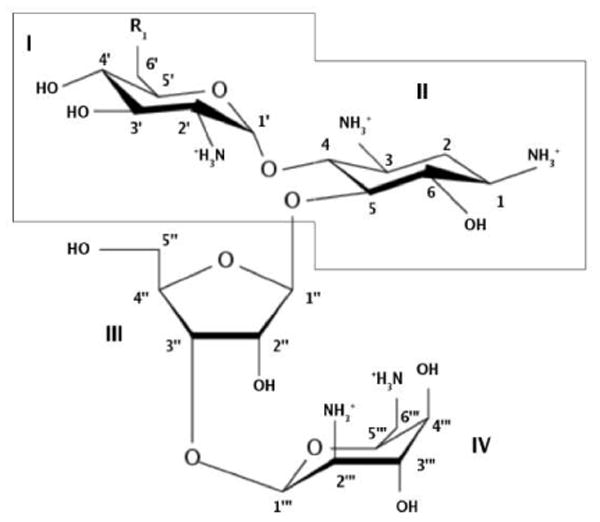
Studied aminoglycosides. Neamine: rings I and II (inside the contour) with ; ribostamycin: rings I-III with ; neomycin: rings I-IV with ; paromomycin: rings I-IV with R1 = OH.
It was found that aminoglycosides bind to the A-site-containing RNA oligonucleotides in a manner similar to that of the full ribosome.13–16 In recent years, crystal structures of several aminoglycosides bound to the A-site RNA constructs became available.17–19 Crystal structures of aminoglycosides bound to the entire 30S ribosomal subunit were solved as well.20–22 Because the structures of aminoglycosides complexed with the A-site RNA motifs reproduce the way of binding to the 30S subunit, they provide good models to study aminoglycosidic recognition which was also confirmed by fluorescence experiments.23, 24
Detailed knowledge of how aminoglycosides interact with their binding sites on the ribosome may help in understanding why antibiotics block certain stages of translation. Previous studies, both experimental12, 25–30 and theoretical10–12, 31 considered both structural properties of antibiotic/RNA complexes and thermodynamics of binding. For aminoglycosides' inhibitory role, it is not only important how strong are the bound complexes but how fast they can be formed. Therefore, in our work we focus on the first stages of the binding process, namely the diffusion toward the RNA and association to form the encounter complex. We inspect how electrostatics influences these processes. There is no available experimental data which considers this problem in case of aminoglycosidic antibiotics and RNA, neither such studies have been conducted so far with theoretical methods.
To study the kinetics of association of aminoglycosides with the RNA, we apply Brownian dynamics (BD) methodology, which is a powerful technique to simulate the diffusional motion between interacting solutes.32–34 BD is commonly used to provide theoretical estimates of the association rates of diffusion controlled reactions. This method was proven to be particularly useful for studying protein-ligand,35, 36 protein-protein37, 38 and DNA-ligand interactions.39 The interacting molecules move in a continuum solvent that exerts stochastic forces which lead to random collisions and induce a Brownian motion. BD trajectories are generated by solving the Ermak-McCammon equation32 in a series of time steps to reach microsecond time scales with interparticle electrostatic interactions described with the Poisson-Boltzmann model.40, 41 Based on the number of association events, the probability of encounter and the rate of association are estimated.42, 43
From the BD simulations we determine the association rates of aminoglycosides to the A-site RNA and investigate their diffusion towards the binding site together with the influence of mobile counterions. Based on the reactive trajectories we analyze the mechanism of the encounter complex formation with the RNA and its dependence on the net charge, chemical composition and hydrodynamic properties of antibiotics. The simulations enabled us to describe the interactions governing the diffusion and binding of antibiotics to the ribosomal A-site.
Methods
Simulation of diffusional motion with Brownian dynamics
The theory of Brownian motion can be applied to particles immersed in solvent provided that their mass and size are larger than the mass and size of the solvent molecules. Such particles undergo a continuous irregular Brownian motion due to collisions with solvent molecules and their displacement Δr⃗ in time Δt is given by44, 45
| (1) |
where D is the translational diffusion coefficient of the particle (for non-spherical particles D has a meaning of an average diffusion coefficient) and
| (2) |
where kB is Boltzmann constant, T is absolute temperature, η is solvent viscosity, and a is the hydrodynamic radius of the particle. The dynamics of diffusional motion is described by Langevin equation. One possible way of solving this equation is a propagation scheme presented by Ermak and McCammon.32 The motion of a ligand, composed of spherically symmetric subunits, diffusing to a fixed receptor and subjected to both intersubunit and external forces, can be derived from the following equation
| (3) |
where indices i and j run over the particle coordinates (1 ≤ i, j ≤ 3N), ri is the position vector component, Fi is the sum of intersubunit and external forces acting in direction i, integer n represents discrete times t = nΔt at intervals (time steps) Δt, Dij is the diffusion tensor which is configuration dependent, and Ri(Δt) is a random displacement whose average value is zero and . Typically a relative motion of a ligand to a fixed receptor is simulated and the hydrodynamic interactions between them are neglected. Therefore, the diffusion coefficient of the receptor is summed into diagonal parts of the diffusion tensor.
Modeling of forces
Because for a number of biomolecules the electrostatic steering is the main force driving the encounter, it is important to have an accurate description of interparticle electrostatic interactions. In BD simulations intermolecular forces, Fi, are given as a sum of exclusion and electrostatic terms.46 Other interactions, such as hydrogen bonding and van der Waals forces are neglected as they are too computationally demanding with regard to microsecond time scales achieved by this method.
Treatment of electrostatic interactions is based on the Poisson-Boltzmann model.40, 41 A molecule, immersed in a continuum solvent characterized with a high dielectric constant of ε ∼ 80, is represented as a set of beads with centrally assigned partial charges and with ε typically in the range 2 - 12.47–50 Effects arising from dielectric heterogeneity and ionic strength are also included. Electrostatic properties of such system can be derived from the nonlinear Poisson-Boltzmann equation40, 41
| (4) |
where ε(r⃗) is a function of the position, ψ(r⃗) is the electrostatic potential, ρ(r⃗) is the fixed molecular charge density. The sum represents the mean concentration of zi-valent ions given by the Boltzmann distribution where is the ion concentration in the bulk and e is the proton charge. For biomolecules of arbitrary shape Equation 4 needs to be solved numerically, e.g. with the finite-difference method46, 51, 52 which gives as an output the electrostatic potential of a molecule on a 3D grid. In BD a ligand moves in the potential generated by a receptor obtained from the solution of the Poisson-Boltzmann equation. Intermolecular forces are computed considering the ligand as a set of point charges immersed in the continuum solvent.53
Estimation of association rates
To compute bimolecular association rate constant, a solution of the diffusion equation is required and it can only be provided for systems with simple geometry. However, BD simulations allow one to estimate association rates and include the effects of molecular shape, charge distribution, internal motion and hydrodynamic interactions. The association rate k computed based on a BD simulation is given by43
| (5) |
where kD(b) is the steady state rate constant for two particles separated with the distance b (see Figure 2) and β∞ is the probability that having reached that distance particles will form an encounter complex. The value of kD(b) can be computed analytically42, 54 but β∞ must be estimated based on the BD simulation in which a large number of trajectories is generated.43
Figure 2.

Schematic diagram illustrating the BD method. Antibiotic (depicted with blue beads) moves through the electric field generated by the RNA (shown as van der Waals spheres). Lines of the electrostatic field are shown in red. Simulations are performed in coordinates defined relative to the position of the central oligonucleotide. At the beginning of a trajectory, the ligand is placed with a randomly chosen orientation at a randomly chosen point on the surface of the sphere with radius b. BD trajectory is then generated. During a BD simulation the ligand either diffuses outside a sphere of radius q and the trajectory is truncated or satisfies the predefined reaction criteria and the formation of an encounter complex takes place. The b radius is chosen such that outside this sphere forces acting on the ligand are centrosymmetric. The ratio of the number of reactive trajectories to the total number of trajectories allows one to compute the association rate constant.
Preparation of systems for Brownian dynamics simulations
The coordinates of an oligonucleotide A-site duplex complexed with two paromomycin molecules (Figure 3) were taken from the Protein Data Bank (entry code 1J7T17). For computations of electrostatic potential and generation of BD trajectories, based on this structure three variants of the oligonucleotide A-site model were derived: a structure of the bare A-site duplex (total charge of -40e), of the A-site duplex with one bound paromomycin (total charge of -35e) and of the bare A-site but with six explicitly modeled Mg2+ ions (total charge of -28e). The magnesium ions were not present in the original crystal structure of the A-site RNA and their initial positions near the oligonucleotide surface (Figure 3) were obtained based on the coordinates of the Thermus thermophilus 30S subunit complexed with paromomycin (PDB entry code 1FJG7, 22). Such an approach seemed reasonable because the root mean square deviation between the single A-site fragment of the studied duplex and the corresponding fragment of the 30S subunit with regard to backbone phosphate groups is 1.18Å; therefore, the conformation of the RNA fragments containing the A-site is very similar in both structures. We decided to perform test simulations with explicit Mg2+ ions because the RNA is known to bind both monovalent and divalent ions which neutralize the backbone phosphate charges and are required for proper folding. Moreover, Mg2+ ions are thought to be required for the formation of specific tertiary contacts.55–57 Also, aminoglycosides are believed to displace ions from their RNA binding site upon complexation.11, 58 We aimed to test whether the presence of positive divalent ions in the proximity of aminoglycosidic binding site can influence the kinetics of binding to the RNA. We performed two kinds of simulations involving Mg2+ ions, either fixing their positions near the RNA surface or allowing them to diffuse freely in the solution.
Figure 3.
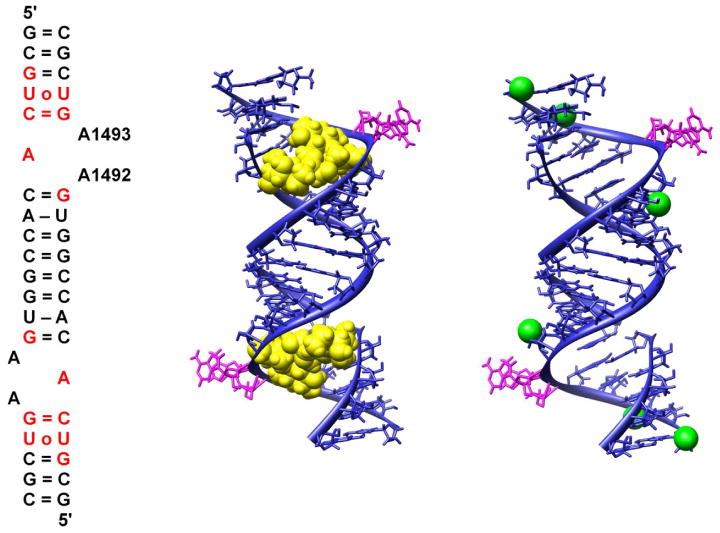
Overall view of paromomycin/A-site oligonucleotide complex. Left: Secondary structure of the crystallized RNA duplex (two similar A-site models). A1492 and A1493 are labeled according to E. coli numbering. Base pairs are represented with = and – (corresponding to 3 or 2 hydrogen bonds, respectively) for Watson-Crick pairs or ○ for non-Watson-Crick pairs. Red color denotes nucleotides in direct contact with paromomycin. Middle: three-dimensional structure of the RNA duplex (blue) with paromomycins shown in yellow as van der Waals spheres and A1492 and A1493 denoted in magenta. Right: Positions of explicit Mg2+ ions (green spheres) docked to the oligonucleotide A-site duplex based on their coordinates in the 30S ribosomal structure.
Partial charges and radii were assigned according to Amber force field parameters;59 hydrogens were added to heavy atoms and their positions were energy-minimized with the SANDER module of AMBER 8 package using 10000 steps of the steepest descent algorithm. Structures of neamine, ribostamycin, and neomycin were constructed based on the coordinates of the A-site RNA complexed with two paromomycins by simple removal or replacement of atoms with the Insight II 2000 software.60 Partial charges for antibiotics were computed with the bcc option of the ANTECHAMBER application.61 The aminoglycosides were determined to be fully protonated upon binding to RNA62 and accordingly, neamine and ribostamycin were assigned a total net charge of +4e, paromomycin of +5e and neomycin that of +6e (Figure 1).
For the BD simulation, hydrodynamic parameters (such as translational diffusion coefficients and Stokes translational radii) are required. One also needs to construct hydrodynamic models of ligands, i.e., the representation of each ligand as a set of beads with hydrodynamic properties corresponding to its all-atom structure (see Figure 4). Because there is no experimental data regarding diffusion of those molecules, to compute the hydrodynamic properties of all antibiotics we used the HYDROPRO software of Garcia de la Torre.63, 64 To validate our results we parameterized the used software based on the ATP molecule for which experimental results are known.65 We represented each antibiotic with different number of beads corresponding to the number of its pseudo-sugar rings (Figure 4). Beads were centered on the geometric centers of rings and were assigned a total charge according to the number of amine groups connected to the given ring. Hydrodynamic radii of beads were chosen such that the resulting bead models reproduced the values of diffusional coefficients of antibiotics modeled with the all-atom representation (Table 1). To construct appropriate bead models, in-house software developed by one of us was used.66 Magnesium ions were represented as spheres with a central +2e charge and a size sufficient to enclose a fully solvated ion, i.e. an ion surrounded by six water molecules (Table 1). Translational diffusion coefficient and hydrodynamic radius of the oligonucleotide fragment required for BD simulations were also determined with the HYDROPRO software.
Figure 4.
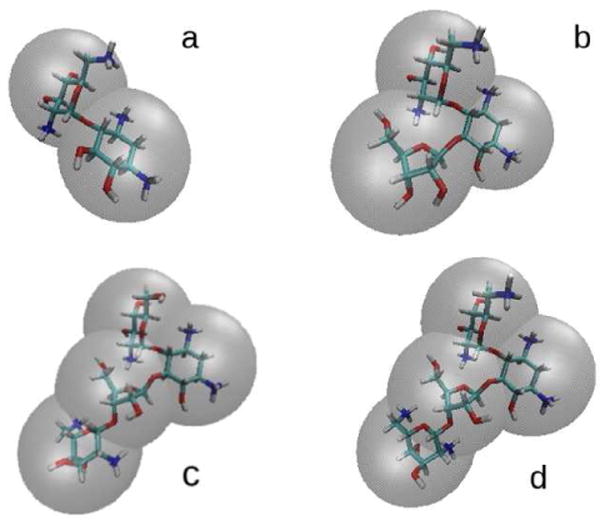
Atomic structures and bead models used in BD simulations of antibiotics: a) neamine, b) ribostamycin, c) paromomycin d) neomycin. Each antibiotic is represented as a set of beads which are centered on the appropriate ring.
Table 1.
Parameters used in Brownian dynamics simulations. Translational diffusion coefficients (Dtr), number of beads modeling ligands (Nb), hydrodynamic radii (RHB) of beads, and charge assigned to each bead Q.
| molecule | Dtr [ ] | Nb | RHB [Å] | Q |
|---|---|---|---|---|
| neamine | 4.15 · 10−6 | 2 | 4.30 | 2.0, 2.0 |
| ribostamycin | 3.78 · 10−6 | 3 | 4.70 | 2.0, 2.0, 0.0 |
| paromomycin | 3.21 · 10−6 | 4 | 4.40 | 2.0, 2.0, 0.0, 1.0 |
| neomycin | 3.18 · 10−6 | 4 | 4.50 | 2.0, 2.0, 0.0, 2.0 |
| Mg2+ | 5.71 · 10−6 | 1 | 3.75 | 2.0 |
| A-site duplex | 1.02 · 10−6 |
Electrostatic calculations
All electrostatic calculations were carried out with the University of Houston Brownian Dynamics (UHBD) package.53 The electrostatic potential and forces were calculated by solving the nonlinear Poisson-Boltzmann equation. Cubic 3D grids centered on the RNA with dimensions of 365×365×365 and a 1.0Å and 0.5Å spacings (focusing feature of the UHBD program) were used. For the largest grid the multiple Debye-Hückel boundary conditions were applied.53 Ionic strength of the solvent was varied from 50 to 300mM in equal steps of 50mM at a constant temperature of 293K. The dielectric constant of the RNA interior was set to 4 and that of the solvent to 78. We also calculated the electrostatic potentials with lower (2) and higher (12) ε values inside the RNA. Test BD simulations with these ε were performed but no significant influence on the results was observed. The Richards probe-accessible surface67 of the molecule was used for the definition of the dielectric boundary; the value of 1.4Å was used for the solvent probe radius and an initial set of 280 surface dots per atom;68 Stern ion exclusion layer was defined with a 2Å radius.
BD simulations
BD simulations were performed with the UHBD package.53 To compute the association rates, for each antibiotic a total number of 5000 trajectories at six values of ionic strengths was simulated. All trajectories began with the antibiotic and the RNA fragment at a center-to-center distance of 90Å (b-sphere). The radius of the q-sphere was set to 300Å. The ligand model implemented in UHBD takes into account internal flexibility of molecules as each bead is able to move interacting hydrodynamically and electrostatically with others. To maintain the overall shape of the diffusing molecule, holonomic constraints are applied (SHAKE algorithm53) which assure that molecules rotate and translate as a whole accordingly to its diffusional properties. To maintain the lengths of the pseudo-bonds connecting the beads, SHAKE algorithm was applied with a 0.2Å tolerance. A variable time step was used; the value of 0.1ps in the region within 50Å around the RNA, 0.5ps in the region within 50 - 75Å, 1.0ps within 75 - 120Å, and 1.5ps within 120 - 300Å. Apart from the hydrodynamic radii each bead was assigned an exclusion radius of 2Å in order to account for the steric exclusion of the ligand by the RNA fragment. This did not permit any of the antibiotic bead (i.e. its center) to come closer than this radius to the van der Waals surface of any RNA atom. The exclusion radius chosen for each bead is smaller than its hydrodynamic radius in order to account, at least partially, for the flexibility of the RNA fragment; larger exclusion radii would prohibit closer contacts between the antibiotic and RNA.
BD simulations including Mg2+ ions (either fixed or mobile) and a mobile paromomycin were performed at 150mM ionic strength. Constant time step of 0.1ps was used in this case. During simulations with mobile Mg2+ ions all BD trajectories were initiated with paromomycin placed randomly on the b sphere. The starting positions of Mg2+ were chosen as in Figure 3. 5000 BD trajectories were simulated in each case. In both cases interactions between the antibiotic and ions are taken into account; however, they are treated differently. Fixed ions are treated as subunits of the receptor because their presence influences the shape and electrostatic potential around the RNA fragment and therefore the movement of the antibiotic. When Mg2+ ions and the paromomycin diffuse in the potential of the bare RNA fragment, their mutual influence is modeled with Coulombic and excluded volume interactions.
Reaction criteria
As a measure of a successful formation of the encounter complex, for each antibiotic we defined 3 reaction criteria (distances between the centers of beads mimicking aminoglycosidic rings and RNA atoms, see Figure 5). These criteria were chosen based on intermolecular distances observed in the crystal structure of paromomycin/RNA complex. We assumed that the formation of the complex occurred when all of the observed distances differed from those of the crystal structure by less than 5Å. Such definition is rather tight but we aimed to avoid ambiguities arising from the cylindrical shape of the RNA, as well as those trajectories which finished successfully but with the ligand bound on the other side of the A-site. Because the structure of the oligonucleotide is a fully symmetric duplex containing two antibiotic binding sites (Figure 3), during BD simulations the reaction criteria were checked for both sites.
Figure 5.
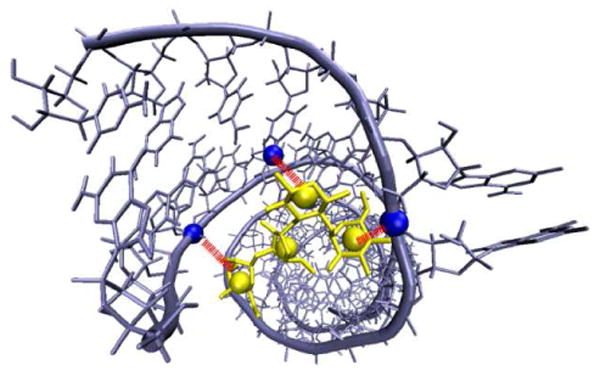
Exemplary reaction criteria used in BD simulations of paromomycin. Distances between centers of three beads of the antibiotic (shown in yellow) and oxygen (residue U39) and phosphorus (residue U4 and A37) atoms (shown in blue) were monitored. RNA chains are shown with ribbons.
Results
Diffusion of antibiotics near the surface of the RNA
Computing of reaction rates based on BD simulations requires gathering large number of trajectories. According to the theory described in the Methods section, these trajectories can terminate either as successful ones, i.e., satisfying the reaction criteria, or as nonreactive, in case when the ligand escapes beyond the q-sphere. The probability of the reaction is determined based on the ratio of successful and the total number of trajectories.43 However, BD trajectories are of finite length because in the calculations their duration is restricted by a predefined maximal time and maximal number of steps. Hence, it is possible that after exceeding of a predefined allowed number of steps, the trajectory terminates and the diffusing molecule remains inside the q-sphere but without satisfying the reaction criteria. This can pose a problem if one deals with a molecular system consisting of strongly interacting species. In the presented case, where the backbone phosphate groups of the RNA are a source of highly negative potential attracting positively charged antibiotics, the number of such trajectories turned out to be statistically important.
We observed three cases which led to termination of trajectories with the ligand remaining inside the q-sphere. One group included those where the antibiotic visited both binding pockets, i.e., two reactive events were recorded, in between which the ligand moved through a groove that connects the binding sites. Second group consisted of trajectories during which the ligand got trapped in one of the binding pockets and did not leave until the maximal number of allowed steps (107) was reached; in that case only one reaction event was recorded. The third group included trajectories in which no reaction events were observed because the ligand was trapped at the molecular surface of the RNA and was not able to get to the binding site in the finite trajectory time. The latter cases were not observed for the smallest antibiotic i.e., neamine. The largest number of events ending with the ligand trapped on the RNA surface was observed for ribostamycin and was of the order of 10% of the total number of generated trajectories. For paromomycin and neomycin, which are the biggest and most highly charged from the studied set, the number of such trajectories was not statistically significant.
Taking into account the overall shape of molecules, their size, the total charge and diffusion coefficients, the observed trappings of ligands inside the RNA groove can be explained as a result of not only purely electrostatic origin but also of steric interactions. The smallest neamine modeled with only two beads diffused most efficiently through the RNA groove. For ribostamycin, of similar to neamine total charge (+4e) but composed of three beads, diffusion was less efficient and the strongest capture was observed. For paromomycin (+5e) and neomycin (+6e) composed of four beads trapping inside the RNA groove was also observed but their diffusion near the RNA surface was more efficient than that of ribostamycin. Because we were interested not only in the mechanism of encounter but also in the association rate constants, to avoid any “truncated” trajectories due to the time or steps limit, we enlarged the maximal number of steps for generating BD trajectories hard-coded in the UHBD program.
For trajectories during which a ligand visited both A-sites we determined the time it takes for the antibiotic to move between both binding sites. For neamine, the smallest one from the set, we present the times of its residence near the surface of the RNA fragment. Figure 6 shows the distribution of time intervals between subsequent binding events of neamine to the RNA A-sites and distribution of time intervals between the beginning of the BD trajectory and the first act of binding. The latter distribution is shown only for comparison - those intervals depend on the radius of the b-sphere, thus, the fact that both shown distributions have similar width and maxima is a coincidence and has no physical meaning. The average time needed to diffuse between the binding pockets is in case of neamine of the order of 100 ns which leads to an average of 10 ns per base pair.
Figure 6.
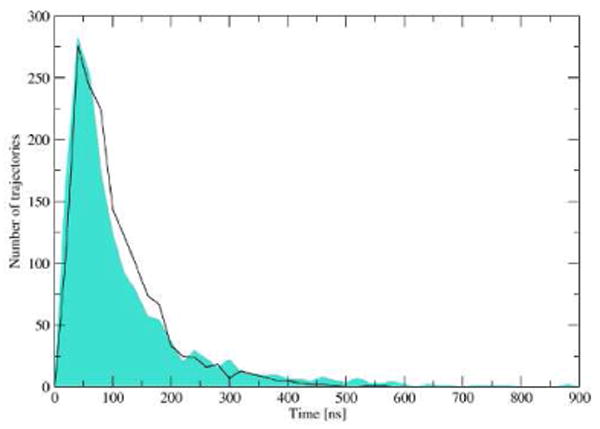
Black line: distribution of time intervals between subsequent antibiotic binding events in the two the A-sites, i.e, ligand diffusion time from one A-site to another. Cyan polygon: distribution of time intervals between the beginning of the BD trajectory (molecule positioned on the b-sphere) and the first binding event.
The behavior of ligands observed in BD trajectories suggests that binding of antibiotics to the A-site can be accomplished in two ways: the ligand either finds the binding site directly or, due to the highly negative potential of the RNA fragment, associates to any place on the oligonucleotide surface and then slides along the groove between backbone phosphate groups, in a manner of one-dimensional diffusion, until it finds the binding pocket. Such a model of association kinetics and its applications to a regulatory protein which finds its specific site on the DNA chain were previously described.69, 70 However, in our case, to properly test this hypothesis, BD simulations with a longer fragment of the RNA oligonucleotide are required.
Rates of association and their dependence on ionic strength
Rates of association and their dependence on ionic strength for the studied antibiotics are shown in Table 2 and Figure 7. All rate constants are of the same magnitude at all ionic strengths. Slower association (especially at ionic strengths above 50mM) is observed for paromomycin. Paromomycin can be compared to neomycin because their size and overall shape are similar what results in similar diffusion coefficients (Table 1). However, neomycin associates faster due to its higher net charge (+6e versus +5e for paromomycin) and stronger interaction with the RNA.
Table 2.
Association rate constants and their dependence on ionic strength derived from BD simulations.
| neamine | rate 1010 ± error 108 ribostamycin |
paromomycin | neomycin | |
|---|---|---|---|---|
| I[mM] | ||||
| 50.0 | 3.42 ± 5.61 | 3.36 ± 4.65 | 3.33 ± 4.78 | 3.43 ± 4.58 |
| 100.0 | 2.89 ± 5.74 | 2.96 ± 4.77 | 2.73 ± 4.81 | 2.90 ± 4.75 |
| 150.0 | 2.59 ± 5.60 | 2.63 ± 4.84 | 2.43 ± 4.82 | 2.61 ± 4.80 |
| 200.0 | 2.41 ± 5.57 | 2.45 ± 4.73 | 2.27 ± 4.80 | 2.46 ± 4.80 |
| 250.0 | 2.33 ± 5.53 | 2.30 ± 4.72 | 2.20 ± 4.79 | 2.29 ± 4.79 |
| 300.0 | 2.25 ± 5.52 | 2.17 ± 4.69 | 2.18 ± 4.77 | 2.26 ± 4.79 |
Figure 7.
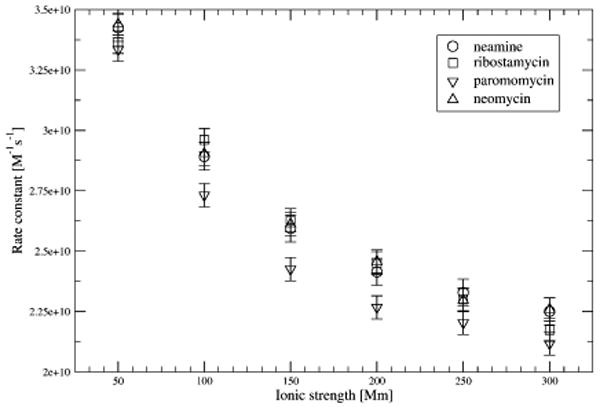
Ionic strength dependence of the association rates computed from BD simulations. Error values are estimated at the 90% confidence level.
Association rates for other ligand-protein and protein-protein systems have been measured in the range of 103 – 109 where in the upper limit association is enhanced by strong electrostatic interactions.71 For example, experimentally determined rate constants for positively charged ligands binding to acetylocholinesterase range up to 4 · 109 . 72 Therefore, our calculated rates seem reasonable even though, due to lack of experimental values, we do not focus our study on their absolute values but on relative ones and comparisons among various aminoglycosides.
For studied antibiotics the decrease in computed association rates upon change of ionic strength from 50 to 300mM is about 30%. This is a rather weak dependence in comparison with a ten-fold decrease observed experimentally for protein-protein association.73–77 Such weak dependence on ionic strength observed in our case results from the fact that a significant positive antibiotic net charge is accumulated and distributed in a rather small volume and all partial charges assigned to beads are positive. Proteins, on the other hand, are characterized by nonuniform charge distributions and often a dipolar character, hence provide stronger shielding of protein-protein electrostatic interactions by the solvated ionic charges and stronger dependence of protein-protein association on the ionic strength of the solution.
Because the studied RNA fragment possesses two antibiotic binding sites, we checked if occupying one of the A-sites influences the mechanism and rate of encounter of the other antibiotic. Therefore, for paromomycin, we also computed its rate of association with the RNA while one binding pocket was already occupied by another paromomycin. The second paromomycin diffused in the electrostatic potential generated by the RNA complexed with all-atom model of the other bound paromomycin. From the simulations conducted at ionic strength of 150mM, we obtained the rate constant equal to 1.16 · 1010 ± 3.42 · 108 . This number is nearly two times smaller than 2.43 · 1010 ± 4.82 · 108 presented in Table 2 for a naked oligonucleotide. This suggests that binding of one antibiotic does not influence the association rate constant of another one and there is no cooperativity in subsequent acts of binding of antibiotics to the oligonucleotide. Such a lack of cooperativity was also seen in the relative binding free energy calculations conducted in our earlier studies.12
To explain this result, we visualized and compared 1000 successful trajectories of paromomycin diffusing in the potential generated by the naked RNA fragment and of paromomycin diffusing in the potential generated by the RNA fragment with one of the A-sites permanently occupied by another paromomycin; potentials were generated at ionic strength of 150mM. Based on those trajectories we prepared density maps representing the preferred positions of the antibiotic near the RNA surface. These maps are presented in Figure 8. As expected, in case of the bare RNA, the shape of the constant density surface is identical near both A-sites, showing that negatively charged backbone phosphate groups attract positively charged ligand and strongly influence its diffusion. In the second case, placing the paromomycin in one of the binding pockets modifies the shape of the density map moving it away from the RNA surface close to the part already occupied by the bound paromomycin. However, the presence of one positively charged aminoglycoside in the binding site does not introduce substantial changes in the electrostatic potential generated by the RNA fragment which would be sufficient to expel another antibiotic from this region. Therefore, the diffusing molecule can be still initially directed toward the already occupied region. Previously published experimental work78 revealed by means of crystallography that binding of two aminoglycosides to one A-site of an RNA duplex is possible (with the second antibiotic molecule bound in various ways in the RNA groove at the edge of the A-site). Our results along with the above described effect of trapping of antibiotics inside the RNA groove seem to be in agreement with this observation.
Figure 8.
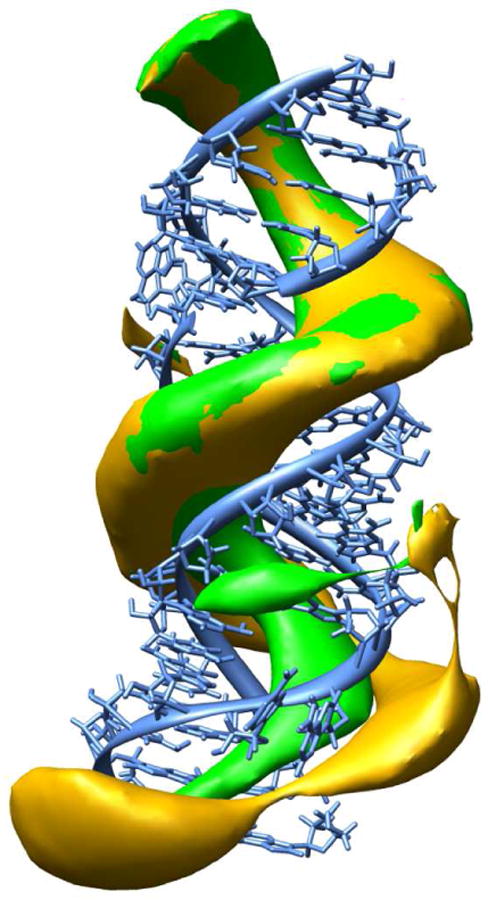
BD derived density maps of paromomycin molecules around the RNA fragment. Green: constant density surface generated when both binding pockets were empty; yellow: constant density surface when one binding pocket (lower half of the picture) was permanently occupied by the second antibiotic. Surfaces are constructed from points describing the positions of the geometric center of the ligand.
The role of magnesium ions
Figure 9 shows density maps representing the preferred positions of magnesium ions and antibiotics near the surface of the oligonucleotide. Maps were constructued based on BD trajectories of paromomycin and six Mg2+ ions diffusing simultaneously in the electrostatic potential generated by the empty RNA fragment. Figure 9 indicates that ions and antibiotics favour the same regions of space, i.e. both A-sites and the major groove of the RNA. Together with Coulombic interactions between positively charged antibiotics and positively charged Mg2+ ions this leads to competition of both species upon binding.
Figure 9.
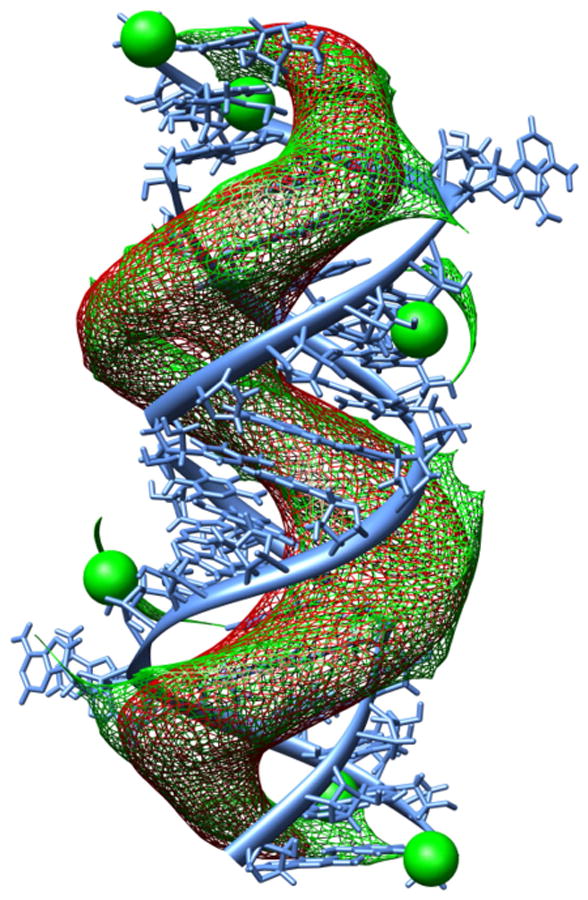
Density map representing the preferred positions of Mg2+ ions and paromomycin near the RNA fragment constructed based on BD simulations with mobile Mg2+ ions. Green: positions of Mg2+ ions (for comparison initial postions of ions are shown as spheres) Red: positions of antibiotic.
Figure 10 presents the dependence of paromomycin association rates on the reaction criteria for three types of simulations: without Mg2+ ions, with fixed positions of Mg2+ ions and with mobile Mg2+ ions. When magnesium ions are not present, no dependence of association rates on the used reaction criteria is observed. A similar result is obtained when the positions of Mg2+ ions are fixed during simulations but the computed association rate constant is lower (1.80 · 1010 ) than the one obtained from the simulation without ions (2.43 · 1010 ). Decrease in association probability is caused by a lower total charge of the RNA fragment (-28e with Mg2+ vs. -40e without Mg2+) and less attractive electrostatic potential influencing the movement of antibiotic.
Figure 10.
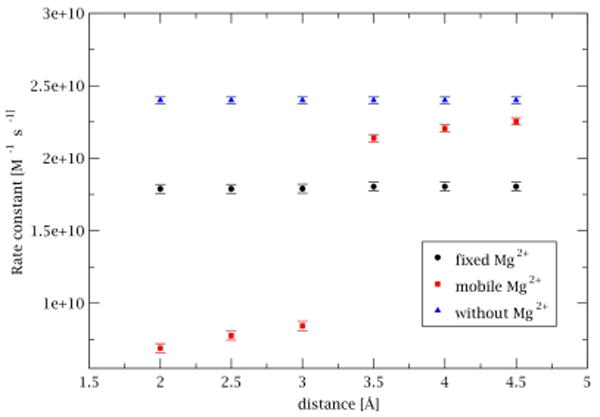
Dependence of association rate constant on the definition of the reaction distance based on the simulation of paromomycin at 150mM ionic strength and with different treatment of Mg2+ ions.
A different scheme is observed when magnesium ions are allowed to diffuse freely in solution. Association rate constants obtained for larger distances (less strict reaction criteria) are lower (2.13 – 2.25 · 1010 ) than the ones computed based on the simulations without ions but higher than those computed with fixed positions of ions. This is a result of electrostatic repulsion between ions and the antibiotic which are competing for the position inside the same A-site. When shorter reaction distances are taken into account there is an abrupt change in the computed rates which decrease to 6.90 · 109 . This arises from both an excluded volume effect (when the Mg2+ ions are bound inside the A-site there is not enough space to accommodate the antibiotic) and electrostatic repulsion between the antibiotic and ions (as the antibiotic needs to expel ions from the binding site in order to satisfy reaction criteria).
We observe that magnesium ions are able to diffuse away from the oligonucleotide. From the total of 6 Mg2+ initially positioned near the oligonucleotide, the maximal number of Mg2+ ions present near the RNA surface and competing with antibiotic was 4. Electrostatic interactions between ions and RNA are not strong enough to prevent ions' escape. However, one should bear in mind that forces between ions and RNA as implemented within the BD method lack the terms describing specific short-range interactions and during our simulations mobility of magnesium ions is probably overestimated.
Conclusions
We investigated the mechanism and kinetics of association of four aminoglycosides to the ribosomal A-site model using Brownian dynamics method. For the studied antibiotics, we established the order of association rates with the RNA fragment and calculated how these rates depend on ionic strength. The mechanism of one-dimensional diffusion of antibiotics near the RNA surface was also analyzed.
Association of antibiotics studied in this work is strongly electrostatically driven which results in large values of the computed association rates which are of the order of 1010 . Comparable rates are observed for neamine which is composed of two pseudo-sugar rings and bears a total charge of +4e, ribostamycin, which carries an equal total charge and whose structure differs from that of neamine by an additional ring, and composed of four rings neomycin (+6e). Smaller rates are obtained for paromomycin, composed of four rings and possessing similar to neomycin diffusion coefficient, but bearing lower than neomycin total charge (+5e). For all antibiotics a weak dependence of rates on the ionic strength is observed.
The applied BD methodology is not free of limitations and some of them were addressed in this study. First of all, the oligonucleotide and encounter complexes are represented with a single conformation. Also, the internal mobility of ligands is not explicitly taken into account. However, we chose the RNA configuration with two adenines flipped out of the binding bulge and “ready” for the incoming antibiotic to avoid steric restrictions for binding in the A-site. Treating flexibility of associating molecules explicitly would allow to describe the formation of the encounter complex in a more realistic way but may not necessarily influence the rates of association. Antibiotics are represented as sets of beads with partial charges assigned to their geometric centers - this is a simplified model which is not able to reproduce the effects arising from the distribution of partial charges and their possible influence on the observed kinetics of binding. We, however, distribute the net charge of each bead in a way which mimics the charge distribution of each aminoglycosidic ring. Effects of charge desolvation and their influence on the computed rates are also not taken into account in our simulations; these effects were studied for the case of protein-protein association with the application of effective charges model.79, 80 However, validity of this model is questionable in case of nonlinear Poisson-Boltzmann equation and it should be carefully examined before application to highly charged systems, such as the studied RNA fragment. On the other hand, a proper model to be used to generate the electrostatic potential in case of highly charged RNA should be the nonlinear Poisson-Boltzmann equation. Charge desolvation for RNA/DNA systems is an interesting problem itself but it was out of the scope of the present study. We were mostly interested in the relative order of association rates and the mechanism of association itself; therefore, we believe that despite the limitations the applied model serves well for this purpose and was able to give estimates of the association rates and explain the mechanism of aminoglycoside diffusion toward the RNA together with a possible role of Mg2+ ions.
The kinetics of the RNA oligonucleotide/antibiotic complex formation has not been studied previously neither with experimental nor computational methods and we were not able to validate or compare our results with those obtained with another method. However, we have shown the details of the association mechanism, e.g. sliding of antibiotics along the RNA, the role of cations upon association, which may become helpful for designing or narrowing a group of compounds targeting the bacterial ribosome.
Supplementary Material
Animations from BD trajectories showing two kinds of behaviour of aminoglycosides near the A-site oligonucleotide, i.e., sliding along the RNA groove between backbone phosphate groups and trapping inside the RNA groove, are available as supporting information. An animation showing interactions between mobile magnesium ions and paromomycin together with the displacement of Mg2+ ions upon binding of antibiotic in the A-site RNA is also provided. This information is available free of charge via the Internet at http://pubs.acs.org.
Acknowledgments
The authors acknowledge support from University of Warsaw (115/30/E-343/S-/2007/ICM BST 1255), Polish Ministry of Science and Higher Education (3 T11F 005 30, 2006-2008), Fogarty International Center (NIH Research Grant no R03 TW07318) and Foundation for Polish Science. M. D. wishes to thank dr. Razif Gabdoulline for helpful disscusion.
References
- 1.Walter F, Vincens Q, Westhof E. Curr Opin Chem Biol. 1999;3:694–704. doi: 10.1016/s1367-5931(99)00028-9. [DOI] [PubMed] [Google Scholar]
- 2.Davies J, Gorini L, Davis BD. Mol Pharmacol. 1965;1:93–106. [PubMed] [Google Scholar]
- 3.Moazed D, Noller HF. Nature. 1987;327:389–394. doi: 10.1038/327389a0. [DOI] [PubMed] [Google Scholar]
- 4.Karimi R, Ehrenberg M. Eur J Biochem. 1994;226:355–360. doi: 10.1111/j.1432-1033.1994.tb20059.x. [DOI] [PubMed] [Google Scholar]
- 5.Yoshizawa S, Fourmy D, Puglisi JD. Science. 1999;285:1722–1725. doi: 10.1126/science.285.5434.1722. [DOI] [PubMed] [Google Scholar]
- 6.Pape T, Wintermeyer W, Rodnina MV. Nat Struct Biol. 2000;7:104–107. doi: 10.1038/72364. [DOI] [PubMed] [Google Scholar]
- 7.Carter AP, Clemons MW, Brodersen DE, Morgan-Warren RJ, Wimberly BT, Ramakrishnan V. Nature. 2000;407:340–348. doi: 10.1038/35030019. [DOI] [PubMed] [Google Scholar]
- 8.Vicens Q, Westhof E. Chembiochem. 2003;4:1018–1023. doi: 10.1002/cbic.200300684. [DOI] [PubMed] [Google Scholar]
- 9.Kaul M, Barbieri CM, Kerrigan JE, Pilch DS. J Mol Biol. 2003;326:1373–1387. doi: 10.1016/s0022-2836(02)01452-3. [DOI] [PubMed] [Google Scholar]
- 10.Wang H, Tor Y. J Am Chem Soc. 1997;119:8734–8735. [Google Scholar]
- 11.Hermann T, Westhof E. J Med Chem. 1999;42:1250–1261. doi: 10.1021/jm981108g. [DOI] [PubMed] [Google Scholar]
- 12.Yang G, Trylska J, Tor Y, McCammon JA. J Med Chem. 2006;49:5478–5490. doi: 10.1021/jm060288o. [DOI] [PubMed] [Google Scholar]
- 13.Purohit P, Stern S. Nature. 1994;370:659–662. doi: 10.1038/370659a0. [DOI] [PubMed] [Google Scholar]
- 14.Miyaguchi H, Narita H, Sakamoto K, Yokoyama S. Nucl Acids Res. 1996;24:3700–3706. doi: 10.1093/nar/24.19.3700. [DOI] [PMC free article] [PubMed] [Google Scholar]
- 15.Recht MI, Fourmy D, Blanchard SC, Dahlquist KD, Puglisi JD. J Mol Biol. 1996;262:421–436. doi: 10.1006/jmbi.1996.0526. [DOI] [PubMed] [Google Scholar]
- 16.Blanchard SC, Fourmy D, Eason RG, Puglisi JD. Biochemistry. 1998;37:7716–7724. doi: 10.1021/bi973125y. [DOI] [PubMed] [Google Scholar]
- 17.Vicens Q, Westhof E. Structure. 2001;9:647–658. doi: 10.1016/s0969-2126(01)00629-3. [DOI] [PubMed] [Google Scholar]
- 18.Vicens Q, Westhof E. Chem Biol. 2002;9:747–755. doi: 10.1016/s1074-5521(02)00153-9. [DOI] [PubMed] [Google Scholar]
- 19.Vicens Q, Westhof E. J Mol Biol. 2003;326:1175–1188. doi: 10.1016/s0022-2836(02)01435-3. [DOI] [PubMed] [Google Scholar]
- 20.Ogle JM, Murphy FV, Tarry MJ, Ramakrishnan V. Cell. 2002;111:721–732. doi: 10.1016/s0092-8674(02)01086-3. [DOI] [PubMed] [Google Scholar]
- 21.Ogle JM, Carter AP, Ramakrishnan V. Trends Biochem Sci. 2003;28:259–266. doi: 10.1016/S0968-0004(03)00066-5. [DOI] [PubMed] [Google Scholar]
- 22.Ogle JM, Brodersen DE, Clemons WM, Jr, Tarry MJ, Carter AP, Ramakrishnan V. Science. 2001;292:897–902. doi: 10.1126/science.1060612. [DOI] [PubMed] [Google Scholar]
- 23.Kaul M. J Am Chem Soc. 2004;126:3447–3453. doi: 10.1021/ja030568i. [DOI] [PubMed] [Google Scholar]
- 24.Shandrick S, Zhao Q, Han Q, Ayida BK, Takahashi M, Winters GC, Simonsen KB, Vourloumis D, Hermann T. Angew Chem Int Ed Engl. 2004;43:3177–3182. doi: 10.1002/anie.200454217. [DOI] [PubMed] [Google Scholar]
- 25.Griffey RH, Hofstadler SA, Sannes-Lowery KA, Ecker DJ, Crooke ST. Proc Natl Sci USA. 1999;96:10129–10133. doi: 10.1073/pnas.96.18.10129. [DOI] [PMC free article] [PubMed] [Google Scholar]
- 26.Sucheck SJ, Wong AL, Koeller KM, Boehr DD, Draker K, Sears P, Wright GD, Wong CH. J Am Chem Soc. 2000;122:5230–5231. [Google Scholar]
- 27.Ryu DH, Rando RR. Bioorg Med Chem. 2001;9:2601–2608. doi: 10.1016/s0968-0896(01)00034-7. [DOI] [PubMed] [Google Scholar]
- 28.Wong CH, Hendrix M, Priestley ES, Greenberg WA. Chem Biol. 1998;5:397–406. doi: 10.1016/s1074-5521(98)90073-4. [DOI] [PubMed] [Google Scholar]
- 29.Pilch DS, Kaul M, Barbieri CM, Kerrigan JE. Biopolymers. 2003;70:58–79. doi: 10.1002/bip.10411. [DOI] [PubMed] [Google Scholar]
- 30.Pfister P, Hobbie S, Brull C, Corti N, Vassela A, Westhof E, Bottger EC. J Mol Biol. 2005;346:467–475. doi: 10.1016/j.jmb.2004.11.073. [DOI] [PubMed] [Google Scholar]
- 31.Vaiana AC, Westhof E, Auffinger P. Biochimie. 2006;88:1061–1073. doi: 10.1016/j.biochi.2006.06.006. [DOI] [PubMed] [Google Scholar]
- 32.Ermak DL, McCammon JA. J Chem Phys. 1978;69:1352–1360. [Google Scholar]
- 33.Wade RC, Gabdoulline RR. Methods. 1998;3:329–341. doi: 10.1006/meth.1998.0588. [DOI] [PubMed] [Google Scholar]
- 34.Beard D, Schlick T. J Chem Phys. 2000;112:7313–7322. [Google Scholar]
- 35.Tan RC, Truong TT, McCammon JA, Sussman JL. Biochemistry. 1993;32:401–403. doi: 10.1021/bi00053a003. [DOI] [PubMed] [Google Scholar]
- 36.Wade RC, Gabdoulline RR, Lüdemann SK, Lounnas V. Proc Natl Sci USA. 2007;95:5942–5949. doi: 10.1073/pnas.95.11.5942. [DOI] [PMC free article] [PubMed] [Google Scholar]
- 37.Gabdoulline RR, Wade RC. Biophys J. 1997;72:1917–1929. doi: 10.1016/S0006-3495(97)78838-6. [DOI] [PMC free article] [PubMed] [Google Scholar]
- 38.Speer A, Dammer Ch, Gabdoulline RR, Wade RC. Biophys J. 2006;90:1913–1924. doi: 10.1529/biophysj.105.075507. [DOI] [PMC free article] [PubMed] [Google Scholar]
- 39.Das A, Jayaram B. J Mol Liquids. 1998;77:157–163. [Google Scholar]
- 40.Gilson MK, Honig B. PROTEINS: Struct, Funct, Genet. 1988;4:7–18. doi: 10.1002/prot.340040104. [DOI] [PubMed] [Google Scholar]
- 41.Zhou H. J Chem Phys. 1994;100:3152–3162. [Google Scholar]
- 42.Northrup SH, Hynes JT. J Chem Phys. 1979;71:871–883. [Google Scholar]
- 43.Northrup SH, Allison SA, McCammon JA. J Chem Phys. 1984;80:1517–1524. [Google Scholar]
- 44.Einstein A. Ann Phys (Leipzig) 1905;17:549–560. [Google Scholar]
- 45.Smoluchowski MV. Ann Phys (Leipzig) 1906;21:756–760. [Google Scholar]
- 46.Madura JD, Davis ME, Gilson MK, Wade RC, Luty BA, Mc-Cammon JA. Biological applications of electrostatic calculations and Brownian dynamics simulations. In: Lipkowitz KB, Boyd DB, editors. Reviews in Computational Chemistry. Vol. 5. VCH Publishers; New York, NY: 1994. pp. 229–267. [Google Scholar]
- 47.Antosiewicz J, McCammon JA, Gilson MK. Biochemistry. 1996;35:7819–7833. doi: 10.1021/bi9601565. [DOI] [PubMed] [Google Scholar]
- 48.van Vlijmen HHT, Schaefer M, Karplus M. Proteins: Struct, Func, Genet. 1998;33:145–148. doi: 10.1002/(sici)1097-0134(19981101)33:2<145::aid-prot1>3.0.co;2-i. [DOI] [PubMed] [Google Scholar]
- 49.Antosiewicz J, McCammon JA, Gilson MK. J Mol Biol. 1994;238:415–436. doi: 10.1006/jmbi.1994.1301. [DOI] [PubMed] [Google Scholar]
- 50.You TJ, Bashford D. Biophys J. 1995;69:1721–1733. doi: 10.1016/S0006-3495(95)80042-1. [DOI] [PMC free article] [PubMed] [Google Scholar]
- 51.Nicholls A, Honig B. J Comput Chem. 1991;12:435–445. [Google Scholar]
- 52.Holst M, Baker N, Wang E. J Comput Chem. 2000;21:1319–1342. [Google Scholar]
- 53.Davis ME, Madura JD, Luty BA, McCammon JA. Comp Phys Commun. 1991;62:187–197. [Google Scholar]
- 54.Smoluchowski MV. Phys Z. 1916;17:557–571. [Google Scholar]
- 55.Pyle AM. J Biol Inorg Chem. 2002;7:679–690. doi: 10.1007/s00775-002-0387-6. [DOI] [PubMed] [Google Scholar]
- 56.DeRose VJ. Curr Opin Struct Biol. 2003;13:317–324. doi: 10.1016/s0959-440x(03)00077-0. [DOI] [PubMed] [Google Scholar]
- 57.Draper DE. RNA. 2004;10:335–343. doi: 10.1261/rna.5205404. [DOI] [PMC free article] [PubMed] [Google Scholar]
- 58.Hermann T, Westhof E. J Mol Biol. 1998;276:903–912. doi: 10.1006/jmbi.1997.1590. [DOI] [PubMed] [Google Scholar]
- 59.Cornell WD, Cieplak P, Bayly CI, Gould IR, Merz KMJ, Ferguson DM, Spellmayer DC, Fox T, Caldwell JW, Kollman PA. J Am Chem Soc. 1995;117:5179–5197. [Google Scholar]
- 60.Insight II, version 2000. Accelrys; San Diego, CA: 2000. [Google Scholar]
- 61.Jakalian A, Busch BL, Jack DB, Bayly CI. J Comput Chem. 2000;21:132–146. [Google Scholar]
- 62.Barbieri CM, Srinivasan AR, Pilch DS. J Am Chem Soc. 2004;126:14380–14388. doi: 10.1021/ja0457516. [DOI] [PubMed] [Google Scholar]
- 63.Carrasco B, de la Torre JG. Biophys J. 1999;76:3044–3057. doi: 10.1016/S0006-3495(99)77457-6. [DOI] [PMC free article] [PubMed] [Google Scholar]
- 64.de la Torre JG. Biophys Chem. 2001;94:265–274. doi: 10.1016/s0301-4622(01)00244-7. [DOI] [PubMed] [Google Scholar]
- 65.de Graaf RA, van Kranenburg A, Nicolay K. Biophys J. 2000;78:1657–1664. doi: 10.1016/S0006-3495(00)76717-8. [DOI] [PMC free article] [PubMed] [Google Scholar]
- 66.Antosiewicz J. Biophys J. 1995;69:1344–1354. doi: 10.1016/S0006-3495(95)80001-9. [DOI] [PMC free article] [PubMed] [Google Scholar]
- 67.Richards FM. Ann Rev Biophys Bioeng. 1977;6:151–176. doi: 10.1146/annurev.bb.06.060177.001055. [DOI] [PubMed] [Google Scholar]
- 68.Gilson MK, Sharp KA, Honig BH. J Comput Chem. 1988;9:327–335. [Google Scholar]
- 69.Berg OG, Blomberg C. Biophys Chem. 1977;4:367–381. doi: 10.1016/0301-4622(76)80017-8. [DOI] [PubMed] [Google Scholar]
- 70.Berg OG, Blomberg C. Biophys Chem. 1977;7:33–39. doi: 10.1016/0301-4622(77)87012-9. [DOI] [PubMed] [Google Scholar]
- 71.Sheinerman SH, Norel R, Honig B. Curr Opin Struct Biol. 2000;10:153–159. doi: 10.1016/s0959-440x(00)00065-8. [DOI] [PubMed] [Google Scholar]
- 72.Quinn PM. Chem Rev. 1987;87:955–979. [Google Scholar]
- 73.Schreiber G, Fersht AR. Biochemistry. 1993;32:5145–5150. doi: 10.1021/bi00070a025. [DOI] [PubMed] [Google Scholar]
- 74.Escobar L, Root MJ, MacKinnon R. Biochemstry. 1993;32:6982–6987. doi: 10.1021/bi00078a024. [DOI] [PubMed] [Google Scholar]
- 75.Wallis R, Moore GR, James R, Kleanthous C. Biochemistry. 1995;34:13743–13750. doi: 10.1021/bi00042a004. [DOI] [PubMed] [Google Scholar]
- 76.Wendt H, Leder L, Harma H, Jelesarov I, Baici A, Bosshard HR. Biochemistry. 1997;36:204–213. doi: 10.1021/bi961672y. [DOI] [PubMed] [Google Scholar]
- 77.Radic Z, Kirchhoff PD, Quinn DM, McCammon JA, Taylor P. J Biol Chem. 1997;272:23265–23277. doi: 10.1074/jbc.272.37.23265. [DOI] [PubMed] [Google Scholar]
- 78.François B, Russel RJM, Murray JB, Aboul-ela F, Masquida B, Vicens Q, Westhof E. Nucl Acid Res. 2005;33:5677–5690. doi: 10.1093/nar/gki862. [DOI] [PMC free article] [PubMed] [Google Scholar]
- 79.Gabdoulline RR, Wade RC. J Phys Chem. 1996;100:3868–3878. [Google Scholar]
- 80.Gabdoulline RR, Wade RC. J Mol Biol. 2001;306:1139–1155. doi: 10.1006/jmbi.2000.4404. [DOI] [PubMed] [Google Scholar]
Associated Data
This section collects any data citations, data availability statements, or supplementary materials included in this article.
Supplementary Materials
Animations from BD trajectories showing two kinds of behaviour of aminoglycosides near the A-site oligonucleotide, i.e., sliding along the RNA groove between backbone phosphate groups and trapping inside the RNA groove, are available as supporting information. An animation showing interactions between mobile magnesium ions and paromomycin together with the displacement of Mg2+ ions upon binding of antibiotic in the A-site RNA is also provided. This information is available free of charge via the Internet at http://pubs.acs.org.