

Abstract
Diabetes is widely believed to predispose to serious infections. However, the mechanisms linking diabetes and immunosuppression are not well defined. One potential mediator of the altered defence mechanisms is hyperglycaemia. It has been identified as the main factor contributing to the development of diseases associated with diabetes mellitus. In this study we analyse the immune response in diabetes and the direct effect of hyperglycaemia on T and B lymphocyte reactivity. Diabetes induced an early decrease in IgG levels in the secondary response. However, both primary responses against a T-cell-dependent or independent antigen were affected after 6 months of diabetes induction. T- and B- cell proliferation was only decreased at this time. To gain insight into the potential mechanisms involved, we evaluated the influence of hyperglycaemia over the immune response. Pre-incubation of lymph node and spleen cells in a high glucose (HG) containing medium led to a significant time- and dose-dependent decrease in T- and B-cell proliferation. This effect was associated with the presence of HG-derived supernatants. Still viable cells after HG exposition were able to improve their proliferative response when cultured with the mitogen in a fresh standard medium. HG diminished cell viability, increased apoptosis and induced oxidative stress in lymphocytes. These results indicate that HG concentrations can directly affect lymphoid cell growth. An increase in oxidative stress would be implicated in this deleterious effect. The possibility that prolonged exposure to pathologically HG concentrations would result in the immunosuppressive state observed in diabetes is also discussed.
Keywords: diabetes, high glucose, immune response, oxidative stress, T and B lymphocyte proliferation
Introduction
Diabetes is widely believed to predispose to serious infections. Experimental clinical literature supports an association between diabetes and infection [1–4]. Individuals with diabetes might be at a higher risk of moderate or severe infection-related morbidity caused by altered defence mechanisms. It was shown that individuals with diabetes have poorer outcomes after infection and increased incidence of nosocomial infection compared with normal subjects [1,2,5]. However, the mechanisms linking diabetes and immunosuppression are not well defined.
One potential mediator of the altered defence mechanisms is hyperglycaemia [6]. Hyperglycaemia has been identified as the main factor contributing to the development of diseases associated with diabetes mellitus. The 1993 and 2005 Diabetes Control and Complications Trials and the UK Prospective Diabetes Study [7–9] provided compelling evidence that intensive treatment of people with insulin-dependent diabetes mellitus can delay the onset and slow the progression of diabetic retinopathy, nephropathy, neuropathy, and micro- and macrovascular complications, or prevent diabetic cardiovascular disease. Although it is difficult to prove a similar causal relation between hyperglycaemia and infection, there are substantial clinical data supporting this hypothesis [6]. Moreover, uncontrolled hyperglycaemia may be associated with increased risk of nosocomial infections in critically affected patients, even in those without a history of diabetes [10–13].
Various pathophysiological and biochemical mechanisms have been proposed to explain the adverse effects of hyperglycaemia. In recent years, an increasing number of reports have shown that enhanced oxidative stress is a key factor in the development of abnormalities in diabetes [14,15]. Reactive oxygen species (ROS) are by-products of normal metabolic processes in the cell. At low concentrations, they are thought to have some physiological roles [16,17], including the activation and proliferation of lymphocytes [18]. However, at high concentrations they lead to oxidative stress and cause damage to cellular components [17]. ROS can function as signalling molecules to activate a number of cellular stress-sensitive pathways that cause cellular damage and they are proposed to be responsible for the late complications of diabetes [19]. Hyperglycaemia not only generates ROS, but also attenuates antioxidant mechanisms, creating a state of oxidative stress [20–24]. Enhanced oxidative stress is proposed to be a major cause of diabetic endothelial dysfunctions [25,26], nephropathy [27,28] and neuropathy [21]. Concerning lymphocyte function, it has been suggested that oxidative stress may play an important pathogenic role in the development of immunodeficiency [29–31].
The aim of the present study was to analyse the effect of diabetes on the generation of an in vivo antibody response. For this purpose, a type I diabetes model was obtained by treating BALB/cByJ mice with multiple doses of streptozotocin (STZ), which allow a chronic stable mild hyperglycaemia without insulin therapy. Moreover, the direct effect of hyperglycaemia in T and B lymphocyte reactivity was also evaluated.
Materials and methods
Animals
Inbred female BALB/cByJ mice were purchased from the Instituto Nacional de Tecnología Agropecuaria. They were used between 60 and 90 days of age and were housed on a 12-h light/dark cycle under controlled temperatures (18–22°C). Animals were handled and sacrificed according to the Institutional Committee for Use and Care of Laboratory Animals (CICUAL, School of Medicine, University of Buenos Aires, Argentina), following the Guide for the Care and Use of Laboratory Animals.
Experimental diabetes
To induce the diabetic state, 1 daily dose of STZ (Sigma Chemical Co., St Louis, MO, USA) (40 mg/kg in citrate buffer, pH = 4·5) was administered intraperitoneally (i.p.) to the mice [32] during 5 consecutive days. Blood glucose measurements were performed with a One Touch Ultra test strips glucometer (Lifescan, Johnson-Johnson Co., Milpitas, CA, USA) in blood samples from mice tail punctures, before 15 days after STZ treatment (with a frequency of once a week) and at the end of each experiment. Mean plasma glucose levels were 83 ± 7 and 183 ± 33 mg/dl before and after treatment, respectively, remaining at this level throughout the experiments. Mice injected with the vehicle at the same time were used as the respective controls (normal mice).
Immunizations
Sheep red blood cells (SRBC) were used as an immunogen to evaluate T-cell-dependent humoral response and lipopolysaccharide (LPS) (Sigma Chemical Co.) was used to determinate T-cell-independent humoral response. For SRBC response, mice were i.p. immunized on day 0 and boosted on day 11 with 0·2 ml of 2·5 % SBRC (8 ml/kg) in saline. Blood samples were collected for antibody determination on day 10 (primary response) and on day 18 (secondary response). For LPS, each mouse received an i.p. injection of 10 µg LPS (400 µg/kg) in 0·1 ml saline and blood samples were collected on day 10. Mice injected with vehicles were used as controls.
Antibody titres
Serum obtained from retroorbital blood samples was stored at −20°C until assayed. Quantitative enzyme-linked immunosorbent assay (ELISA) was performed to determine SRBC-specific and LPS-specific antibodies as previously described [33]. Briefly, 96-well plates (Maxisorp immunoplates, Nunc) were coated overnight with SRBC membranes (10 µg/ml) or LPS (2 µg/ml). After blockade of unspecific sites with buffer containing 1% albumin, dilutions of sera were added and incubated for 2 h at room temperature. Plates were then washed and samples were incubated with a goat IgG anti-mouse IgM or IgG phosphatase alkaline conjugated (Sigma Chemical Co. ) and p-nitrophenylphosphate (Sigma Chemical Co., St. Louis, MO, USA) as substrate for developing coloration that was read at 405 nm. Reactions were considered positive when optical density values were above the mean value plus 2 s.d. of normal sera (sera from non-immunized and/or vehicle-injected mice that gave non-statistical differences among them).
Cell suspensions and culture conditions
Lymphoid cell suspensions from lymph nodes or spleens were obtained as described previously [34]. The cell culture medium used was RPMI 1640 (Gibco™, Invitrogen, Carlsbad, USA) containing 0·2 g% glucose (Sigma Chemical Co.). Briefly, lymphoid organs were aseptically removed and disrupted through a 1-mm metal mesh and the resulting cell suspensions were filtered through a 10-µm nylon mesh. After three washes in RPMI 1640 medium, cells were resuspended in RPMI 1640 supplemented with 10% of batched-tested non-stimulatory foetal bovine serum (Gibco™), 2 mM glutamine (Gibco™,), 100 U/ml penicillin (Gibco™), and 100 µg/ml streptomycin (Gibco™). When high concentrations of sugars were used, glucose or mannitol (Sigma Chemical Co.) (40 and 15 g% stock solution, respectively) were added directly to the medium in the cell culture dish to yield the final concentrations of sugars expressed for each experiment. Where indicated, pre-incubations of cells (3 × 10⁶ cell/ml) with sugars were performed, followed by the cell culture conditions described above.
Preparation of high glucose supernatants
Lymphoid cell suspensions from lymph nodes or spleens (3 × 10⁶ cell/ml) were cultured in RPMI 1640 in the absence (0·2 g%) or presence of high concentrations of glucose (0·5, 1 and 2 g%). After 24 h incubation, cultures were centrifuged at 200 × g for 15 min, cell free supernatants were obtained and their effects on freshly obtained lymph nodes or spleen cells were assayed.
Assessment of cell viability
Cell viability was estimated according to the trypan blue (Sigma Chemical Co.) exclusion criteria. The number of viable cells was determined by counting in duplicate the trypan blue negative (viable) and positive (dead) cells in a Neubauer chamber under a light microscope. In each case, at least 200 cells were counted. Normally, freshly obtained cell viability was higher than 95%. Percentage of survival rate refers to the percentage of viable cells relative to the total number plated.
Mitogen assay
Cells (1·5 × 106 cells/ml) were settled at a final volume of 0·2 ml in 96-well flat-bottom microtitre plates (Nunc™) in triplicate aliquots. The T-cell-selective mitogen Concanavalin A (Con A) (Sigma Chemical Co.) and the mitogen selective for B cells, LPS were used. Mitogens were added to the microcultures and dose response curves were performed to determine optimal mitogen concentrations. Cells were cultured at 37°C in a 5% CO2 atmosphere for different periods. Cells stimulated with the mitogens displayed the expected kinetic of proliferation with a peak on day 3 of culture [35]. Proliferation was measured by adding 0·75 µCi [3H]-thymidine ([3H]TdR, Perkin Elmer precisely, Boston, MA, USA, 20 Ci/mmol) for the last 18-h period of culture. Thymidine incorporation was measured by scintillation counting after retention over GF/C glass-fiber filters (Whatman Internationational Ltd, Maidstone, UK) of the acid-insoluble macromolecular fraction. The mean of triplicate determinations was calculated for each lectin concentration. The dpm in basal cultures was subtracted from dpm in stimulated cultures. To analyse the influence of high glucose concentrations on the proliferative response, pre-incubations were carried out at different times and glucose or mannitol concentrations. After these periods cell viability was determined and T- and B-cell mitogen stimulation was performed as described above.
Detection of lymphocyte apoptosis
Apoptosis was studied by labelling DNA and analysing chromatin morphology with a fluorescence microscope or by measuring subdiploid DNA content by flow cytometric analysis. Lymph node and spleen cells were harvested after 24 h incubation (200× g 15 min), washed with PBS and counted. For fluorescence microscope examination, cells were fixed with ethanol and labelled with Hoechst 33258 (0·5 mg/ml) (Sigma Chemical Co.) for 10 min according to the manufacturer's instructions. After three washes with PBS, nuclear morphology was observed under a fluorescent microscope (Olympus IMT2). Nuclei showing chomatin condensation or fragmentation were considered apoptotic. For every treatment, 200 nuclei from random microscopic fields were counted by a double-blinded observer.
For flow cytometric analysis, a modification of the Nicoletti method was used [36]. Lymph node and spleen cells were harvested by centrifugation, washed and then fixed overnight with cold 70% ethanol. After washing twice with 0·2 M phosphate buffer containing 0·1 M citric acid (pH 7·8), the cells were then stained in the dark for 30 min at room temperature with propidium iodide (PI) (Sigma Chemical Co. ) staining solution (50 µg/ml of PI in 0·1% Na-citrate, 0·1% Triton X-100, 50 µg/ml RNAase A) and analysed by flow cytometry using a FACScan flow cytometer (Becton Dickinson) with log amplification and FACScan research software. For each sample 10 000 cells were acquired and analysed using the WinMDI 2·9 program. Apoptotic nuclei appeared as a broad hypodiploid DNA peak that was easily distinguishable from the narrow peak of normal (diploid) DNA content [37].
Glucose incorporation to macromolecules
RPMI 1640 standard medium alone or with increasing concentrations of glucose was incubated at 37°C in the presence of 14C-glucose (Perkin Elmer precisely; 303 mCi/mmol), to obtain a specific activity of 10 µCi/g glucose. After 24 h incubation in the presence or absence of lymphocytes (3 × 10⁶ cells/ml), supernatants were removed and macromolecules were precipitated with 10% of cold trichloroacetric acid and filtered through Whatman GF/C glass fibre filters (Whatman Internationational Ltd). The filters were washed three times with ice-cold solution of 10 mM glucose in PBS, pH 7·4, dried and transferred to counting vials. Radioactivity was measured by liquid scintillation counting.
Measurement of intracellular ROS generation
The ROS produced within lymphocytes were detected with the membrane-permeant probe 2′,7′-dichlorofluorescein diacetate (DCFH-DA). The probe freely enters the cell, is incorporated into hydrophobic regions and the acetate moiety is cleaved off by cellular esterases leaving a non-fluorescent and impermeant form of DCFH [38]. ROS produced by the cell oxidize DCFH to DCF, which after excitation emits fluorescence. The lymphocytes (1 × 10⁶ cells) were incubated in the dark with 5 µM DCFH-DA (Sigma Chemical Co.) for 15 min at 37°C. Cells were then washed twice with PBS, harvested in PBS 0·5% Triton X-100, centrifuged at 12 000× g for 10 min and the supernatant was collected. The intensity of dichlorofluorescein (DCF) fluorescence in the supernatant was measured with an excitation wavelength of 488 nm, and an emission wavelength of 530 nm (Hitachi F2000 Fluorescence Spectrophotometer, Tokyo, Japan). Intracellular ROS production was calculated from a DCF standard curve (1–40 nmol/ml).
Colorimetric assay for lipid peroxidation
As marker for lipid peroxidation, malondialdehyde (MDA), formed by the breakdown of polyunsaturated fatty acids, was determined [39]. MDA has been identified as the main product that reacts with thiobarbituric acid (TBA) to give red species absorbing at 535 nm (TBARS). After treatments, lymph node and spleen lymphocytes (1 × 10⁷ cells) were centrifuged for 15 min at 200 g, and the pellets were resuspended and incubated with 15% trichloroacetic acid, 0·375% TBA (Sigma Chemical Co.), and 0·25 N hydrochloric acid. The samples were heated for 15 min in a boiling water bath. After cooling, the flocculent precipitate was removed by centrifugation and the absorbance in the supernatant was determined at 535 nm. A standard plot for MDA was prepared using 1,1,3,3-tetraetoxypropane (Sigma Chemical Co.).
Statistical analysis
The Student's t-test for unpaired values was used to determine the levels of significance. When multiple comparisons were necessary after anova, the Student-Newman-Keuls test was applied. Antibody production data were not normally distributed, so the non-parametric statistic Kruskal–Wallis test was performed, and post hoc analysis was carried out using the Dunn's multiple comparison test. Differences between means were considered significant if P < 0·05.
Results
Antibody response to T-cell dependent and independent antigens
To investigate if changes in the humoral response are present in diabetic mice we examined the antibody production after immunization with SRBC, a thymus-dependent antigen, and LPS, a thymus-independent antigen in animals at different times after diabetes induction. To analyse the primary response, specific antibody titres of the IgM and IgG type were evaluated by ELISA at day 10 after immunization. We found that titres of anti-SRBC IgM and IgG were not significantly different between control and diabetic animals after 1–3 months, but a significant decrease was observed after 6 months of diabetic induction (Fig. 1a and b). In contrast, during the secondary response, on day 18 after the first immunization and one booster injection, titres of anti-SRBC IgG were lower in animals with diabetes compared with the control at all times tested, reaching significant differences after 1 month of diabetes induction. (Fig. 1c). When we evaluated the humoral response after LPS challenge, significant decreases in the anti-LPS IgM titres were found after 6 months of diabetes induction. (Fig. 1d). It is important to note that this humoral response in control animals was similar at all times tested (from 15 days to 6 months after diabetes induction, data not shown).
Fig. 1.
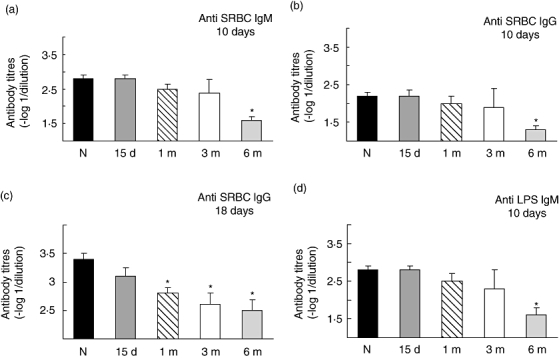
Antibody titres following SRBC and LPS immunizaton in normal and diabetic mice. Normal and 15 days, 1, 3 and 6 month STZ treated mice were immunized with SRBC, 2.5% in saline (a and b) and boosted on day 11 with 2.5% of SRBC in saline (c) or immunized with LPS (10µg in saline) (d). Serum was collected on day 10 (a, b and d) or on day 18 (c) and assayed for the presence of IgM (a and d) or IgG (b and c) by ELISA. Data shown represent the mean ± s.e.m. of eight experiments performed by duplicate. Each experiment was performed with one or two sera of each experimental condition. *P < 0.01 with respect to control value.
Lymphocyte reactivity to T-cell and B-cell mitogen
To investigate if in vivo antibody production is correlated with in vitro lymphocyte reactivity we evaluated the mitogen-induced T and B cell proliferation. Due to the well-known lymphoid profile, cell suspension from lymph nodes was used for the T-selective mitogen Con A stimulation while spleen lymphocyte suspensions were used for evaluating LPS (B-cell selective) mitogen effect. The maximal proliferation was reached at 2 µg/ml for Con A and 25 µg/ml of LPS for both control and diabetic mice at all times tested (data not shown). However, the maximal mitogen-induced lymphocyte proliferation was altered in diabetic animals after 6 months of diabetes induction. As can be seen in Fig. 2, both Con A-induced T cell and LPS-induced B cell proliferation was 58 ± 9% and 52 ± 10% lower than the maximal proliferation obtained for control mice, respectively.
Fig. 2.
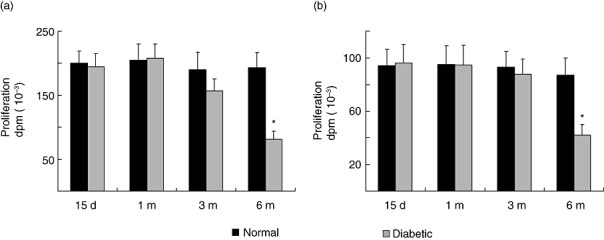
Mitogen-induced proliferative response in normal and diabetic mice. Lymphocytes (3 × 10⁶ cells/ml) from normal or STZ treated mice after different times (15 days, 1, 3 and 6 month) were stimulated with optimal mitogen concentration of Con A (2 µg/ml, a) and LPS (25 µg/ml, b). Results shown are the mean ± s.e.m. of six independent experiments performed in triplicate. *P < 0.01 with respect to the control values.
Effect of high glucose on lymphocyte proliferation
In order to gain insight into the potential mechanisms involved in this alteration we evaluated the influence of hyperglycaemia on the immune response. Lymph node and spleen lymphocytes isolated from normal BALB/c mice were exposed to various test media containing increasing concentrations of glucose for 0, 6 or 24 h. After these treatments, similar amounts of viable lymph node and spleen cells were stimulated with T and B selective mitogens, respectively. To maintain the exact pre-incubation conditions with different concentrations of glucose, cells were centrifuged and the medium was saved to resuspend at the concentration of 1·5 × 106 viable cells/ml. Exposure of T- and B-cells to high glucose concentrations induced a time- and concentration-dependent decrease in cell proliferation (Fig. 3a and b). Thus, after 24 h culture with 1 g% glucose, T- and B-cell proliferation was significantly reduced to 40·3 ± 2·5% and 45·6 ± 3·6%, respectively. However, no reduction in lymphocyte proliferation was observed when high glucose was added simultaneously with the mitogens, suggesting that a time-dependent interaction between the medium and the cells is needed. Unlike D-glucose, 1 g% mannitol did not significantly inhibit T- and B-cell proliferation when compared with control (Table 1); this suggests that high glucose-induced decrease in lymph proliferation is not just the result of high osmolarity. However, if after washing, viable cells from high glucose pre-incubation were incubated withstandard fresh medium containing 0·2 g% of glucose, a significant reversion from the inhibitory effect was found. Figure 3 (c and d) shows that both T- and B-cell proliferation from cells previously incubated in high glucose increases significantly following removal of the excess glucose, allowing the cells to recover their normal reactivity. Moreover, if fresh lymphocytes from control mice were incubated in supernatants from high glucose treated cells, an important decrease of cell division was observed (Fig. 3c and d). As it is very well known that the advanced glycation end-products (AGEs) have key roles in the pathogenesis of diabetic complications [40] and that lymphocytes have receptors for AGEs [41,42], we studied the glycosilated products formation. For this purpose the 14C-glucose incorporation into macromolecules was analysed. Figure 4 shows a concentration-response increase in the presence of glycosilated products in the supernatants from treated cells with high glucose concentrations.
Fig. 3.
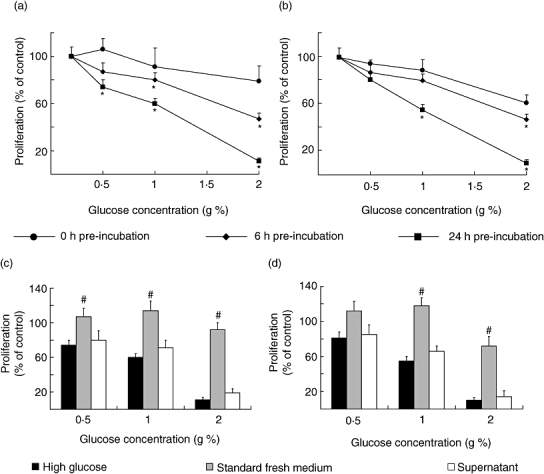
Effect of high glucose on mitogen-induced normal T- and B-cell proliferative responses. Lymphocytes (3 × 10⁶ cells/ml) were treated during 0 (•), 6 (▴) or 24 (▪) hours in RPMI 1640 without (control, standard medium, 0.2 g% of glucose) or with the addition of glucose to yield the final concentrations of 0.5, 1 and 2 g%, in the absence of mitogens. At the end of incubation, cell viability was determined and mitogen-induced proliferation was assayed (a and b). Characteristics of high glucose effects on lymphocyte proliferation are shown in c and d. Dark bars show proliferation from lymphocytes pre-incubated during 24 h in RPMI 1640 with high glucose. Grey bars display results from lymphocytes pre-incubated with high glucose but re-suspended in standard fresh medium for mitogen stimulation. White bars indicate proliferation from freshly obtained lymphocytes incubated with cell-free high glucose supernatants. Experimental values were expressed as percentage of the control values (proliferation of lymphoid cells incubated with standard medium), for Con A-stimulated T cells (a and c) and for LPS-stimulated B cells (b and d). Results shown are the mean ± s.e.m. of n = 6 independent experiments performed in triplicate. *P < 0.01 with respect to control values and #P < 0.01 with respect to high glucose values.
Table 1.
Mitogen stimulation of T and B cells after 24 h culture in media containing increasing concentrations of glucose or mannitol.
| Culture media added | Proliferation (dpm) | |
|---|---|---|
| T lymphocyte | B lymphocyte | |
| None (Glucose 0.2 g%) | 194 916 ± 21 136 | 64 373 ± 7 215 |
| Glucose 0.5 g% | 144 238 ± 8 654* | 52 142 ± 3 650 |
| Mannitol 0.5 g% | 216 357 ± 12 981 | 65 017 ± 4 551 |
| Glucose 1 g% | 116 950 ± 5 263* | 35 405 ± 1 770* |
| Mannitol 1 g% | 189 323 ± 8 966 | 62 717 ± 5 472 |
| Glucose 2 g% | 21 441 ± 557* | 6 437 ± 193* |
| Mannitol 2 g% | 139 365 ± 18 117 | 47 636 ± 2 858 |
P < 0.01 statistically significant compared with the control (standard medium). Data are the mean ± s.e.m. of six experiments performed in triplicate.
Fig. 4.
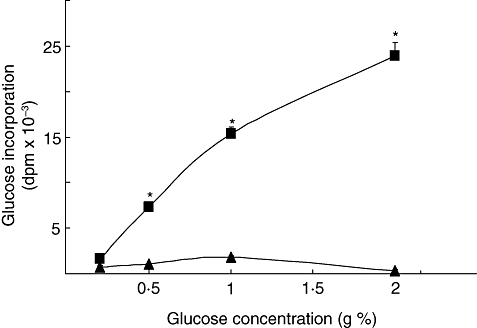
Effect of high glucose on glycosilated products formation. Incubations were allowed with 14C-glucose during 24 h in RPMI 1640 without (control, standard medium, 0.2 g% of glucose) or with the addition of glucose to obtain the final concentrations of 0.5, 1 and 2 g%, in the presence of lymphocytes (3 × 10⁶ cells/ml) (▪). As control we determine 14C-glucose incorporation in the incubation media obtained in the absence of cells (▴). Experimental values were expressed as glucose incorporation. Results shown are the mean ± s.e.m. of n = 6 independent experiments. *P < 0.01 with respect to control.
Effect of high glucose on cell viability and apoptosis
To analyse high glucose effect on cell viability, lymph node and spleen lymphocytes were exposed to various test media containing increasing concentrations of glucose for 24 h, and viability and apoptosis were studied. High glucose caused a concentration dependent decrease in cell viability. At a concentration of 1 g%, glucose induced a decrease in cell viability of 15·3 ± 0·8% and 27·5 ± 1·2% for lymph node and spleen cells, respectively, when compared with control cells incubated in standard medium (Fig. 5).
Fig. 5.
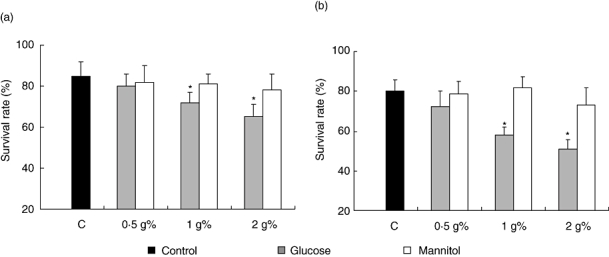
Effect of high glucose on lymphocyte viability. Lymph node lymphocytes (a) or spleen cells (b) (3 × 10⁶ cells/ml) were incubated for 24 h in RPMI 1640 without (control, standard medium, 0.2 g% of glucose) or with the addition of glucose or mannitol to yield the final concentrations of 0.5, 1 and 2 g%. At the end of incubation, cell viability was determined according to the trypan blue exclusion criteria. Data were plotted as the percentage of viable relative to the total number of plated cells (survival rate) and are the mean ± s.e.m. of 10 independent experiments. *P < 0.01 with respect to the corresponding control values.
The participation of apoptotic effects was evaluated by flow cytometric analysis after staining the DNA content of nuclei with PI. In this way, the low broad hypodiploid peak due to apoptotic cells was measured. As shown in Fig. 6 (b and c) after 24 h incubation with high glucose, apoptotic cell levels increased significantly. In a similar way, Hoescht staining of cells incubated for 24 h in medium with high glucose, showed a reduction in the diameter of the nuclei and a complete disarrangement of structure with small areas of highly condensed cromatin, characteristic of apoptotic cells (Fig. 6a). These results showed that treatment with high glucose induced apoptosis in lymph node and spleen lymphocytes.
Fig. 6.
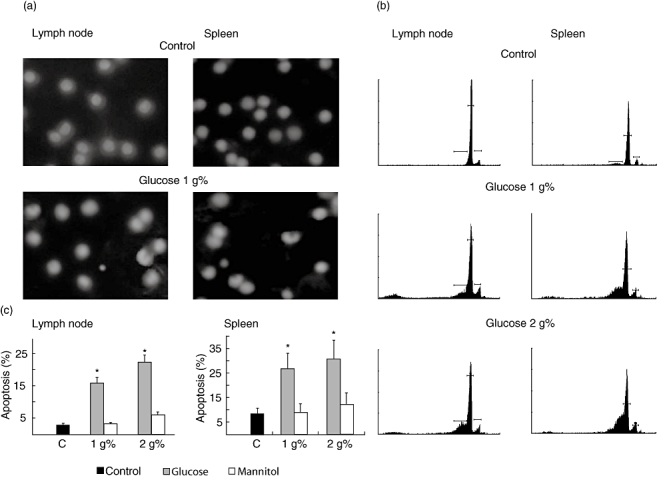
Quantification of apoptosis in lymph node and spleen cell cultures submitted to high glucose concentrations. Lymphocytes (3 × 10⁶ cells/ml) were treated for 24 h in RPMI 1640 without (control, standard medium) or with the addition of high glucose or mannitol. At the end of the exposure period, apoptotic cells were identified. Nuclear chromatin morphology after staining with Hoescht 33342 (a) or DNA fluorescence in flow cytometric profiles of propidium iodide stained lymphocytes was evaluated (b). Results shown are representative of four independent experiments. c shows the percentage (mean ± s.e.m.) of subdiploid DNA content (termed as apoptotic cells) of four samples calculated from cytometry analysis. *P < 0.01 with respect to standard medium (0.2 g% glucose).
To demonstrate that the effects of high glucose on cell viability were not a consequence of hyperosmolarity, experiments were reproduced using RPMI 1640 containing equimolar concentrations of mannitol. After 24 h of culture, mannitol did not significantly modify T- and B-cell viability or apoptosis (Figs 5 and 6).
Effect of high glucose on oxidative stress production
Oxidative stress in lymph node and spleen lymphocytes was analysed by the detection of ROS and by the measurement of lipid peroxidation performed by TBARS production. After 24 h of incubation with high glucose, T and B lymphocytes showed an increase in ROS production and lipid peroxidation in comparison with control cells (Fig. 7). When the same concentration of mannitol was used, no enhancement of intracellular ROS and TBARS formation was observed.
Fig. 7.
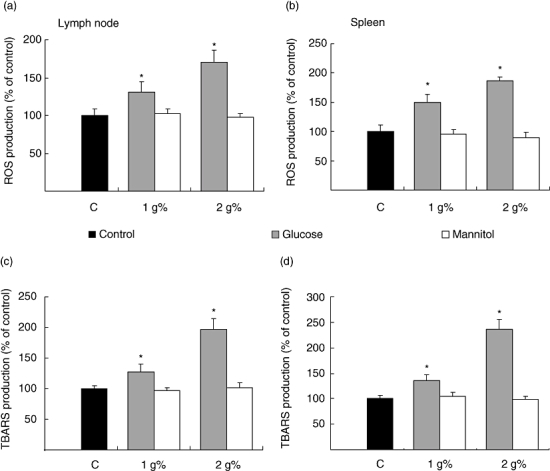
Effect of high glucose on reactive oxygen species (ROS) and on lipid peroxidation (TBARS) production. Lymph node (a and c) and spleen (b and d) lymphocytes (3 × 10⁶ cells/ml) were cultured during 24 h in control (standard) and high glucose or mannitol medium. At the end of the exposure period, cell viability was determined and ROS (a and b) or TBARS (c and d) production was evaluated. Results were expressed as the percentage of stimulation above control values, which was referred to as 100%. It is worth noting that control values for ROS concentrations were 4.46 ± 0.32 and 5.48 ± 0.63 nmol/106 cells and TBARS production values were 0.423 ± 0.07 and 1.58 ± 0.08 nmol/107 cells, for lymph node and spleen lymphocytes respectively. Results are the mean ± s.e.m. of five separate experiments performed in triplicate. *P < 0.01 compared with standard medium alone.
Discussion
Although diabetes is widely believed to predispose to serious infections and clinical studies support an association between diabetes and infection, the mechanisms linking diabetes and immunosuppression are not completely elucidated [1].
The present work was undertaken to investigate the immunosupression associated with diabetes and the participation of high glucose levels. For this purpose a STZ-induced model of type I diabetes in mice was used. As a regimen of multiple doses of STZ is highly dependent on the strain of mice and on age, 2-month-old BALB/cByJ mice were used. This strain has an intermediate susceptibility to diabetic induction [43] and displays a chronic stable mild hyperglycaemia without insulin therapy and a similar life-time to normal mice.
These diabetic mice displayed altered humoral immune responses. In fact, after 6 months of diabetes induction both primary production of IgM and IgG antibodies against a T-cell-dependent or independent antigen are affected, but 1 month of STZ treatment is sufficient for decreasing the IgG levels of anti-SRBC in the secondary response. These findings suggest that the hyperglycaemic state in mice mainly affects the immunological memory. Several studies have indicated an alteration of the antibody synthesis to immunization in the context of diabetes. Thus, the primary antibody production to T-cell dependent antigens (hepatitis A viral antigen, diphtheria toxoid) is reduced in type-1 diabetes patients, while the response to a T-cell-independent polysaccharide (pneumococcal polysaccharide) was normal [44]. A depletion of memory CD4+ cells was also described in these patients [45]. Likewise, in diabetic mice, it was shown that a depression in primary and secondary immune responses was due to altered T-cell function and phagocytic activity in macrophages [46]. Moreover, impaired proliferation of diabetic lymphocytes has been described. In peripheral blood lymphocytes from hyperglycaemic diabetic patients, either with insulin-dependent diabetes mellitus or non-insulin-dependent diabetes mellitus, reduced proliferative responses of T cells were reported [44,47–49]. Furthermore, Sakowicz-Burkiewicz et al.[50] described that T cells isolated from the spleen of diabetic rats proliferate less than cells isolated from normal rats when stimulated with mitogen or anti-CD3 or anti-CD28 antibodies. However, our results indicate that IgG production is impaired after 1 month of diabetic induction while the proliferation of T- and B-cells to mitogens is affected after 6 months of a maintained and mild diabetic state, suggesting therefore that an in vivo factor would be altering the immune response.
Hyperglycaemia has been identified as the main factor contributing, either through direct or indirect mechanisms, to the diabetic pathogenesis, by producing biochemical and metabolic alterations that lead to both functional and structural alterations [7–9,20,51,52]. Also, several studies have described the metabolism and function of immune cells from diabetic patients, but there are only very few reports of the direct action of high glucose on lymphocyte physiology.
The present results indicate that high glucose levels can alter activation of both T and B lymphocytes. In fact, pre-incubation of lymph node and spleen cells in a high glucose containing medium led to a significant time- and dose-dependent decrease in T- and B-selective mitogen-induced proliferation. These effects were not associated with hypertonic glucose as they were not observed in similar osmotic concentrations of mannitol, suggesting that glucose may have a suppressive effect on cell proliferation that is independent of osmolarity. It is important to note that reduction in either T or B cell proliferation was not observed when high glucose and mitogens were simultaneously added, indicating that a time-dependent interaction of the cells with high glucose is needed. So, the possibility emerged that the immune response was affected by either altered lymphoid and/or accessory cell functionality or a time-dependent formation of toxic intermediates that affect lymphocyte activation. As high-glucose exposed cells were able to improve their proliferative response when cultured with the mitogen in a fresh standard medium, we analysed the possible participation of intermediates that in turn could be affecting immune reactivity. In fact, cell-free supernatants from 24 h-lasting incubations of cells with high glucose were able to decrease mitogen-induced proliferation of fresh lymphocytes.
Many important biochemical mechanisms are activated in the presence of high glucose, which occur in diabetes. Elevated levels of glucose accelerate the formation of advanced glycation products [53]. We observed the presence of glycosilated products in the supernatants obtained after 24 h incubation in the presence of lymphocytes, suggesting their participation in the deleterious effect of high glucose on lymphocyte proliferation. It is widely accepted that hyperglycaemic conditions induced an enhancement of oxidative stress in a variety of tissues and cells types [54–56]. Moreover, via their chief signalling receptor AGEs generate ROS [57]. The results shown here are in line with these observations. Twenty-four-hour incubation of lymph node and spleen lymphocytes with high glucose leads to an increase in oxidative stress as indicated by the measurement of free radical production (ROS generation) and by the presence of lipid peroxidation (TBARS production). On the other hand, ROS and lipid peroxidation levels in cells incubated in the presence of hyperosmotic mannitol were not different from those incubated in control glucose. T-cell suppression by increased levels of ROS was already described [58,59]. Moreover, several studies have shown that intracellular oxidative stress initiates apoptotic processes and is toxic to primary T cells [60–62]. It has been suggested that enhanced oxidative stress plays an important role in the development of immunodeficiency [63] and may be involved in both impaired responsiveness and enhanced apoptosis in T cells from HIV-infected or other immunodeficient patients [64,65]. Moreover, previous studies have described that high glucose enhanced oxidative damage, which in turn may activate the death pathways implicated in cell necrosis and apoptosis [66–68]. In accordance with these results, the presence of high glucose in lymph node and spleen lymphocyte cultures decreased cell viability. Cell counting performed after 24 h incubation in high glucose conditions showed a significant decrease in cell survival and a higher percentage of apoptotic cells. Apoptosis induction by a high glucose or diabetic state was also observed in endothelial cells [69–71], as well as in retinal neural cells [72] and in aorta [73].
Finally, we show in this study, for the first time, that high glucose concentrations can directly affect lymphoid cell growth and lead to cell death. There is evidence that improving glycaemic control in diabetic patients ameliorates immune dysfunction [6,74,75]. Although extrapolation to in vivo conditions must be handled with caution, it can be suggested that prolonged exposure to pathologically high concentrations of glucose would result in the immunosuppressive state observed in diabetes. The results presented here point to the importance of early adequate control of glycaemia in subjects affected by diabetes.
Acknowledgments
This study was supported by grants from CONICET, PEI 6332/01, PIP 6049 and an Alberto J. Roemmers Foundation grant.
The authors wish to thank Daniel Gonzalez for his invaluable help in the animal care and María Rosa Gonzalez Murano for her technical support.
References
- 1.Peleg AY, Weerarathna T, McCarthy JS, Davis TM. Common infections in diabetes: pathogenesis, management and relationship to glycaemic control. Diabetes Metab Res Rev. 2007;23:3–13. doi: 10.1002/dmrr.682. [DOI] [PubMed] [Google Scholar]
- 2.Joshi N, Caputo GM, Weitekamp MR, Karchmer AW. Infections in patients with diabetes mellitus. N Engl J Med. 1999;341:1906–12. doi: 10.1056/NEJM199912163412507. [DOI] [PubMed] [Google Scholar]
- 3.Pozzilli P, Leslie RD. Infections and diabetes: mechanisms and prospects for prevention. Diabet Med. 1994;11:935–41. doi: 10.1111/j.1464-5491.1994.tb00250.x. [DOI] [PubMed] [Google Scholar]
- 4.Wheat LJ. Infection and diabetes mellitus. Diabetes Care. 1980;3:187–97. doi: 10.2337/diacare.3.1.187. [DOI] [PubMed] [Google Scholar]
- 5.Bertoni AG, Saydah S, Brancati FL. Diabetes and the risk of infection-related mortality in the U.S. Diabetes Care. 2001;24:1044–9. doi: 10.2337/diacare.24.6.1044. [DOI] [PubMed] [Google Scholar]
- 6.McMahon MM, Bistrian BR. Host defenses and susceptibility to infection in patients with diabetes mellitus. Infect Dis Clin North Am. 1995;9:1–9. [PubMed] [Google Scholar]
- 7.DCCT: The Diabetes Control and Complications Trial Research Group. The effect of intensive treatment of diabetes on the development and progression of long-term complications in insulin-dependent diabetes mellitus. N Engl J Med. 1993;329:977–86. doi: 10.1056/NEJM199309303291401. [DOI] [PubMed] [Google Scholar]
- 8.DCCT: The Diabetes Control and Complications Trial Research Group. Intensive diabetes treatment and cardiovascular disease in patients with type 1 diabetes. N Engl J Med. 2005;353:2643–53. doi: 10.1056/NEJMoa052187. [DOI] [PMC free article] [PubMed] [Google Scholar]
- 9.UK Prospective Diabetes Study Group. Intensive blood-glucose control with sulphonylureas or insulin compared with conventional treatment and risk of complications in patients with type 2 diabetes (UKPDS 33) Lancet. 1998;352:854–65. [PubMed] [Google Scholar]
- 10.Furnary AP, Zerr KJ, Grunkemeier GL, Starr A. Continuous intravenous insulin infusion reduces the incidence of deep sternal wound infection in diabetic patients after cardiac surgical procedures. Ann Thorac Surg. 1999;67:352–60. doi: 10.1016/s0003-4975(99)00014-4. [DOI] [PubMed] [Google Scholar]
- 11.Butler SO, Btaiche IF, Alaniz C. Relationship between hyperglycemia and infection in critically ill patients. Pharmacotherapy. 2005;25:963–76. doi: 10.1592/phco.2005.25.7.963. [DOI] [PubMed] [Google Scholar]
- 12.Latham R, Lancaster AD, Covington JF, Pirolo JS, Thomas CS. The association of diabetes and glucose control with surgical-site infections among cardiothoracic surgery patients. Infect Control Hosp Epidemiol. 2001;22:607–12. doi: 10.1086/501830. [DOI] [PubMed] [Google Scholar]
- 13.Christiansen C, Toft P, Jorgensen HS, Andersen SK, Tonnesen E. Hyperglycaemia and mortality in critically ill patients. A prospective study. Intensive Care Med. 2004;30:1685–8. doi: 10.1007/s00134-004-2325-2. [DOI] [PubMed] [Google Scholar]
- 14.Baynes JW. Role of oxidative stress in the development of complications in diabetes. Diabetes. 1991;40:405–12. doi: 10.2337/diab.40.4.405. [DOI] [PubMed] [Google Scholar]
- 15.Rosen P, Nawroth PP, King G, Moller W, Tritschler HJ, Packer L. The role of oxidative stress in the onset and progression of diabetes and its complications: a summary of a Congress Series sponsored by UNESCO-MCBN, the American Diabetes Association and the German Diabetes Society. Diabetes Metab Res Rev. 2001;17:189–212. doi: 10.1002/dmrr.196. [DOI] [PubMed] [Google Scholar]
- 16.Schreck R, Baeuerle PA. A role for oxygen radicals as second messengers. Trends Cell Biol. 1991;1:39–42. doi: 10.1016/0962-8924(91)90072-h. [DOI] [PubMed] [Google Scholar]
- 17.Burdon RH. Superoxide and hydrogen peroxide in relation to mammalian cell proliferation. Free Radic Biol Med. 1995;18:775–94. doi: 10.1016/0891-5849(94)00198-s. [DOI] [PubMed] [Google Scholar]
- 18.Whitacre CM, Cathcart MK. Oxygen free radical generation and regulation of proliferative activity of human mononuclear cells responding to different mitogens. Cell Immunol. 1992;144:287–95. doi: 10.1016/0008-8749(92)90245-k. [DOI] [PubMed] [Google Scholar]
- 19.Evans JL, Goldfine ID, Maddux BA, Grodsky GM. Are oxidative stress-activated signaling pathways mediators of insulin resistance and beta-cell dysfunction? Diabetes. 2003;52:1–8. doi: 10.2337/diabetes.52.1.1. [DOI] [PubMed] [Google Scholar]
- 20.Brownlee M. Biochemistry and molecular cell biology of diabetic complications. Nature. 2001;414:813–20. doi: 10.1038/414813a. [DOI] [PubMed] [Google Scholar]
- 21.Vincent AM, Russell JW, Low P, Feldman EL. Oxidative stress in the pathogenesis of diabetic neuropathy. Endocrine Reviews. 2004;25:612–28. doi: 10.1210/er.2003-0019. [DOI] [PubMed] [Google Scholar]
- 22.Ceriello A, Bortolotti N, Crescentini A, et al. Antioxidant defenses are reduced during the oral glucose tolerance test in normal and non-insulin-dependent diabetic subjects. Eur J Clin Invest. 1998;28:329–33. doi: 10.1046/j.1365-2362.1998.00295.x. [DOI] [PubMed] [Google Scholar]
- 23.Merzouk S, Hichami A, Madani S, et al. Antioxidant status and levels of different vitamins determined by high performance liquid chromatography in diabetic subjects with multiple complications. Gen Physiol Biophys. 2003;22:15–27. [PubMed] [Google Scholar]
- 24.Tessier D, Khalil A, Fülöp T. Effects of an oral glucose challenge on free radicals/antioxidants balance in an older population with type II diabetes. J Gerontol A Biol Sci Med Sci. 1999;54:M541–5. doi: 10.1093/gerona/54.11.m541. [DOI] [PubMed] [Google Scholar]
- 25.Giugliano D, Ceriello A, P. Oxidative stress and diabetic vascular complications. Diabetes Care. 1996;19:257–67. doi: 10.2337/diacare.19.3.257. [DOI] [PubMed] [Google Scholar]
- 26.Rodríguez-Mañas L, Angulo J, Vallejo S, et al. Early and intermediate Amadori glycosylation adducts, oxidative stress, and endothelial dysfunction in the streptozotocin-induced diabetic rats vasculature. Diabetologia. 2003;46:556–66. doi: 10.1007/s00125-003-1056-1. [DOI] [PubMed] [Google Scholar]
- 27.Lee HB, Yu MR, Yang Y, Jiang Z, Ha H. Reactive oxygen species-regulated signaling pathways in diabetic nephropathy. J Am Soc Nephrol. 2003;14(8 Suppl 3):S241–5. doi: 10.1097/01.asn.0000077410.66390.0f. [DOI] [PubMed] [Google Scholar]
- 28.Ha H, Kim KH. Pathogenesis of diabetic nephropathy: the role of oxidative stress and protein kinase C. Diabetes Res Clin Pract. 1999;45:147–51. doi: 10.1016/s0168-8227(99)00044-3. [DOI] [PubMed] [Google Scholar]
- 29.Dröge W, Eck HP, Mihm S. HIV-induced cysteine deficiency and T-cell dysfunction-a rationale for treatment with N-acetylcysteine. Immunol Today. 1992;13:211–14. doi: 10.1016/0167-5699(92)90156-2. [DOI] [PubMed] [Google Scholar]
- 30.Staal FJ, Ela SW, Roederer M, Anderson MT, Herzenberg LA, Herzenberg LA. Glutathione deficiency and human immunodeficiency virus infection. Lancet. 1992;339:909–12. doi: 10.1016/0140-6736(92)90939-z. [DOI] [PubMed] [Google Scholar]
- 31.Robinson MK, Rodrick ML, Jacobs DO, et al. Glutathione depletion in rats impairs T-cell and macrophage immune function. Arch Surg. 1993;128:29–34. doi: 10.1001/archsurg.1993.01420130033006. [DOI] [PubMed] [Google Scholar]
- 32.Like AA, Rossini AA. Streptozotocin-induced pancreatic insulitis: new model of diabetes mellitus. Science. 1976;193:415–17. doi: 10.1126/science.180605. [DOI] [PubMed] [Google Scholar]
- 33.Silberman DM, Wald MR, Genaro AM. Acute and chronic stress exerts opposing effects on antibody responses associated with changes in stress hormone regulation of T-lymphocyte reactivity. J Neuroimmunol. 2003;144:53–60. doi: 10.1016/j.jneuroim.2003.08.031. [DOI] [PubMed] [Google Scholar]
- 34.Silberman DM, Wald M, Genaro AM. Effects of chronic mild stress on lymphocyte proliferative response. Participation of serum thyroid hormones and corticosterone. Int Immunopharmacol. 2002;2:487–97. doi: 10.1016/s1567-5769(01)00190-4. [DOI] [PubMed] [Google Scholar]
- 35.Cazaux CA, Sterin-Borda L, Gorelik G, Cremaschi GA. Down-regulation of beta-adrenergic receptors induced by mitogen activation of intracellular signaling events in lymphocytes. FEBS Lett. 1995;364:120–4. doi: 10.1016/0014-5793(95)00366-h. [DOI] [PubMed] [Google Scholar]
- 36.Nicolletti I, Migliorati G, Pagliacci MC, Grignani F, Riccardi C. A rapid and simple method for measuring thymocyte apoptosis by propidium iodide staining and flow cytometry. J Immunol Methods. 1991;139:271–9. doi: 10.1016/0022-1759(91)90198-o. [DOI] [PubMed] [Google Scholar]
- 37.Zamai L, Falcieri E, Zauli G, Cataldi A, Vitale M. Optimal detection of apoptosis by flow cytometry depends on cell morphology. Cytometry. 1993;14:891–7. doi: 10.1002/cyto.990140807. [DOI] [PubMed] [Google Scholar]
- 38.Bass DA, Parce JW, Dechatelet LR, Szejda P, Seeds MC, Thomas M. Flow cytometric studies of oxidative product formation by neutrophils: a graded response to membrane stimulation. J Immunol. 1983;130:1910–17. [PubMed] [Google Scholar]
- 39.Buege JA, Aust SD. Microsomal lipid peroxidation. Methods Enzymol. 1979;52:302–10. doi: 10.1016/s0076-6879(78)52032-6. [DOI] [PubMed] [Google Scholar]
- 40.Cerami A, Vlassara H, Brownlee M. Role of advanced glycosylation products in complications of diabetes. Diabetes Care. 1988;1:73–9. [PubMed] [Google Scholar]
- 41.Imani F, Horii Y, Suthanthiran M, et al. Advanced glycosylation endproduct-specific receptors on human and rat T-lymphocytes mediate synthesis of interferon gamma: role in tissue remodeling. J Exp Med. 1993;178:2165–72. doi: 10.1084/jem.178.6.2165. [DOI] [PMC free article] [PubMed] [Google Scholar]
- 42.Moser B, Desai DD, Downie MP, et al. Receptor for advanced glycation end products expression on T cells contributes to antigen-specific cellular expansion in vivo. J Immunol. 2007;179:8051–8. doi: 10.4049/jimmunol.179.12.8051. [DOI] [PubMed] [Google Scholar]
- 43.Leiter EH, Le PH, Prochazka M, Worthen SM, Huppi K. Genetic and environmental control of diabetes induction by multi-dose streptozotocin in two BALB/c substrains. Diabetes Res. 1988;9:5–10. [PubMed] [Google Scholar]
- 44.Eibl N, Spatz M, Fischer GF, et al. Impaired primary immune response in type-1 diabetes: results from a controlled vaccination study. Clin Immunol. 2002;103:249–59. doi: 10.1006/clim.2002.5220. [DOI] [PubMed] [Google Scholar]
- 45.Moutschen MP, Scheen AJ, Lefebvre PJ. Impaired immune responses in diabetes mellitus: analysis of the factors and mechanisms involved. Relevance to the increased susceptibility of diabetic patients to specific infections. Diabete Metab. 1992;18:187–201. [PubMed] [Google Scholar]
- 46.Saiki O, Negoro S, Tsuyuguchi I, Yamamura Y. Depressed immunological defence mechanisms in mice with experimentally induced diabetes. Infect Immun. 1980;28:127–31. doi: 10.1128/iai.28.1.127-131.1980. [DOI] [PMC free article] [PubMed] [Google Scholar]
- 47.Chang FY, Shaio MF. Decreased cell-mediated immunity in patients with non-insulin-dependent diabetes mellitus. Diabetes Res Clin Pract. 1995;28:137–46. doi: 10.1016/0168-8227(95)00168-8. [DOI] [PubMed] [Google Scholar]
- 48.Plouffe JF, Silva J, Fekety R, Allen JL. Cell-mediated immunity in diabetes mellitus. Infect Immun. 1978;21:425–29. doi: 10.1128/iai.21.2.425-429.1978. [DOI] [PMC free article] [PubMed] [Google Scholar]
- 49.De Maria R, Todaro M, Stassi G, et al. Cell receptor/CD3 complex signaling in human type I diabetes. Eur J Immunol. 1994;24:999–1002. doi: 10.1002/eji.1830240433. [DOI] [PubMed] [Google Scholar]
- 50.Sakowicz-Burkiewicz M, Kocbuch K, Grden M, Szutowicz A, Pawelczyk T. Diabetes-induced decrease of adenosine kinase expression impairs the proliferation potential of diabetic rat T lymphocytes. Immunology. 2006;118:402–12. doi: 10.1111/j.1365-2567.2006.02380.x. [DOI] [PMC free article] [PubMed] [Google Scholar]
- 51.Stratton IM, Adler AI, Neil H, et al. On behalf of the UK Prospective Diabetes Study Group Association of glycaemia with macrovascular and microvascular complications of type 2 diabetes (UKPDS 35): prospective observational study. BMJ. 2000;321:405–12. doi: 10.1136/bmj.321.7258.405. [DOI] [PMC free article] [PubMed] [Google Scholar]
- 52.Koya D, King GL. Protein kinase C activation and the development of diabetic complications. Diabetes. 1998;47:859–66. doi: 10.2337/diabetes.47.6.859. [DOI] [PubMed] [Google Scholar]
- 53.Yan SF, Ramasamy R, Schmidt AM. Mechanisms of disease: advanced glycation end-products and their receptor in inflammation and diabetes complications. Nat Clin Pract Endocrinol Metab. 2008;4:285–93. doi: 10.1038/ncpendmet0786. [DOI] [PubMed] [Google Scholar]
- 54.Ceriello A, dello Russo P, Amstad P, Cerutti P. High glucose induces antioxidant enzymes in human endothelial cells in culture. Evidence linking hyperglycemia and oxidative stress. Diabetes. 1996;45:471–7. doi: 10.2337/diab.45.4.471. [DOI] [PubMed] [Google Scholar]
- 55.Catherwood MA, Powell LA, Anderson P, McMaster D, Sharpe PC, Trimble ER. Glucose-induced oxidative stress in mesangial cells. Kidney Int. 2002;61:599–608. doi: 10.1046/j.1523-1755.2002.00168.x. [DOI] [PubMed] [Google Scholar]
- 56.Ho FM, Liu SH, Liau CS, Huang PJ, Lin-Shiau SY. High glucose-induced apoptosis in human endothelial cells is mediated by sequential activations of c-Jun NH(2)-terminal kinase and caspase-3. Circulation. 2000;101:2618–24. doi: 10.1161/01.cir.101.22.2618. [DOI] [PubMed] [Google Scholar]
- 57.Schmitt A, Bigl K, Meiners I, Schmitt J. Induction of reactive oxygen species and cell survival in the presence of advanced glycation end products and similar structures. Biochim Biophys Acta. 2006;1763:927–36. doi: 10.1016/j.bbamcr.2006.07.006. [DOI] [PubMed] [Google Scholar]
- 58.Novogrodsky A, Ravid A, Rubin AL, Stenzel KH. Hydroxyl radical scavengers inhibit lymphocyte mitogenest. Proc Natl Acad Sci USA. 1982;79:1171–4. doi: 10.1073/pnas.79.4.1171. [DOI] [PMC free article] [PubMed] [Google Scholar]
- 59.Hamilos DL, Wedner HJ. The role of glutathione in lymphocyte activation. I. Comparison of inhibitory effects of buthionine sulfoximine and 2-cyclohexene-1-one by nuclear size transformation. J Immunol. 1985;135:2740–7. [PubMed] [Google Scholar]
- 60.Hildeman DA, Mitchell T, Teague TK, et al. Reactive oxygen species regulate activation-induced T cell apoptosis. Immunity. 1999;10:735–44. doi: 10.1016/s1074-7613(00)80072-2. [DOI] [PubMed] [Google Scholar]
- 61.Burton KP, McCord JM, Ghai G. Myocardial alterations due to free-radical generation. Am J Physiol. 1984;246:H776–83. doi: 10.1152/ajpheart.1984.246.6.H776. [DOI] [PubMed] [Google Scholar]
- 62.Stohs SJ. The role of free radicals in toxicity and disease. J Basic Clin Physiol Pharmacol. 1995;6:205–28. doi: 10.1515/jbcpp.1995.6.3-4.205. [DOI] [PubMed] [Google Scholar]
- 63.Buttke TM, Sandstrom PA. Redox regulation of programmed cell death in lymphocytes. Free Radic Res. 1995;22:389–97. doi: 10.3109/10715769509147548. [DOI] [PubMed] [Google Scholar]
- 64.Aukrust P, Svardal AM, Muller F, et al. Increased levels of oxidized glutathione in CD4+ lymphocytes associated with disturbed intracellular redox balance in human immunodeficiency virus type 1 infection. Blood. 1995;86:258–67. [PubMed] [Google Scholar]
- 65.Aukrust P, Svardal AM, Muller F, Lunden B, Berge RK, Froland SS. Decreased levels of total and reduced glutathione in CD4+ lymphocytes in common variable immunodeficiency are associated with activation of the tumor necrosis factor system: possible immunopathogenic role of oxidative stress. Blood. 1995;86:1383–91. [PubMed] [Google Scholar]
- 66.Ceriello A, Quagliaro L, D’Amico M, et al. Acute hyperglycemia induces nitrotyrosine formation and apoptosis in perfused heart from rat. Diabetes. 2002;51:1076–82. doi: 10.2337/diabetes.51.4.1076. [DOI] [PubMed] [Google Scholar]
- 67.Frustaci A, Kajstura J, Chimenti C, et al. Myocardial cell death in human diabetes. Circ Res. 2000;87:1123–32. doi: 10.1161/01.res.87.12.1123. [DOI] [PubMed] [Google Scholar]
- 68.von Harsdorf R, Li PF, Dietz R. Signaling pathways in reactive oxygen species-induced cardiomyocyte apoptosis. Circulation. 1999;99:2934–41. doi: 10.1161/01.cir.99.22.2934. [DOI] [PubMed] [Google Scholar]
- 69.Baumgartner-Parzer SM, Wagner L, Pettermann M, Grillari J, Gessl A, Waldhausl W. High-glucose – triggered apoptosis in cultured endothelial cells. Diabetes. 1995;44:1323–7. doi: 10.2337/diab.44.11.1323. [DOI] [PubMed] [Google Scholar]
- 70.Du XL, Sui GZ, Stockklauser-Farber K, et al. Introduction of apoptosis by high proinsulin and glucose in cultured human umbilical vein endothelial cells is mediated by reactive oxygen species. Diabetologia. 1998;41:249–56. doi: 10.1007/s001250050900. [DOI] [PubMed] [Google Scholar]
- 71.Wu QD, Wang JH, Fennessy F, Redmond HP, Bouchier-Hayes D. Taurine prevents high-glucose-induced human vascular endothelial cell apoptosis. Am J Physiol Cell Physiol. 1999;277:C1229–38. doi: 10.1152/ajpcell.1999.277.6.C1229. [DOI] [PubMed] [Google Scholar]
- 72.Barber AJ. A new view of diabetic retinopathy: a neurodegenerative disease of the eye. Prog Neuropsychopharmacol Biol Psychiatry. 2003;27:283–90. doi: 10.1016/S0278-5846(03)00023-X. [DOI] [PubMed] [Google Scholar]
- 73.Chu Y, Faraci FM, Ooboshi H, Heistad DD. Increase in TUNEL positive cells in aorta from diabetic rats. Endothelium. 1997;5:241–50. doi: 10.3109/10623329709052589. [DOI] [PubMed] [Google Scholar]
- 74.Gallacher SJ, Thomson G, Fraser WD, Fisher BM, Gemmell CG, MacCuish AC. Neutrophil bactericidal function in diabetes mellitus: evidence for association with blood glucose control. Diabet Med. 1995;12:916–20. doi: 10.1111/j.1464-5491.1995.tb00396.x. [DOI] [PubMed] [Google Scholar]
- 75.Rassias AJ, Marrin CA, Arruda J, Whalen PK, Beach M, Yeager MP. Insulin infusion improves neutrophil function in diabetic cardiac surgery patients. Anesth Analg. 1999;88:1011–16. doi: 10.1097/00000539-199905000-00008. [DOI] [PubMed] [Google Scholar]