

Abstract
During a study of gene expression of foxp3 in blood mononuclear cells we observed a DNA product of an unknown RNA fragment. The area of this peak correlated with CD14 mRNA in a small group of subjects. The sequence was localized to chromosome 1. We tested the hypothesis that gene expression of the poly A(−) transcript (designated Heg) in mononuclear cells was correlated with CD14 mRNA in normal subjects and with CD14 mRNA and TSH receptor autoantibodies in patients with acute and untreated Graves' disease. mRNA was expressed in amol/µg DNA. The main study groups were: (i) normal subjects; (ii) patients with early and untreated Graves' disease; and (iii) patients with Graves' disease studied after treatment. In 18 normal subjects and in 20 patients with treated Graves' disease CD14 mRNA was negatively correlated with Heg (P < 0·001). In 17 untreated patients with Graves' disease Heg and thyroid receptor autoantibodies were negatively correlated (P < 0·009). Incubation studies with mononuclear cells showed that the addition of a fragment of the central part of Heg (949 bases) to mononuclear cells decreased CD14 mRNA markedly to zero or nearly zero (P < 0·001). This response was not specific in the sense that siRNA and lipopolysaccharide also decreased CD14 mRNA, probably due to activation of the CD14/Toll-like receptor complex. Single-stranded RNA is likely to increase interferon production. Due to the anti-inflammatory effect Heg may also inhibit the early phase of TSH receptor autoantibody production.
Keywords: autoimmunity, macrophages/monocytes, signalling/signal transduction, thyroid, transcription factor/gene regulation
Introduction
Recent studies have indicated that some overlapping transcripts or non-coding RNAs may have a significant effect on cell signalling and RNA regulation of protein-coding genes [1,2].
During a study of gene expression of foxp3 in blood mononuclear cells (MNC) we observed a DNA product of an unknown RNA fragment. The area of this peak was correlated with the gene expression level of CD14 mRNA as measured in a small group of subjects. The sequence was localized by a BLAST search to a clone from the HUGO project on chromosome 1 and designated Heg. No polyadenylation signal was observed. The Heg gene overlaps the Nucks gene on the opposite strand. The Nucks protein, nuclear ubiquitous casein kinase substrate, is considered to play a role in transcription regulation. This study describes Heg and tests the hypothesis that Heg is related to gene expression of CD14 mRNA. CD14 and toll-like receptors are considered to play a role in innate immune function by recognizing bacterial structures. Furthermore, CD14 plays an important role in the clearance of apoptotic cells and in the innate immune response to viruses. We wanted also to include measurements of an antibody in the study. We selected TSH receptor autoantibodies, because we treat many patients with Graves' disease in the endocrine department, and we have experience with measurements of these autoantibodies. Furthermore, it was possible to select a group of patients with early and untreated Graves' disease as well as a group of treated patients. Many autoimmune diseases probably start with the production of autoantibodies, and it is therefore important to obtain data at an early stage of development of the disease. In additional studies with incubation of MNC, we attempted to silence Heg RNA by specific siRNA and by the addition of a RNA fragment from the central part of Heg. Furthermore, we inhibited gene expression by the addition of DRB.
Materials and methods
Subjects
All subjects gave informed consent. The study protocol was approved by the Ethics Committee of Copenhagen County, and was in compliance with the declaration of Helsinki II.
The initial part of the study and incubation studies were done on blood samples obtained from technicians and scientists working in the laboratory. The main study groups were as follows.
Eighteen normal subjects were all healthy as assessed by medical history and none of them were taking any medication. The mean age was 45 years (range 20 to 65 years). Ten were females and eight males.
Seventeen patients with Graves' disease were studied at the time of diagnosis before treatment with antithyroid drugs had begun. The mean age was 48 years (range 35 to 67 years). Sixteen were female and one male. The median TSH receptor autoantibody level was 11·4 IU/l (range 2·8–90). Thyroid hormones T3 mean 5·8 ± 1·5 (± s.e.m.) nM (normal range 1·0 to 2·6 nM) and T4 mean 197 ± 22 nM (60 to 140 nM) were increased and TSH mean 0·009 ± 0·004 mIU/l (0·4 to 5·0 mIU/l) was decreased.
Twenty patients with Graves' disease were studied after treatment had been initiated. The mean age was 41 years (range 28 to 52 years). Fifteen were female and five male. mRNA levels were not measured in these patients before treatment was started but only at a follow-up after 11 months of treatment (median, range 1–95 months). At the time of examination thyroid hormones were normalized in approximately half of the subjects and 11 subjects had minor elevations in T3 values or suppressed TSH levels. In the majority of patients the TSH receptor autoantibody level decreased from the time of diagnosis to the time of study. Six of the patients were treated with PTU and 14 patients were treated with Thiamazol. The median daily dose of Thiamazol was 25 mg and 6·3 mg at the start of treatment and at the time of blood sampling for gene expression analysis, respectively.
Isolation of RNA and determination of total RNA and DNA
RNA was isolated from 5 × 10⁶ MNC. For isolation of RNA we applied the Qiaamp Blood Mini Kit (Qiagen Gmbh, Hilden, Germany). After the lysis step 30 µl were removed for determination of DNA concentrations. Elution was with 500 µl DEPC-H2O. Total RNA concentration was measured in 70 µl by an Eppendorf Biophotometer. The DNA concentration was measured by fluorescence (DyNAQuant 200 apparatus, Hoefer Pharmacia Biotech, Freiburg, Germany).
Quantification of Heg, Nucks, CD14 mRNA and other transcripts in MNC
mRNA was quantified by RT-PCR-HPLC. The technique has been described elsewhere [3]. HPLC was applied to separate the peak value from the specific standard and the mRNA to be measured.
Primers and construction of internal standards
The oligonucleotide primers were synthesized at DNA Technology (Aarhus, Denmark) or by MWG (Ebersberg, Germany).
For quantification of the Heg RNA we used the following set of primers.
Upper primer 5′-GCG CCT GGT ATT AGA T-3′
Lower Primer 5′-CTT TTT CAT ATC CCG ATC TT-3′
CD14 mRNA
Upper primer 5′-TTC TAA AGC GCG TCG ATG C-3′
Lower primer 5′-ATT CTG GAT GGC CGG GAA CTT-3′
NUCKS mRNA
Upper primer 5′-ACG GCA GGC GGC ATC TAA-3′
Lower primer 5′-CTG GCA GGC TTT CCG GTT CC-3′ (or 5′-CTG GCG GGC TTT CCG GTT CC-3′)
NF-κB 1 mRNA
Upper primer 5′-TGA TGC CCA TGT GGA CAG TA-3′
Lower primer 5′-GCG CCA GAG TAG CCC AGT T-3′
GCR α/α2 mRNA
Upper primer 5′-GTA TTG AAT TCC CCG AGA TG-3′
Lower primer 5′-ACA GAC TTT GGG CAC TGG-3′
CK2 mRNA
Upper primer 5′-AGG CCC TGG ATT ATT GTC AC-3′
Lower primer 5′-CGA GAG TGT CTG CCC AAG AT-3′
An internal standard DNA for Heg and all mRNAs was constructed using the above-mentioned sets of primers and the PCR-MIMICTM construction kit from Clontech (BD Biosciences Clontech, Palo Alto, CA). An internal standard RNA for Heg, CD14, Nucks, NF-κB and CK2 was constructed as described earlier [3]. The resulting internal standard RNA was quantified by UV-detection (BioPhotometer, Eppendorf). The resulting RT-PCR products were indistinguishable from the internal standard DNA. The construction of the GCRα RNA was done in a somewhat different way.
The size of the internal standard was designed to be 239 bp for Heg, 240 bp for CD14, 238 bp for Nucks, 239 bp for NF-κB 1, 240 bp for CK2 and 183 for GCRα. Amounts of internal RNA standard added to RT-PCR were for Heg 0·12, for CD14 4·36, for Nucks 0·36, for NF-κB 0·33, for CK2 0·57 and for GCRα 0·35, all expressed in amol.
Quantification of PCR products by HPLC
The HPLC system consisted of a TSK® DEAE-NPR column (4·6 mm I.D. × 35 mm) thermostated at 30°C. The pump was a WATERS Model 616 gradient pump controlled by Empower software, which was also applied for data acquisition and processing. Detection was by an Applied Biosystems Model 759A UV-detector at 254 nm.
The PCR product was quantified relative to the internal standard using areas and corrected for different sizes of the two products.
mRNA concentrations were expressed as amol mRNA/µg total RNA or as amol mRNA/µg DNA.
Validation of the technique
The amplification rate was always exponential at least up to the number of cycles applied. The standard curve was linear, provided the ratio of the unknown/standard area was in the interval 0·5 to 4.
Controls with no RT and no cDNA were run frequently. No contamination of sample mRNA with genomic DNA was observed.
The identity of the PCR-products was confirmed by dideoxy-sequencing using Applied Biosystems Big DyeTM Terminator Cycle Sequencing Ready Reactions Chemistries and an ABI 310 Applied Systems apparatus for separation and fluorescence detection.
The sensitivity of the assay was approximately 0·004 amol RNA corresponding to 5000 µAU × seconds.
Reproducibility
Based on 18 double determinations the calculated coefficient of variation for Heg, Nucks and CD14 was 14, 19 and 12% expressed per µg total RNA and 13, 20 and 15% expressed per µg DNA. The coefficient of variations for NF-κB and GCRα were analysed in six samples from a pool of MNC cells and calculated values were 12·4 and 9·5% expressed per µg total RNA, respectively.
Sequencing the Heg RNA
Sequencing was done by dideoxy-sequencing using Applied Biosystems Big DyeTM Terminator Cycle Sequencing Ready Reactions and an ABI 310 Applied Systems apparatus for separation and fluorescence detection. The SMARTTM RACE cDNA amplification kit (BD Biosciences Clontech) was applied for amplification of the 3′ and 5′ends of the RNA. The first strand synthesis was according to the protocol. To obtain adequate amounts of cDNA for sequencing the 5′end we used nested primers. The nested universal primer A was used as an upper primer and 5′-ACCGACTTTTACACGCCTTA was used as lower primer. Several sets of primers were applied for sequencing.
Northern blotting
The Heg probe was labelled with fluorescein and detected by the ECF signal amplification system (RPN 5750) obtained from Amersham Biosciences (Amersham, UK). Detection was on a FLA-3000 from Fujifilm (Stockholm, Sweden).
Studies of MNC during incubation before and after addition of specific siRNA, Heg and DRB
The MNC were isolated by density centrifugation through lymfoprepTM (Kabi, Oslo, Norway). Two ×106 MNC were added to 16 tubes, followed by the addition of 550 µl RPMI buffer. siRNA was obtained from MWG. Specific and unspecific (control) siRNAs were constructed as short 21 nucleotide strands of RNA in a staggered duplex. Nineteen nucleotides were doubled-stranded with two base overhangs. Control siRNA had no homology to any known gene. The Heg siRNA was constructed so it corresponded to the 3′ end or the 5′ end of Heg. In addition, two different siRNAs were constructed for silencing Nucks mRNA. Samples were incubated at 37°C in 5% CO2. A single-stranded fragment of the central part of Heg (949 bases) was constructed in the same way as we constructed specific standards [3].
A lipopolysaccharide (LPS) (Sigma, Brondby, Denmark) and DRB (Biomol, Exeter, UK), an inhibitor of caseine kinase 2 (CK2), and polymerase II were added to MNC in a final concentration of 100 ng/ml and 100 µmol, respectively. CK2 and polymerase II are of major importance for nuclear transcription activity and we wanted to examine if administration of DRB reduced gene expression of Heg and Nucks.
Thyroid hormones and TSH receptor autoantibodies
Thyroid hormone concentrations and TSH in serum were measured by chemiluminescence immunoassay.
The concentration of TSH receptor autoantibodies in serum was measured by radioimmunoassay (Brahms TRAk human RIA, Brahms, Germany). A value below 1 IU/l was considered normal and a value above 2 IU/l abnormal.
Statistics
The statistical analysis was performed by the SigmaStat programme version 3.1.1 (SPSS Inc., Chicago, IL, USA). The following statistical tests were applied: Student's t-test, the Spearman rank order test (Rs), one-way anova, linear regression analysis, multiple regression analysis and backward stepwise regression analysis. A P-value <0·05 was considered significant.
Results
The primers applied to foxp3 were not perfect for the unknown peak, but it was possible to amplify it and to obtain the DNA sequence of the fragment. The sequence was located by a BLAST search to a clone from the HUGO project (RP 11-212H11; AC119673.3).
The 5′ and 3′ends of the RNA were identified by the SmartTM Race cDNA Amplification Kit. The 5′end was located at base 40882 and the gene contained 4002 bases with the 3′end at 44883. Nucleotide nr. 40931 was recorded as a c and not as t as reported in AC119673.
With more data available from the 3′end we found that this end had been described (AF306939). The first seven bases in this sequence may be a cloning artefact and these nucleotides differ from our sequence but thereafter from base nr 8 in AF306939 = nr. 44281 to the 3′end (nr = 44 883) the two sequences are identical. No polyadenylation signal was observed. The size of Heg as evaluated by Northern blotting was approximately 4 to 6 kb. The sequence data have been submitted to the GenBank database under accession number EU137727.
The Heg gene overlaps the Nucks gene on the other strand. The Nucks gene is transcribed in a number of tissues (NM_022731; BC000805; AY823399).
Normal subjects
The mean Heg RNA level in MNC in 18 normal subjects averaged 0·15 ± 0·01 amol/µg DNA. Corresponding values for Nucks and CD14 mRNA were 1·26 ± 0·07 and 30 ± 3 amol/µg DNA. The calculated values were approximately twice as high, provided all concentrations were expressed per µg total (Qiaamp) RNA (Table 1).
Table 1.
Pertinent clinical data and gene expression levels in normal females and in untreated and treated female patients with Graves' disease. TRAk, TSH receptor autoantibodies in serum. Heg = a poly A(−) RNA transcript gene related to thyroid receptor autoantibodies.
| Age Years Mean range | Sex ♀ | TRAk Median ± range IU/l | Heg amol/µg total RNA | Heg amol/µg DNA | Nucks amol/µg total RNA | Nucks amol/µg DNA | CD14 amol/µg total RNA | CD14 amol/µg DNA | Duration Months Median range | |
|---|---|---|---|---|---|---|---|---|---|---|
| Normal subjects | 44 | 10 | 0·35 ± 0·01 | 0·15 ± 0·01 | 3·06 ± 0·17 | 1·26 ± 0·07 | 77 ± 12 | 30 ± 3 | ||
| 27–59 | ||||||||||
| Graves' disease | 48 | 16 | 10·9 | 0·29 ± 0·01 | 0·13 ± 0·01 | 2·06 ± 0·08 | 0·94 ± 0·07 | 62 ± 8 | 29 ± 4 | 0 |
| Untreated patients | 35–67 | 2·8–90 | ||||||||
| Graves' disease | 42 | 15 | 7 | 0·32 ± 0·02 | 0·14 ± 0·01 | 2·4 ± 0·13 | 0·97 ± 0·07 | 73 ± 14 | 28 ± 5 | 13 |
| Treated patients | 28–52 | 0·5–114 | 1–19 |
Stepwise backward regression analysis and multiple regression analysis showed that Heg RNA in normal subjects expressed either per amounts of total RNA or DNA was positively related to gene expression of Nucks (P < 0·001 in both situations) and negatively related to CD14 (P < 0·004 and 0·05; multiple regression r = 0·79 and 0·84, respectively). The values were similar to those observed in the group of treated patients with Graves' disease (Fig. 1; see below). Neither sex nor age played a significant role in this analysis.
Fig. 1.
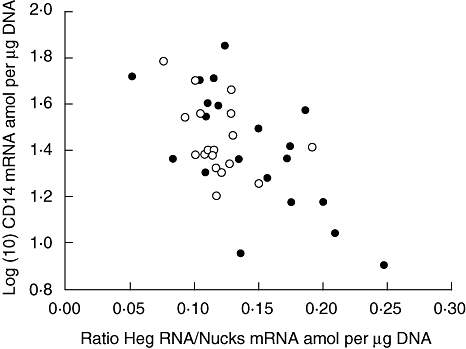
The relationship between log (10) CD14 mRNA amol per µg DNA in mononuclear cells plotted on the y-axis and the ratio Heg RNA/Nucks mRNA amol/µg DNA plotted on the x-axis. Data were obtained from 18 normal subjects (○) and 20 patients with treated Graves' disease (•) (P < 0·001; r = −0·60).
Patients with Graves' disease
There was no relationship in the untreated patients with Graves' disease between thyroid hormone levels and gene expression levels of Heg RNA, Nucks mRNA and CD14 mRNA expressed as amol/µg DNA. The mean Nucks mRNA amol/µg DNA concentration in the untreated patients was lower than in the normal group (one-way analysis of variance, P < 0·008, Table 1).
Stepwise backward regression analysis showed that TSH receptor autoantibody concentrations IU/l were negatively related to Heg RNA amol/µg DNA (P < 0·009; Fig. 2) but not to Nucks, CD14, GCRα, NF-κB or CK2 mRNA, all expressed in amol/µg DNA.
Fig. 2.
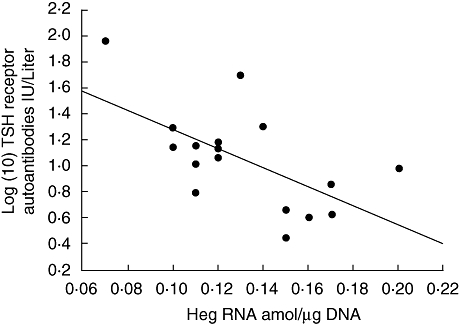
The negative correlation observed between the log (10) TSH receptor autoantibodies plotted on the y-axis and the concentration of Heg RNA/amol per µg DNA in mononuclear cells plotted on the x-axis. Results were obtained from 17 patients with untreated Graves' disease (P < 0·009; r = −0·61).
In the 20 patients with treated Graves' disease the thyroid hormone levels were normal in approximately half of the subjects, while some subjects showed minor changes in these parameters. There was no correlation between the dose of Thiamazol used to treat the patients and gene expression of CD14, Nucks and Heg. TSH receptor autoantibody concentrations IU/l were significantly lower compared with values obtained at the start of treatment (P < 0·004) and Nucks mRNA values tended to be normalized (Table 1). In this group of subjects TSH receptor autoantibody concentrations and Heg were not correlated, but CD14 was negatively correlated to the ratio between Heg RNA/Nucks mRNA amol per µg DNA (P < 0·005).
In the combined group of subjects with treated Graves' disease and normal subjects there was no correlation by simple regression analysis (or Spearman analysis) between CD14 and Nucks mRNA, whereas there was a significant negative correlation between CD14 mRNA and Heg RNA. Heg was positively correlated to Nucks, probably due to the fact that Heg and Nucks are transcribed from two strands of DNA, which to some extent overlap each other. The best description of the relationship between CD14 and Heg CD14 was obtained if a correction was made for the influence of Nucks on Heg. The data on the x-axis are therefore expressed as the Heg RNA/Nucks mRNA ratio (Fig. 1; P < 0·001).
In vitro studies and siRNA experiments
Figure 3 shows changes observed in Heg RNA, and Nucks, CD14, NF-κB and GCRα mRNA during incubation of MNC in a RPMI buffer for 20 h. Basal values were Heg 0·09, Nucks 1·1, CD14 53·0, GCRα 0·13 and NF-κB 0·31 amol/µg DNA. Heg RNA and Nucks and CD14 mRNA showed a peak value at 1 h. GCRα mRNA and NF-κB mRNA amol/µg DNA peaked at 6 h and then decreased. There was no change in the total concentration of DNA during the incubation period. The changes observed were spontaneous in the sense that no growth factor was added to the incubation medium and the changes may be due to apoptosis.
Fig. 3.

Gene expression of Heg, Nucks, CD14, NF-κB and GCRα in mononuclear cells expressed in percentage of basal values and plotted versus the incubation period expressed in hours.
Heg siRNA, Nucks siRNA and control siRNA added to the incubation medium in concentrations from 50 to 400 nmol resulted in unspecific reactions. In five mainly short-term experiments NF-κB was significantly increased at 6 h and more in Heg siRNA samples than in controls without siRNA (3·34 versus 2·48 amol/µg DNA (P < 0·02). Heg RNA did not change. In three experiments with Nucks siRNA, which lasted approximately 2 days, CD14 mRNA decreased markedly (P < 0·001). CD14 mRNA in Nucks siRNA or scrambled siRNA samples decreased more than in control samples without siRNA and to the same extent (Table 2; P < 0·001). Nucks mRNA did not decrease.
Table 2.
Effect of scrambled siRNA on CD14 mRNA amol/µg DNA.
| Experiment | 0 h | 30 h | P | |
|---|---|---|---|---|
| Scrambled siNA | 0 | 0 | 50 nM | |
| CD14 mRNA amol/µg DNA | ||||
| 16 ± 1·0 | 6 ± 0·7 | 2 ± 0·5 | < 0·001 | |
Samples (n = 16) were incubated for 30 h. P denotes the difference between values after 30 h of incubation with and without scrambled siRNA added.
In two additional experiments we added a single-stranded fragment of the central part of Heg RNA consisting of 949 bases to MNC in a final concentration of 5 nmol. There was no change in CD14 mRNA in the control experiment after 24 h. In the experiment with the addition of the single-stranded RNA fragment CD14 mRNA decreased significantly over time from 24 to zero amol/µg DNA at 24 h (P < 0·001). Figure 4 shows the results of the second experiment. In the control experiment CD14 mRNA did not change after 24 h. In the experiment where the Heg fragment was added, CD14 mRNA concentrations decreased from 23 ± 1·2 to 1 ± 0 amol/µg DNA at 24 h (P < 0·001).
Fig. 4.
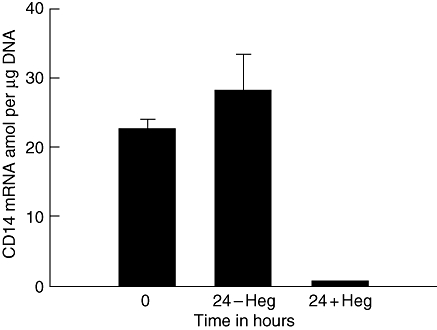
CD14 mRNA amol per µg DNA plotted on the ordinate. Results are basal values and values at 24 h incubation without (–) and with (+) addition of the Heg fragment (P < 0·001).
The LPS added to MNC in a concentration of 100 ng/ml decreased CD14 mRNA from 17 to 11 amol per µg DNA after 20 h of incubation (38%; P < 0·003).
To analyse to what extent Heg was related to the general level of transcriptional activity we analysed the gene expression level of CK2 (caseine kinase 2) in the group of patients with untreated Graves' disease. We found a strong correlation between CK2 and Nucks mRNA (P < 0·001; r = 0·89). Inhibition of CK2 with DRB during a 20-h experiment decreased Heg to zero values (P < 0·002) and Nucks mRNA from 1·05 ± 00 amol/µg DNA in the control experiment to 0·10 ± 0·01 amol/µg DNA with DRB (P < 0·001). This response was probably due to inhibition of polymerase II. Expressions of other genes were also inhibited.
Discussion
Gene expression is measured in our laboratory by RT-PCR-HPLC. HPLC is applied to separate DNA products of the added specific RNA standard and the mRNA under study. During a study of gene expression of foxp3 we observed an unknown peak, and the area of this peak was related to CD14 mRNA as measured in the same study in a small group of subjects. We were able to amplify the peak and to obtain the DNA sequence. The sequence of the fragment was localized to a clone from the HUGO project (RP11-212H11). The 5′ and 3′ends were identified by the SmartTM Race cDNA Amplification Kit and 4002 bases were identified. When the sequence of the 3′end was available we found that this had been described earlier as an unknown mRNA (AF306939). The first seven bases of this sequence differ from our sequence, but the sequence from base 8 in AF306939 to the 3′end is the same. No polyadenylation signal was observed and the gene is therefore best described as a poly A(−) RNA transcript. The shorter transcript of Heg was isolated using a small stress protein (H11) as bait in a screen. H11 is present in muscle tissue and in heart muscle and may play a role in both proliferation and apoptosis [4].
The Heg gene overlaps the Nucks gene, which is located on the other strand. Although it has been assumed that only one of the two strands could be transcribed, it is now well established that both the sense and antisense strand may be transcribed. Furthermore it has been demonstrated that there is a large class of poly A(−) RNA transcript in human cells. Most poly A(−) RNA transcripts are not translated into proteins. Some of the non-coding sequences have regulatory functions [1,2].
Apart from the description of Heg RNA the present study shows that Heg was inversely related to the plasma concentration of TSH receptor autoantibodies in patients with early and untreated Graves' disease and to CD14 mRNA in normal subjects and in treated patients with Graves' disease.
The addition of siRNA and LPS to MNC decreased CD14 mRNA. It was surprising that specific siRNA decreased CD14 mRNA, but not the level of specific mRNA. This result is, however, in accordance with the finding by Kleinman et al., that non-specific siRNA may bind directly to toll-like receptor 3 [5].
We also applied single-stranded RNA derived from Heg RNA, which resulted in a pronounced decrease in CD14 mRNA, although the concentration of RNA was 10-fold lower than in the experiments with double-stranded RNA.
It is not clear how activation of CD14 and most likely the toll-like receptor complex decreased gene expression of CD14 mRNA, but this may be related to activation of NF-κB, although we did not find any clear relationship between NF-κB and CD14 mRNA.
There was no mRNA inside in MNC, which was negatively correlated to CD14 mRNA apart from Heg. Non-coding and coding RNA are handled differently in the cytoplasma and broken down at different sites [6]. Some toll-like receptors which engage RNA are found inside cells [7]. Most likely Heg due to its location or affinity may bind to a protein in the CD14/toll-like receptor complex and activate the system, which will decrease CD14 mRNA. Furthermore, single-stranded RNA may bind to MAVS in the outer mitochondrial membrane and increase interferon production. Activation of these systems may result in both pro-inflammatory and anti-inflammatory responses [8]. Heg may therefore have an inhibitory effect on gene expression of CD14 and an inhibitory effect on the early phase of TSH receptor autoantibody production. Macrophage-like cells in the lymph nodes may present antigens to B cells and thereby initiate antibody responses [9]. We have started a new study of anti-inflammatory signalling substances, which may relate to Heg, and this study also includes measurements of TNFα and caspase 3.
It is not clear at present if the relationship between Heg and TSH receptor autoantibodies is specific for Graves' disease or Heg may have a more general inhibitory effect on autoantibody production. It may therefore be of interest to study Heg and autoantibodies in other autoimmune diseases and antibodies induced by first-time vaccination.
In conclusion, we have described a transcript that is inversely related to CD14 mRNA in normal subjects and to TSH receptor autoantibodies in patients with untreated Graves' disease. Furthermore, addition of Heg RNA to MNC decreased CD14 mRNA markedly.
Acknowledgments
Music publishers Agnes og Knut Mørks Foundation, Toyota Fonden (Denmark) and The A.P. Møller Foundation for the Advancement of Medical Science are thanked for financial support. We thank Karen Andersen and Tonni Løve Hansen for excellent technical assistance.
References
- 1.Storz G. An expanding universe of noncoding RNAs. Science. 2002;296:1260–3. doi: 10.1126/science.1072249. [DOI] [PubMed] [Google Scholar]
- 2.Chapman EJ, Carrington JC. Specialization and evolution of endogenous small RNA pathways. Nat Rev Genet. 2007;8:884–96. doi: 10.1038/nrg2179. [DOI] [PubMed] [Google Scholar]
- 3.Engstrom T, Bratholm P, Vilhardt H, Christensen NJ. Beta2-adrenoceptor desensitization in non-pregnant estrogen-primed rat myometrium involves modulation of oxytocin receptor gene expression. J Mol Endocrinol. 1998;20:261–70. doi: 10.1677/jme.0.0200261. [DOI] [PubMed] [Google Scholar]
- 4.Hase M, Depre C, Vatner SF, Sadoshima J. H11 has dose-dependent and dual hypertrofic and proapoptotic functions in cardiac myocytes. Biochem J. 2005;388:475–83. doi: 10.1042/BJ20041314. [DOI] [PMC free article] [PubMed] [Google Scholar]
- 5.Kleinman ME, Yamada K, Takeda A, et al. Sequence- and target-independent angiogenesis suppression by siRNA via TLR3. Nature. 2008;452:591–7. doi: 10.1038/nature06765. [DOI] [PMC free article] [PubMed] [Google Scholar]
- 6.Goldstrohm AC, Wickens M. Multifunctional deadenylase complexes diversify mRNA control. Nat Rev Mol Cell Biol. 2008;9:337–44. doi: 10.1038/nrm2370. [DOI] [PubMed] [Google Scholar]
- 7.Kim Y, Brinkmann MM, Paquet M, Ploegh HL. UNC93B1 delivers nucleotide-sensing toll-like receptors to endolysosomes. Nature. 2008;452:234–8. doi: 10.1038/nature06726. [DOI] [PubMed] [Google Scholar]
- 8.An H, Hou J, Zhou J, et al. Phosphatase SHP-1 promotes TLR- and RIG-1-activated production of type I interferon by inhibiting the kinase IRAK1. Nat Immunol. 2008;9:542–50. doi: 10.1038/ni.1604. [DOI] [PubMed] [Google Scholar]
- 9.Phan TG, Grigorova I, Okada T, Cyster JG. Subcapsular encounter and complement-dependent transport of immune complexes by lymph node B cells. Nat Immunol. 2007;8:992–1000. doi: 10.1038/ni1494. [DOI] [PubMed] [Google Scholar]