FIGURE 2.
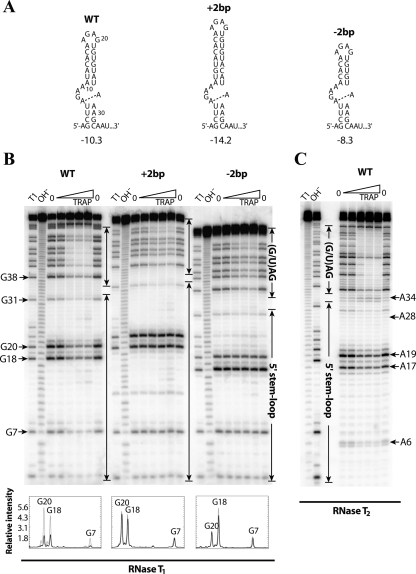
In vitro characterization of 5′SL upper stem mutants. (A) Secondary structures of the wild-type (WT) and mutant 5′SL structures with an (+2bp) insertion or (−2bp) deletion of 2 bp in the upper stem. The predicted free energy value (in kilocalories per mole, kcal/mol) at 37°C (Zuker 2003) is shown below each structure. (Dashed line) The potential noncanonical A-A base pair within the internal loop. (B) RNase T1 footprinting of the WT 5′SL and of the upper-stem-length mutants at various TRAP concentrations. The transcripts contained five downstream triplet repeats. Compared to the WT transcript, G18 and G20 are 2 nt longer or shorter in the +2bp and −2bp mutant transcripts, respectively. A densitometry analysis of the bands corresponding to G7, G18, and G20 from the WT and mutant 5′SL structures is included below the gel. (Gray lines) The relative intensity of the annotated nucleotides in the absence of TRAP; (black lines) the relative intensity of these nucleotides at the highest TRAP concentration that was investigated (2500 nM). Band assignments are numbered relative to the WT 5′SL. (C) RNase T2 footprinting of the WT 5′SL with eight downstream triplet repeats. (B,C) Important residues are labeled to the side of the gels. (Enclosed arrows) Nucleotides corresponding to the (G/U)AG triplet repeat region and the 5′SL. Denaturing RNase T1 digestion (T1) and base hydrolysis (OH−) ladders are shown.

