Abstract
A rapid, sensitive and specific method was developed and validated using LC/MS/MS for determination of sunitinib in human plasma. Sample preparation involved a liquid-liquid extraction by the addition of 0.2 mL of plasma with 4.0 mL tert-butyl-methyl-ether extraction solution containing 25 ng/mL of the internal standard clozapine. Separation of compounds was achieved on a C18 (50 × 2.1 mm i.d., 3.5 µm) analytical column using a mobile phase consisting of acetonitrile/H20 (65:35, v/v) containing 0.1% formic acid and isocratic flow at 0.150 mL/min for 3 minutes. The analytes were monitored by tandem-mass spectrometry with electrospray positive ionization. Linear calibration curves in human plasma were generated over the range of 0.2 to 500 ng/mL with values for the coefficient of determination of >0.9950. Within-and between day precision and accuracy were ≤ 10%. The method was applied to the quantitation of sunitinib in plasma samples from a patient receiving daily oral therapy with sunitinib.
Keywords: Sunitinib, LC/MS/MS, Pharmacokinetics
1. Introduction
Receptor tyrosine kinases such as c-KIT, fms-like tyrosine kinase 3 (FLT3), platelet-derived growth factor receptor (PDGFR), and vascular endothelial growth factor receptor (VEGFR) play important roles in regulating cell proliferation, differentiation, and survival by activating downstream effectors such as signal transducers and activators of transcription (STAT), protein kinase B/AKT, and extracellular signal-regulated kinases (ERK)-1/2 [1–4]. Multitargeted tyrosine kinase inhibitors that have activity against various aberrant receptor tyrosine kinases are a new and promising class of therapeutic agents for the treatment of solid tumors and hematological malignancies. Sunitinib malate (SU 11248, Sutent®, Pfizer, Inc., New York), a small-molecule multitargeted tyrosine kinase inhibitor with activity against c-KIT, FLT-3, PDGFR, and VEGFR, among a multitude of other kinases [5], is approved for the treatment of advanced RCC and imatinib-resistant GISTs [6], and is being evaluated for the treatment of a variety of solid tumors and acute myelogenous leukemia [7,8].
The approved dose of sunitinib is 50 mg administered once daily for 4 weeks every 6 weeks, although continuous dosing schedules with no break are being evaluated. After oral administration, maximum sunitinib plasma concentrations are reached between 6 and 12 hours, and the terminal half life ranges from 40 to 60 hours [6,9]. Consequently, steady-state is reached in approximately 2 weeks with the achievement of concentrations 3.0 – 5.5-fold higher than those on day 1. Sunitinib is metabolized primarily by cytochrome P-450 3A4 (CYP3A4) with 61% of the administered dose excreted in the feces [6]. As most drugs that are metabolized by CYP3A4, sunitinib exhibits wide pharmacokinetic variability with a coefficient of variation for clearance of approximately 50% [6]. Elevated sunitinib exposure has been related to common side effects such as fatigue and elevations in diastolic blood pressure.
To further characterize the clinical pharmacokinetic and pharmacodynamic profile of sunitinib in post-approval phase IV studies, as well as during the clinical development of sunitinib in other adult and childhood cancers, details of a specific, reproducible and accurate method for the quantitation of sunitinib is necessary. The analytical assays used to characterize the plasma pharmacokinetics in phase I trials were based on high performance liquid chromatography with tandem mass spectrometric detection (LC/MS/MS) with a lower limit of quantitation of 0.1 ng/mL, but they were not described in enough detail (e.g. plasma extraction procedure, chromatography conditions etc.) for duplication in other laboratories [8,10,11]. In addition, the internal standard used was deuterated sunitinib which is expensive and not readily available to investigators. One other method based on LC/MS/MS has been described for quantitation of sunitinib in monkey tissues with a lower limit of quantitation of 2 ng/g. Here, we describe a rapid, sensitive analytical method, using clozapine as the internal standard, for the determination of sunitinib concentrations in human plasma based on LC/MS/MS after liquid-liquid extraction with tert-butyl-methyl-ether. The calibration curve ranges from 0.2 – 500 ng/mL, which based on previous published pharmacokinetic data, should be sufficient to characterize the clinical pharmacology of sunitinib as a single agent as well as when evaluated in combination regimens.
2. Experimental
2.1 Chemical and reagents
Sunitinib Malate (Lot number 8-SSR-9-1, 98.0% pure by HPLC) was obtained from Toronto Research Chemicals Inc (North York, ON, Canada). The internal standard, clozapine (Lot number 010K1204, 99% pure by TLC), and tert-butyl-methyl-ether (TBME) (HPLC grade) were obtained from Sigma-Aldrich (St. Louis, MO, USA). Formic acid (98%, v/v in water) was obtained from EM Science (Gibbstown, NJ, USA). Methanol (HPLC grade) and acetonitrile (HPLC grade) were obtained from Burdick & Jackson (Muskegon, MI, USA). Deionized water was obtained from a Milli-Q-UF system (Millipore, Memphis, TN, USA) and used throughout in all aqueous solutions. Drug-free (blank) human plasma from healthy donors was obtained from the Blood Bank at St. Jude Children’s Research Hospital (Memphis, TN, USA).
2.2 Stock solutions, calibration standards, and quality control samples
Stock solutions of sunitinib (molecular weight of free base, 398.474) at a concentration of 0.333 mg/mL were prepared in duplicate by dissolving 1.12 mg and 1.15 mg in 2.463 mL and 2.529 mL of methanol, respectively. Stock solutions were divided into 200 µL aliquots and stored in 1.0 mL polypropylene tubes at − 20°C. The stock solutions were diluted in blank human plasma on each day of analysis to prepare 7 calibration standards in duplicate containing sunitinib for human plasma samples at the following concentrations: 0.2 ng/mL, 1.0 ng/mL, 5.0 ng/mL, 10.0 ng/mL, 50.0 ng/mL, 100.0 ng/mL and 500.0 ng/mL. Quality control (QC) samples were prepared independently in blank plasma at five different concentrations for sunitinib including: 0.2 ng/mL, the lower limit of quantitation (LLOQ); 0.6 ng/mL, the low QC (LQC); 25 ng/mL, the medium QC (MQC); 400 ng/mL, the high QC (HQC); and 1000 ng/mL, the above the upper limit of quantitation (AULQ), which was diluted 10x before analysis with blank human plasma.
2.3 Sample preparation
Prior to extraction, frozen samples were thawed in a water bath at ambient temperature. During validation, calibration standards and quality controls were prepared fresh daily except for stability testing. A 0.2 mL aliquot of plasma was added to a borosilicate glass test tube (13×100 mm) containing 4.0 mL of TBME solution and clozapine (25 ng/mL), which was used as internal standard. The tube was mixed vigorously for 10 seconds on a vortex-mixer, followed by centrifugation at 5,000 rpm for 10 minutes at ambient temperature. A volume of 3.5 mL of the top organic layer was transferred to a borosilicate glass test tube (13×100 mm) and dried under nitrogen gas. Samples were reconstituted in 100 µL of 50% acetonitrile, transferred to a 250-µl polypropylene autosampler vial, sealed with a Teflon crimp cap, and a volume of 40 µl was injected onto the HPLC instrument for quantitative analysis using an autosampler operating at room temperature.
2.4 Chromatographic and mass-spectroscopic conditions
Chromatographic analysis was performed using a Waters Model 2695 separations system (Milford, MA, USA). Separation of the analytes from potentially interfering material was achieved at ambient temperature using Waters X-Terra MS column (50 × 2.1 mm i.d.) packed with a 3.5-µM ODS stationary phase, protected by a guard column packed with 3.5 µm RP18 material (Milford, MA, USA) using a temperature-controlled column heating device operating at 30°C. The mobile phase used for the chromatographic separation was composed of acetonitrile-deionized H2O (65:35, v/v) containing 0.1% formic acid, and was delivered isocratically at a flow rate of 0.150 mL/min. The column effluent was monitored using a Micromass Quattro LC triple-quadrupole mass-spectrometric detector (Beverly, MA, USA). The instrument was equipped with an electrospray interface, and controlled by the Masslynx version 4.1 software (Micromass), running under Microsoft Windows XP on a IBM ThinkCentre Pentium 4HT computer. The samples were analyzed using an electrospray probe in the positive ionization mode operating at a cone voltage of 30 V for sunitinib and the internal standard. Samples were introduced into the interface through a heated nebulized probe (350°C). The spectrometer was programmed to allow the [MH]+ ion of sunitinib at m/z 399.0 and that of the internal standard at m/z 327.0 to pass through the first quadrupole (Q1) and into the collision cell (Q2). The collision energy was set at 30 eV for sunitinib and the internal standard. The product ions for sunitinib (m/z 283.0) (Figure 2) and the internal standard (m/z 270.0) (data not shown) were monitored through the third quadrupole (Q3). Argon was used as collision gas at a pressure of 2.0×10⁻⁴ mbar, and the dwell time per channel was 0.9 sec for data collection.
Figure 2.
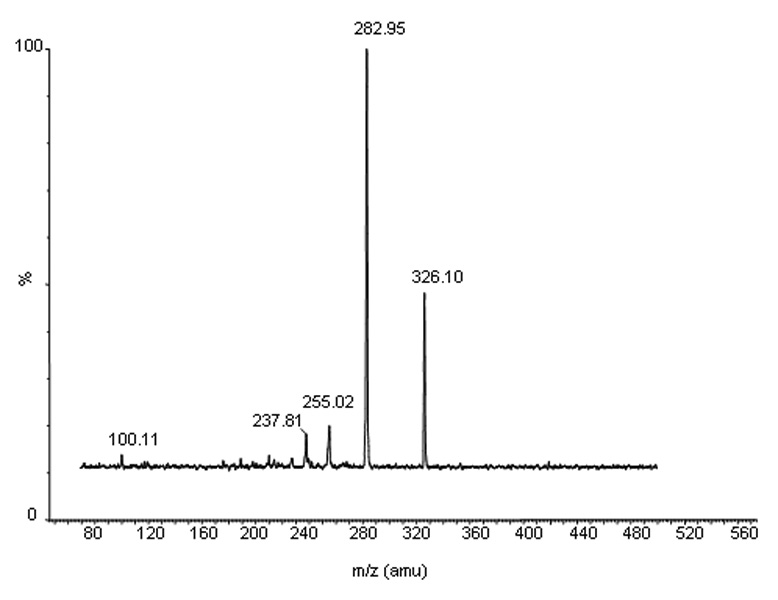
The mass spectra of a daughter scan for m/z 399. Formed by CID of m/z 399, the selective product ion at m/z 283 is illustrated.
2.5 Calibration curves
Calibration curves for sunitinib were computed using the ratio of the peak area of analyte and internal standard by using a weighted (1/[nominal concentration]) least-squares linear regression analysis. The parameters of each calibration curve were used to compute back-calculated concentrations and to obtain values for the QC samples and unknown samples by interpolation.
2.6 Method validation
Method validation runs for human plasma calibrator standards and QCs were performed on four separate days and included a calibration curve processed in duplicate and QC samples, at five different concentrations, in quintuplicate. The accuracy and precision of the assay was assessed by the mean relative percentage deviation (DEV) from the nominal concentrations and the within-run and between-run precision, respectively. The accuracy for each tested concentration was calculated as:
Estimates of the between-run precision were obtained by one-way analysis of variance (ANOVA) using the run day as the classification variable. The between-groups mean square (MSbet), the within-groups mean square (MSwit), and the grand mean (GM) of the observed concentrations across runs were calculated using the JMP™ statistical discovery software version 6 (SAS Institute, Cary, NC, USA). The between-run precision (BRP), expressed as a percentage relative standard deviation, was defined as:
where n represents the number of replicate observations within each run. For each concentration, the estimate of the within-run precision (WRP) was calculated as:
The specificity of the method was tested by visual inspection of chromatograms of extracted human plasma samples from 6 different donors for the presence of endogenous or exogenous interfering peaks. The peak area needed to be less than 20% than the peak area for sunitinib 0.2 ng/mL in an aqueous solution. If not, plasma from 6 additional donors would be tested. The extraction efficiency of the assay was measured by comparison of the peak area ratio of sunitinib extracted from plasma and an aqueous solution in triplicate at concentrations of the low, middle, and high QCs. The stability of sunitinib in plasma was tested at concentrations of the low and high QCs in triplicate after 4 freeze-thaw cycles. The long-term stability test was assessed at the low and high QCs in triplicate at −70°C at 164 days. The short-term stability of sunitinib in plasma was assessed in triplicate at room temperature (on the benchtop) for 6 hours. Stability of drug in neutral extracts (e.g. extracted from plasma and reconstituted with 50% acetonitrile) was assessed in single injection on the autosampler at 10 °C at 7 hours.
2.7 Pharmacokinetic analysis
The patient studied was receiving sunitinib 25 mg administrated once daily for 4 weeks every 6 weeks. Pharmacokinetic studies were approved by the CME Review Board of the Leiden University Medical Center, Leiden, the Netherlands, and the patient provided written informed consent.
Pharmacokinetic studies were performed during the 7th cycle of sunitinib administration. Blood samples were collected in heparin-containing tubes before drug administration and at 1, 2, 4, 6, 8, and 24 hours after administration of the sunitinib. A single pre-treatment trough sample was obtained at steady-state after 4 weeks of daily dosing. Samples were processed immediately by centrifugation for 10 minutes at 1,000 g at 4°C. Plasma supernatant was stored at −70°C until subsequent analysis. Samples were thawed and processed as described in section 2.3 Sample preparation.
Sunitinib pharmacokinetic parameters were determined by standard noncompartmental methods in the program WinNonlin version 5.1 (Pharsight Corporation, Mountain View, CA). The maximum plasma concentration (Cmax) and the time of Cmax (Tmax) after oral administration were obtained by visual inspection of the plasma concentration-time curve. The area under the plasma concentration-time curve (AUC) value was calculated to the last quantifiable sample (AUClast) by use of the linear up/log down trapezoidal rule. The pre-treatment trough concentration at steady-state (Css,min) was the observed value.
3. Results and Discusssion
3.1 Detection and chromatography
The mass spectrum of sunitinib showed a protonated molecular ion ([MH+]) at m/z 399.0. The major fragment observed was at m/z 283.0, which was selected for subsequent monitoring in the third quadrupole (Fig. 2). The mass spectrum of the internal standard, clozapine, showed a [MH+] at m/z 327.0, and the high collision energy gave a major product ion at m/z 270.0 (data not shown).
No peaks were observed in the chromatograms of blank plasma from 6 donors when monitored for sunitinib (data not shown). Representative chromatograms of blank human plasma and plasma spiked with internal standard and sunitinib are shown in Figure 3 and Figure 4. Sunitinib and the internal standard, clozapine, had similar retention under optimal conditions at 1.2 ± 0.2 minutes with an overall chromatographic run time of 3 minutes. The selectivity for the analysis is shown by symmetrical resolution of the peaks, with no significant chromatographic interference around the retention times of the analytes and internal standard in drug-free specimens. The extraction efficiency of sunitinib from plasma was 40.5%, 39.2%, and 46.1% at the low, medium, and high QC concentrations. The extraction efficiency of the internal standard clozapine was 62%.
Figure 3.
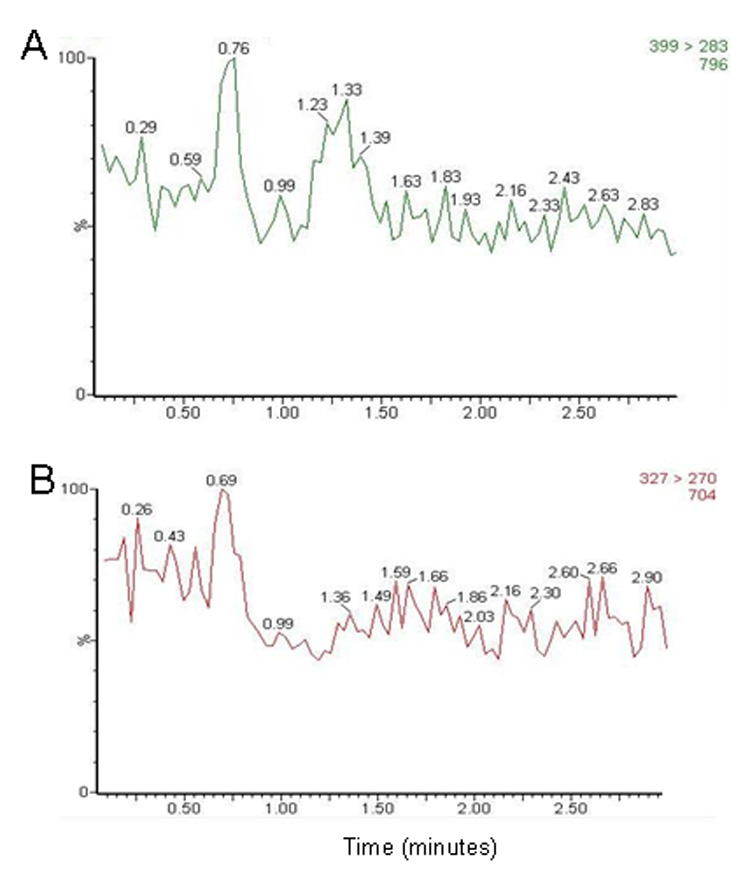
Chromatograms of blank human plasma for monitoring of (A) m/z 399 → 283 (for sunitinib) and (B) m/z 327 → 270 (for internal standard).
Figure 4.
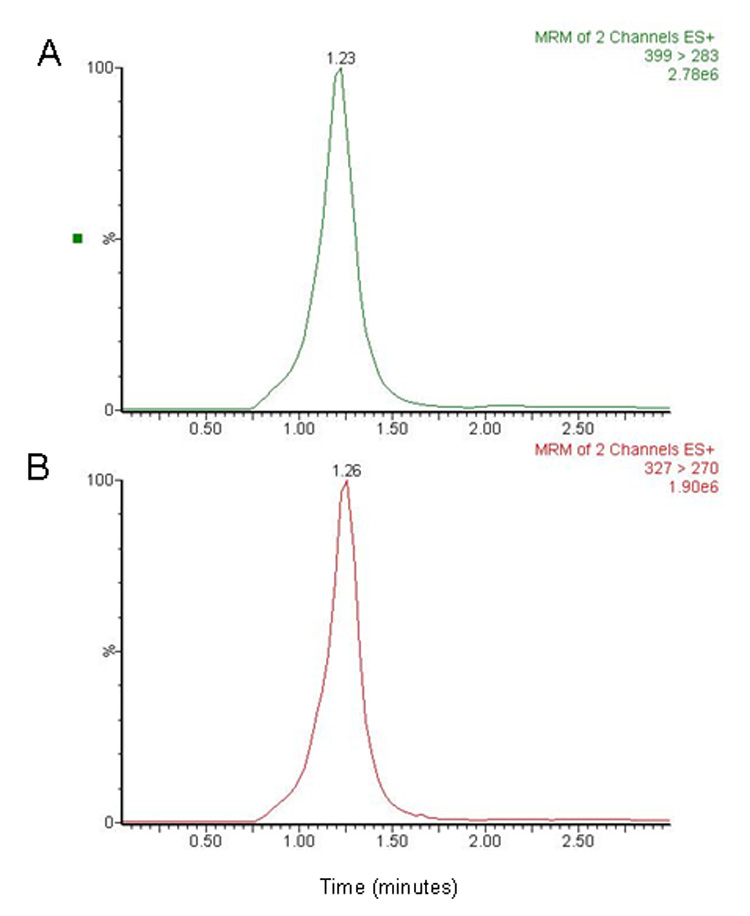
Chromatograms of plasma spiked with (A) sunitinib 100 ng/mL and (B) the internal standard 25 ng/mL. The retention times for sunitinib and internal standard were approximately 1.2 ± 0.2 minutes.
3.2 Linearity of detector responses
The calculated peak area ratios of sunitinib to the internal standard versus the nominal concentration of the analyte displayed a linear relationship in the tested range of 0.2 to 500 ng/mL. A weighting factor, which is inversely proportional to the variance at the given concentration level (x) was used. This weighting factor was chosen compared to uniform weighting after evaluation of goodness-of-fit by assessment of the R2 value, intercept closest to a zero value, % recovery of calibrators and QCs, and assessment of residuals. After applying the peak area ratio in combination with a weighting factor of 1/x, a mean least-squares linear-regression correlation coefficient of great than 0.9950 was obtained in all analytical runs.
For each point on the calibration curves for sunitinib concentrations were always within 5% of the nominal value (Table 1). A linear regression of the back-calculated concentrations versus the nominal values provided a unit slope and an intercept not significantly different from zero (data not shown). The distribution of the residuals showed random variation, was normally distributed, and centered on zero (data not shown).
Table 1.
Back-calculated concentrations from calibration curves over the concentration range of 0.2 to 500 ng/mL.a
| Nominal Concentration (ng/mL) | |||||||
|---|---|---|---|---|---|---|---|
| 0.2 | 1.0 | 5.0 | 10.0 | 50.0 | 100 | 500 | |
| Accuracy (%) |
102.8 | 98.4 | 98.4 | 100.2 | 99.4 | 101.0 | 99.9 |
| Concentration | 0.21 ± | 0.98 ± | 4.9 ± | 10.0 ± | 49.7 ± | 101.0 ± | 499.4 ± |
| (ng/mL) | 0.031 | 0.077 | 0.46 | 0.42 | 2.1 | 6.4 | 28.5 |
| Precision (%) | |||||||
| Within-run | 12.4 | 9.9 | 2.7 | 3.8 | 4.9 | 8.0 | 7.5 |
| Between-run | 8.9 | b | 9.8 | 1.9 | b | b | b |
| No. of samples |
8 | 8 | 8 | 8 | 8 | 8 | 8 |
Performed in duplicate on 4 separate days.
No significant variation was observed as a result of performing the assay in different runs.
The LLOQ for sunitinib was established at 0.2 ng/mL for human plasma, which was associated with a mean signal-to-noise ratio of 33.4 from 20 observations.
3.3 Accuracy and precision
For QC samples prepared by spiking human plasma with sunitinib, the within-run and between-run variability (precision), expressed as the percentage relative standard deviations, was ≤ 10% (Table 2). Likewise, the mean predicted concentration (accuracy) was ≤ 6% of the nominal value (Table 2).
Table 2.
Assessment of accuracy and precision.
| Nominal Concentration (ng/mL) | |||||
|---|---|---|---|---|---|
| 0.2 | 0.6 | 25 | 400 | 1000b | |
| Accuracy (%)a | 96.7 | 98.4 | 105.8 | 98.4 | 98.4 |
| Concentration | 0.19 ± | 0.59 ± | 26.5 ± | 393.7 ± | 95.3 ± |
| (ng/mL)a | 0.025 | 0.013 | 2.3 | 29.3 | 6.4 |
| Precision (%)a | |||||
| Within-run | 9.4 | 5.7 | 5.5 | 4.3 | 7.2 |
| Between-run | 10.1 | 8.5 | 7.8 | 5.9 | 2.2 |
| No. of samples | 20 | 20 | 20 | 20 | 20 |
Performed in quintuplicate on four separate days
Above the assay upper limit of quantitation QC of 1000 ng/mL diluted 1:10 with matrix to a final concentration of 100 ng/mL.
3.4 Analyte stability
QC samples prepared in human plasma undergoing three freeze-thaw cycles showed no significant degradation (< 10%) for sunitinib. Plasma spiked with sunitinib stored at room temperature for up to 6 hours indicated that sunitinib was stable during this time period (Table 3). Long-term stability studies indicated that sunitinib was stable (< 10%) in human plasma when stored at −70 °C for 164 days.
Table 3.
Assessment of stability in plasmaa
| Condition | Sunitinib | |
|---|---|---|
| 0.6 ng/mL | 400 ng/mL | |
| Freeze-thaw stability (−70°C)b | ||
| Cycle 1 | 100.8 | 99.5 |
| Cycle 2 | 99.6 | 93.3 |
| Cycle 3 | 103.3 | c |
| Cycle 4 | 104.3 | 90.1 |
| Short-term stability (room temperature)b | ||
| Time = 1.0 h | 100.0 | 99.58 |
| Time = 2.0 h | 89.39 | 106.68 |
| Time = 4.0 h | 87.91 | 111.21 |
| Time = 6.0 h | 96.3 | 94.14 |
| Long-term stability (−70°C)b | ||
| Time = 164 days | 91.4 | 91.4 |
Expressed as the mean percentage change from time zero (nominal concentration).
Performed in triplicate.
Not done.
A stock solution of sunitinib 0.333 mg/mL dissolved in methanol was stable at room temperature for 6 hours (99.9% of nominal concentration) and was stable at 38 days when stored at −20 °C (102.2% of nominal concentration). In neutral extracts, sunitinib was stable up to 7 hours on the autosampler without any significant degradation, allowing for more than 70 samples to be analyzed simultaneously within a single chromatographic run.
3.5 Plasma concentration–time profile
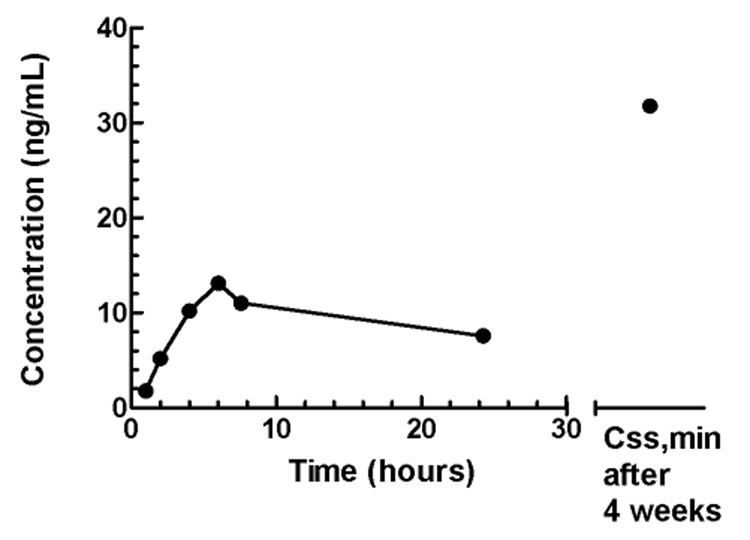
This LC/MS/MS method was applied to the quantitation of sunitinib in plasma samples from a patient who received sunitinib administered at a dose of 25 mg once daily for 4 weeks every 6 weeks. Figure 5 shows the sunitinib plasma concentration–time profile on day 1. A Cmax of 13 ng/mL was reached at 6 hours, which declined to a concentration of 7.6 ng/mL at 24 hours post-treatment. The value for AUClast was 218 ng/mL*h. At steady-state after 4 weeks of daily dosing, Css,min was 32 ng/mL. The pharmacokinetic profile is consistent with previous reports in patients with cancer enrolled to phase I studies [8,11].
Figure 5.
Sunitinib plasma concentration-time profile on day 1 following administration of 25 mg once daily, and a pre-treatment trough concentration (Css,min) after 4 week of daily dosing.
4. Conclusion
In conclusion, we have developed and validated an assay for measuring sunitinib in human plasma. The assay lower limit of quantitation is 0.2 ng/mL, with a simple sample preparation procedure, and a rapid chromatographic run time of 3 minutes. These characteristics allow this assay to be easily applied to the quantitation of sunitinib in a large number of plasma samples. The sensitivity is similar to those previously described in human plasma (0.1 ng/mL) but the specific details of these assays have not been published [8,10,11]. Furthermore, the assay used a readily available internal standard that eluted at the same retention time as sunitinib. The described method for quantitation over the concentration range of 0.2 to 500 ng/mL is sufficient to allow plasma pharmacokinetic monitoring of sunitinib during daily, continuous administration. This method is being used to characterize the plasma pharmacokinetics and pharmacodynamics of sunitinib as a single agent or in combination therapy in adults and children with cancer.
Figure 1.
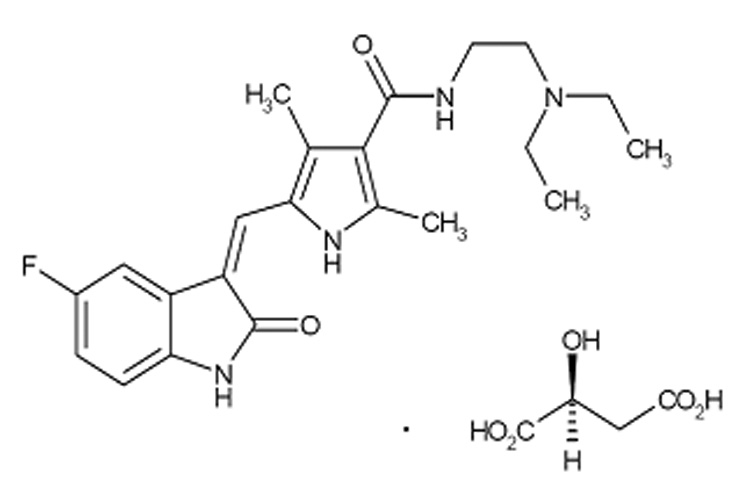
Chemical structure of sunitinib malate.
Acknowledgments
Grant support: American Lebanese Syrian Associated Charities (ALSAC) and United States Public Health Service Cancer Center Support Grant 3P30CA021765.
Footnotes
Publisher's Disclaimer: This is a PDF file of an unedited manuscript that has been accepted for publication. As a service to our customers we are providing this early version of the manuscript. The manuscript will undergo copyediting, typesetting, and review of the resulting proof before it is published in its final citable form. Please note that during the production process errors may be discovered which could affect the content, and all legal disclaimers that apply to the journal pertain.
REFERENCES
- 1.Kessler T, Fehrmann F, Bieker R, Berdel WE, Mesters RM. Curr Drug Targets. 2007;8:257. doi: 10.2174/138945007779940089. [DOI] [PubMed] [Google Scholar]
- 2.Parcells BW, Ikeda AK, Simms-Waldrip T, Moore TB, Sakamoto KM. Stem Cells. 2006;24:1174. doi: 10.1634/stemcells.2005-0519. [DOI] [PubMed] [Google Scholar]
- 3.Pietras K, Sjoblom T, Rubin K, Heldin CH, Ostman A. Cancer Cell. 2003;3:439. doi: 10.1016/s1535-6108(03)00089-8. [DOI] [PubMed] [Google Scholar]
- 4.Roskoski R., Jr Biochem Biophys Res Commun. 2005;338:1307. doi: 10.1016/j.bbrc.2005.09.150. [DOI] [PubMed] [Google Scholar]
- 5.Fabian MA, Biggs WH, 3rd, Treiber DK, Atteridge CE, Azimioara MD, Benedetti MG, Carter TA, Ciceri P, Edeen PT, Floyd M, Ford JM, Galvin M, Gerlach JL, Grotzfeld RM, Herrgard S, Insko DE, Insko MA, Lai AG, Lelias JM, Mehta SA, Milanov ZV, Velasco AM, Wodicka LM, Patel HK, Zarrinkar PP, Lockhart DJ. Nat Biotechnol. 2005;23:329. doi: 10.1038/nbt1068. [DOI] [PubMed] [Google Scholar]
- 6.Goodman VL, Rock EP, Dagher R, Ramchandani RP, Abraham S, Gobburu JV, Booth BP, Verbois SL, Morse DE, Liang CY, Chidambaram N, Jiang JX, Tang S, Mahjoob K, Justice R, Pazdur R. Clin Cancer Res. 2007;13:1367. doi: 10.1158/1078-0432.CCR-06-2328. [DOI] [PubMed] [Google Scholar]
- 7.Chow LQ, Eckhardt SG. J Clin Oncol. 2007;25:884. doi: 10.1200/JCO.2006.06.3602. [DOI] [PubMed] [Google Scholar]
- 8.Fiedler W, Serve H, Dohner H, Schwittay M, Ottmann OG, O'Farrell AM, Bello CL, Allred R, Manning WC, Cherrington JM, Louie SG, Hong W, Brega NM, Massimini G, Scigalla P, Berdel WE, Hossfeld DK. Blood. 2005;105:986. doi: 10.1182/blood-2004-05-1846. [DOI] [PubMed] [Google Scholar]
- 9.Faivre S, Delbaldo C, Vera K, Robert C, Lozahic S, Lassau N, Bello C, Deprimo S, Brega N, Massimini G, Armand JP, Scigalla P, Raymond E. J Clin Oncol. 2006;24:25. doi: 10.1200/JCO.2005.02.2194. [DOI] [PubMed] [Google Scholar]
- 10.Bello CL, Sherman L, Zhou J, Verkh L, Smeraglia J, Mount J, Klamerus KJ. Anticancer Drugs. 2006;17:353. doi: 10.1097/00001813-200603000-00015. [DOI] [PubMed] [Google Scholar]
- 11.Britten CD, Kabbinavar F, Randolph Hecht J, Bello CL, Li J, Baum C, Slamon D. Cancer Chemother Pharmacol. 2008;61:515. doi: 10.1007/s00280-007-0498-4. [DOI] [PubMed] [Google Scholar]


