

Abstract
Purpose
To study the changes in hypoxia resulting from mild temperature hyperthermia (MTH) in a subcutaneous xenograft model using dual-tracer immunohistochemical techniques.
Material and Methods
HT29 tumors were locally heated at 41°C. Changes in tumor hypoxia were investigated by pimonidazole and EF5. Pimonidazole was given 1 hour pre-heating, EF5 at various times during or after treatment, 1 hour later the animals sacrificed. Blood vessels were identified by CD31 staining, and perfusion by Hoechst 33342 injected one minute pre-sacrifice.
Results
The overall hypoxic fraction was significantly decreased by MTH during and immediately after heating. However, MTH induced both increases and decreases in tumor hypoxia in different parts of the tumor. Specifically, MTH decreased hypoxia in the regions with relatively well-perfused blood vessels, but increased hypoxia in regions that were poorly perfused. At 24-hour post heating, newly-formed hypoxic regions surrounded previously-hypoxic foci, which in turn surrounded pimonidazole-stained debris. Quantitative analysis did not evince changes in tumor oxygenation due to MTH at 24 hours post-treatment.
Conclusions
In this xenograft model, the effect of MTH on tumor oxygenation was variable, both spatially and kinetically. Overall tumor oxygenation was improved during and after heating, but the effect was short-lived.
Keywords: Hypoxia, Pimonidazole, EF5, Mild temperature hyperthermia, Blood flow
INTRODUCTION
Most human tumors contain a significant fraction of hypoxic cells, which being threefold more radioresistant than normoxic cells, may obstruct successful radiotherapy. There is increasing evidence that hypoxia contributes to malignant progression through its effects on signal transduction pathways and regulation of gene transcription [1, 2], and is a negative prognostic indicator for disease progression, metastasis and recurrence after radiotherapy and surgery [2–4]. Hence, novel strategies that reduce or target tumor hypoxia may improve local tumor control and patient survival.
Hyperthermia has been proposed as an approach to circumvent tumor hypoxia since it preferentially kills hypoxic cells in the acidic intra-tumor environment [5]. Hyperthermia at >42–43°C also radiosensitizes tumor cells by inhibiting the repair of sublethal and potentially lethal damage [6], although it is difficult to reliably heat deep-seated tumors to such temperatures [7]. In comparison, mild temperature hyperthermia (MTH, <42°C) is less difficult to achieve, and several randomized clinical trials demonstrated that MTH effectively enhanced the response of tumors to radiotherapy, and improved local tumor control and patient survival [7–9]. Recently, MTH has been recommended as part of regular care for advanced cervical cancer patients in combination with radiotherapy [10].
MTH is believed to dilate tumor blood vessels, increase tumor oxygenation and so enhance tumor radiosensitivity [11]. Clinical and experimental studies showed that MTH could increase the overall tumor pO2 level in rodent [12], canine [13] and human tumors [14, 15]. However most of these experiments evaluated the overall tumor pO2 level with oxygen electrode, and not the effect of MTH on tumor hypoxia at the microscopic level.
Bioreductive markers (mostly 2-nitroimidazoles) are specifically reduced and bound to macromolecules in hypoxic cells. The use of two different 2-nitroimidazoles sequentially administered before and after the intervention has been used to determine changes in tumor hypoxia due to specific interventions. As the evaluation of changes is performed in the same tumor the effect of inter-tumor variation is eliminated, with each tumor serving as its own control [16]. Moreover, the changes in tumor hypoxia can be analyzed in relation to the tumor vasculature, blood perfusion and other microenvironment parameters, by staining the same tumor sections for multiple markers. Ljungkvist et al. successfully used this double-labeling technique to study hypoxic cell turnover [17], and the changes in tumor hypoxia induced by hydralazine, carbogen-breathing [18], and radiotherapy [19].
Our aim was to investigate MTH-induced temporal and spatial changes in tumor hypoxia at the microscopic level by the dual-tracer technique, using pimonidazole and EF5. In addition, these changes were spatially-correlated with the distribution of blood vessels and perfusion as determined by CD31 and Hoechst 33342 staining, respectively.
MATERIALS AND METHODS
Tumors
HT29 human colorectal adenocarcinoma cells (ATCC, USA) were maintained in exponential growth phase in McCoy’s 5A modified medium supplemented with 10% fetal bovine serum (Gemini, CA) and 1% penicillin-streptomycin solution (Invitrogen, CA). Five million cells in 0.1 mL phosphate-buffered saline (PBS) were subcutaneously transplanted into the dorsum of the right hind limb of female immune-compromised NCI nu/nu mice (~25 g, Frederick Cancer Research Institute, Frederick, MD). Experiments were initiated when the tumors reached ~10 mm in diameter, according to protocols approved by the Institutional Animal Care and Use Committee of MSKCC.
Markers of Hypoxia and Perfusion
The hypoxia marker pimonidazole hydrochloride (1-[(2-hydroxy-3-piperidinyl)propyl]-2-nitroimidazole hydrochloride) was obtained from Chemicon International, Inc. (Temecula, CA). EF5 (2-{2-nitro-1H-imidazol-1-yl}-N-(2,2,3,3,3- pentafluoropropyl) acetamide) [20] was a gift from Dr. Cameron J. Koch (University of Pennsylvania, Philadelphia, PA). Perfusion marker Hoechst 33342 was obtained from Sigma-Aldrich (St. Louis, MO).
Pimonidazole and EF5 were dissolved in PBS, and injected via the tail vein at a concentration of 68 mmol (0.1 mL), and 10 mmol (0.2 mL) per mouse, respectively. Our studies found that the extent of hypoxia marker binding is somewhat independent of marker exposure. This is similar to the observation reported by Kleiter et al [21], who found an overall absence of association between the tumor exposure and pimonidazole binding, but rather that the uptake was dominated by the hypoxic fraction. The hypoxia marker doses used in this study corresponded to amounts empirically determined to result in comparable staining intensities from the control study in which animals were co-injected with pimonidazole and EF5 or separated from 1.5 to 25.75 hours between the two injections. Hoechst 33342 was dissolved in PBS, and injected via the tail vein at a dose of 0.4 mg (0.1 mL) per mouse.
Experimental Design
As illustrated in Figure 1, pimonidazole was administered 1-hour before heating and EF5 either during (cohort I) or after (cohort II) heating. For cohort, EF5 was injected after 10 or 30 minutes of heating and hyperthermia continued until animal sacrifice; for cohort II, EF5 was given at 0, 1, 6 and 24 hours after 45 minutes of heating. Hoechst 33342 was injected one-minute before sacrifice. In control (unheated) animals, the injections of pimonidazole and EF5 were separated by 0, 1.5, 2.75, 7.75 or 25.75 hours respectively. Three to six tumors were used in each group, for a total of 46.
Figure 1.

Experimental design for MTH study, illustrating pimonidazole, EF5 and Hoechst 33342 injection times relative to hyperthermia treatment.
Administration of Mild Temperature Hyperthermia
Unanesthetized mice were held in individual holders, and tumor-bearing limbs were placed on the bar protruded from the holder and immersed into a circulating water bath set at 41°C (Lauda Type BD, Germany) [22]. The intratumor temperature of three animals was monitored with a needle-type, 26-gauge thermocouple microprobe (SENSORtek, NJ). The measured temperature was ~33°C before heating, equilibrated within 5 minutes of heating, and remained between 40.7–40.9°C during the heating. Once the tumor was removed from the water bath, the temperature quickly returned to normal within ~5–10 minutes. The tumors used for the temperature monitoring were excluded for the further experiment.
Preparation of Frozen Tumor Sections
Immediately after animal sacrifice, the tumors were dissected, frozen in O.C.T. mounting medium (Sakura Finetek, CA) with dry ice. Consecutive 8 µm thick sections were cut at the largest circumference of the tumor on a Microm HM500 cryostat microtome (Walldorf, Germany). Hoechst 33342, pimonidazole, EF5 and CD31 images were all acquired from the same section. An adjacent section was stained with hematoxylin and eosin.
Immunohistochemistry
Slides were air-dried and fixed in ice-cold acetone for 15 minutes. Hoechst 33342 images were acquired before staining. Between each staining step, the sections were rinsed three times for 5 minutes in PBS. Unless otherwise stated, all antibodies were diluted in blocking solution SuperBlock® (Pierce), and all incubations were performed at room temperature.
EF5 and pimonidazole were co-stained. The tumor sections were blocked with SuperBlock overnight at 4°C, exposed to Cy3-conjugated anti-EF5 monoclonal antibodies ELK3-51 (75 µg/mL) at 4°C for 5 hours, sheep anti-cyanine (5 µg/mL, USBiological) diluted in SuperBlock/mouse serum (1:1) for 1 hour, the mixture of FITC-conjugated murine anti-pimonidazole monoclonal antibody (1:25, Chemicon) and Alexa Fluor 568 conjugated anti-sheep antibody (20 µg/mL, Molecular Probes) for 1 hour. No cross-reactivity was detected between any of these antibodies used. CD31 was detected with rat anti-mouse CD31 antibody (0.3 µg/mL, PECAM-1) and biotinylated rabbit anti-rat IgG (5 µg/mL, Vector Labs), followed by ABC reagent and diaminobenzidine.
Image Acquisition
Fluorescence images were acquired at 50× magnification using a fluorescence microscope (Axiovert 200M ; Zeiss) equipped with a CCD digital camera, a computer-controlled motorized stage and Metamorph 7.0 Imaging software (Molecular Devices, CA). Each scanned field was 1.7 × 1.3 mm, with 2.5 µm pixels. Composite images were stitched by Metamorph from individual microscopic images. CD31 and H&E images were acquired by the light microscopy using the same system described above.
Image Analysis
The images were co-registered in Adobe Photoshop 7.0 (Adobe, CA). After excluding the non-tumor tissues and necrotic areas identified on the H&E images, we determined the perfused fraction (PF, Hoechst 33342 positive regions divided by the total viable tumor regions) and hypoxic fraction (HF1 and HF2, pimonidazole or EF5 positive regions divided by the total viable tumor regions). Threshold levels used to define hypoxia on the pimonidazole (and EF5) stained images were selected so as to exclude all tumor regions known not to contain hypoxia, i.e. regions highly stained with Hoechst 33342. Similarly, the threshold for Hoechst 33342 was set from the intensity of this perfused marker in regions of known hypoxia, i.e. corresponding to regions with high EF5 staining. Details of this methodology have been previously reported [23, 24].
In addition, we performed quantitative analysis to correlate the various measured parameters. The co-registered and binary images of Hoechst 33342, pimonidazole and EF5 were divided into 1 × 1 mm ROIs (regions of interest) using Adobe photoshop. The perfused fraction and hypoxic fractions in each co-registered ROI were analyzed using the ImageJ1.34 software (National Institutes of Health: http://rsb.info.nib.gov/ij), and defined as PFROI, HF1ROI and HF2ROI, respectively. Scatter plots were constructed between HF1ROI, HF2ROI or HF2ROI/HF1ROI and PFROI or HF1ROI.
Statistics
Statistical analyses were performed using SPSS 11.0 (SPSS, IL) with the changes in hypoxic fraction compared with one-way analysis of variance. Pearson correlation coefficients were calculated to describe the possible relation between HF2ROI/HF1ROI and a) PFROI and b) HF1ROI. A p value below or equal to 0.05 was considered statistically significant.
RESULTS
Changes in hypoxia in control (unheated) tumors
Pimonidazole and EF5 show similar ability for detecting hypoxic cells. The spatial distributions of hypoxic cells identified by pimonidazole and EF5 are almost identical as illustrated by the dominance of yellow regions when they were co-injected (Figure 2A). The scattered green regions indicate that pimonidazole stained areas are slightly larger than EF5 stained areas, consistent with the HF2/HF1 value of 0.97 ± 0.04. As expected, regions staining positive for hypoxia markers are not co-localized with the perfusion marker Hoechst 33342. Also, neither pimonidazole nor EF5 was detected in necrotic tissues.
Figure 2.

Representative composite binary images of tumor sections from unheated control tumors. Different injection intervals for two hypoxia markers were given and indicated above each image. First hypoxia marker pimonidazole is stained green; the second hypoxia marker EF5, red; the overlay of two hypoxia markers (i.e. no change in the hypoxic status), yellow; vasculature endothelium CD31, white; and perfusion marker Hoechst 33342 is blue. N: necrosis. Original magnification 50×, Scale bar = 1 mm.
Figure 2B shows that imposing a 1.5-hour interval between pimonidazole and EF5 injections had little or no effect on the co-localization of the markers. However, with further increase in the interval between the injections of the two hypoxia markers, the mismatch between the staining patterns of pimonidazole and EF5 increased. Figure 2D shows pimonidazole staining (arrows) in the necrotic zone, suggesting the progression of hypoxic cells into necrosis during the 25.75-hour interval. In addition, cells (arrow heads) labeled only with EF5 appeared on the vessel side of the hypoxic areas, indicating those cells were not hypoxic when the first hypoxia marker injected, but had been pushed away from the blood vessels within this period. Although the images show scattered EF5 and pimonidazole mismatched areas at relatively short interval, the mean HF2/HF1 values are not significantly different from that of co-injected tumors (0.97 ± 0.04) until the injection interval was prolonged to 25.75 hours (1.10 ± 0.07; p = 0.0217).
Effect of mild temperature hyperthermia on hypoxia
After 30 minutes of heating, regions of both decreased (solid-line square) and increased (dashed-line square) hypoxia were observed in the same tumor section (Figure 3A). Similar changes in tumor hypoxia were also observed immediately after 45 minutes at 41°C (Figure 3B), but became less apparent 1 hour later (Figure 3C). At 24-hour post MTH (Figure 3D), there was much less overlap between EF5 and pimonidazole staining. Thus these data suggest that the changes in tumor hypoxia induced by MTH are variable in different regions of the tumor, and vary also with time.
Figure 3.
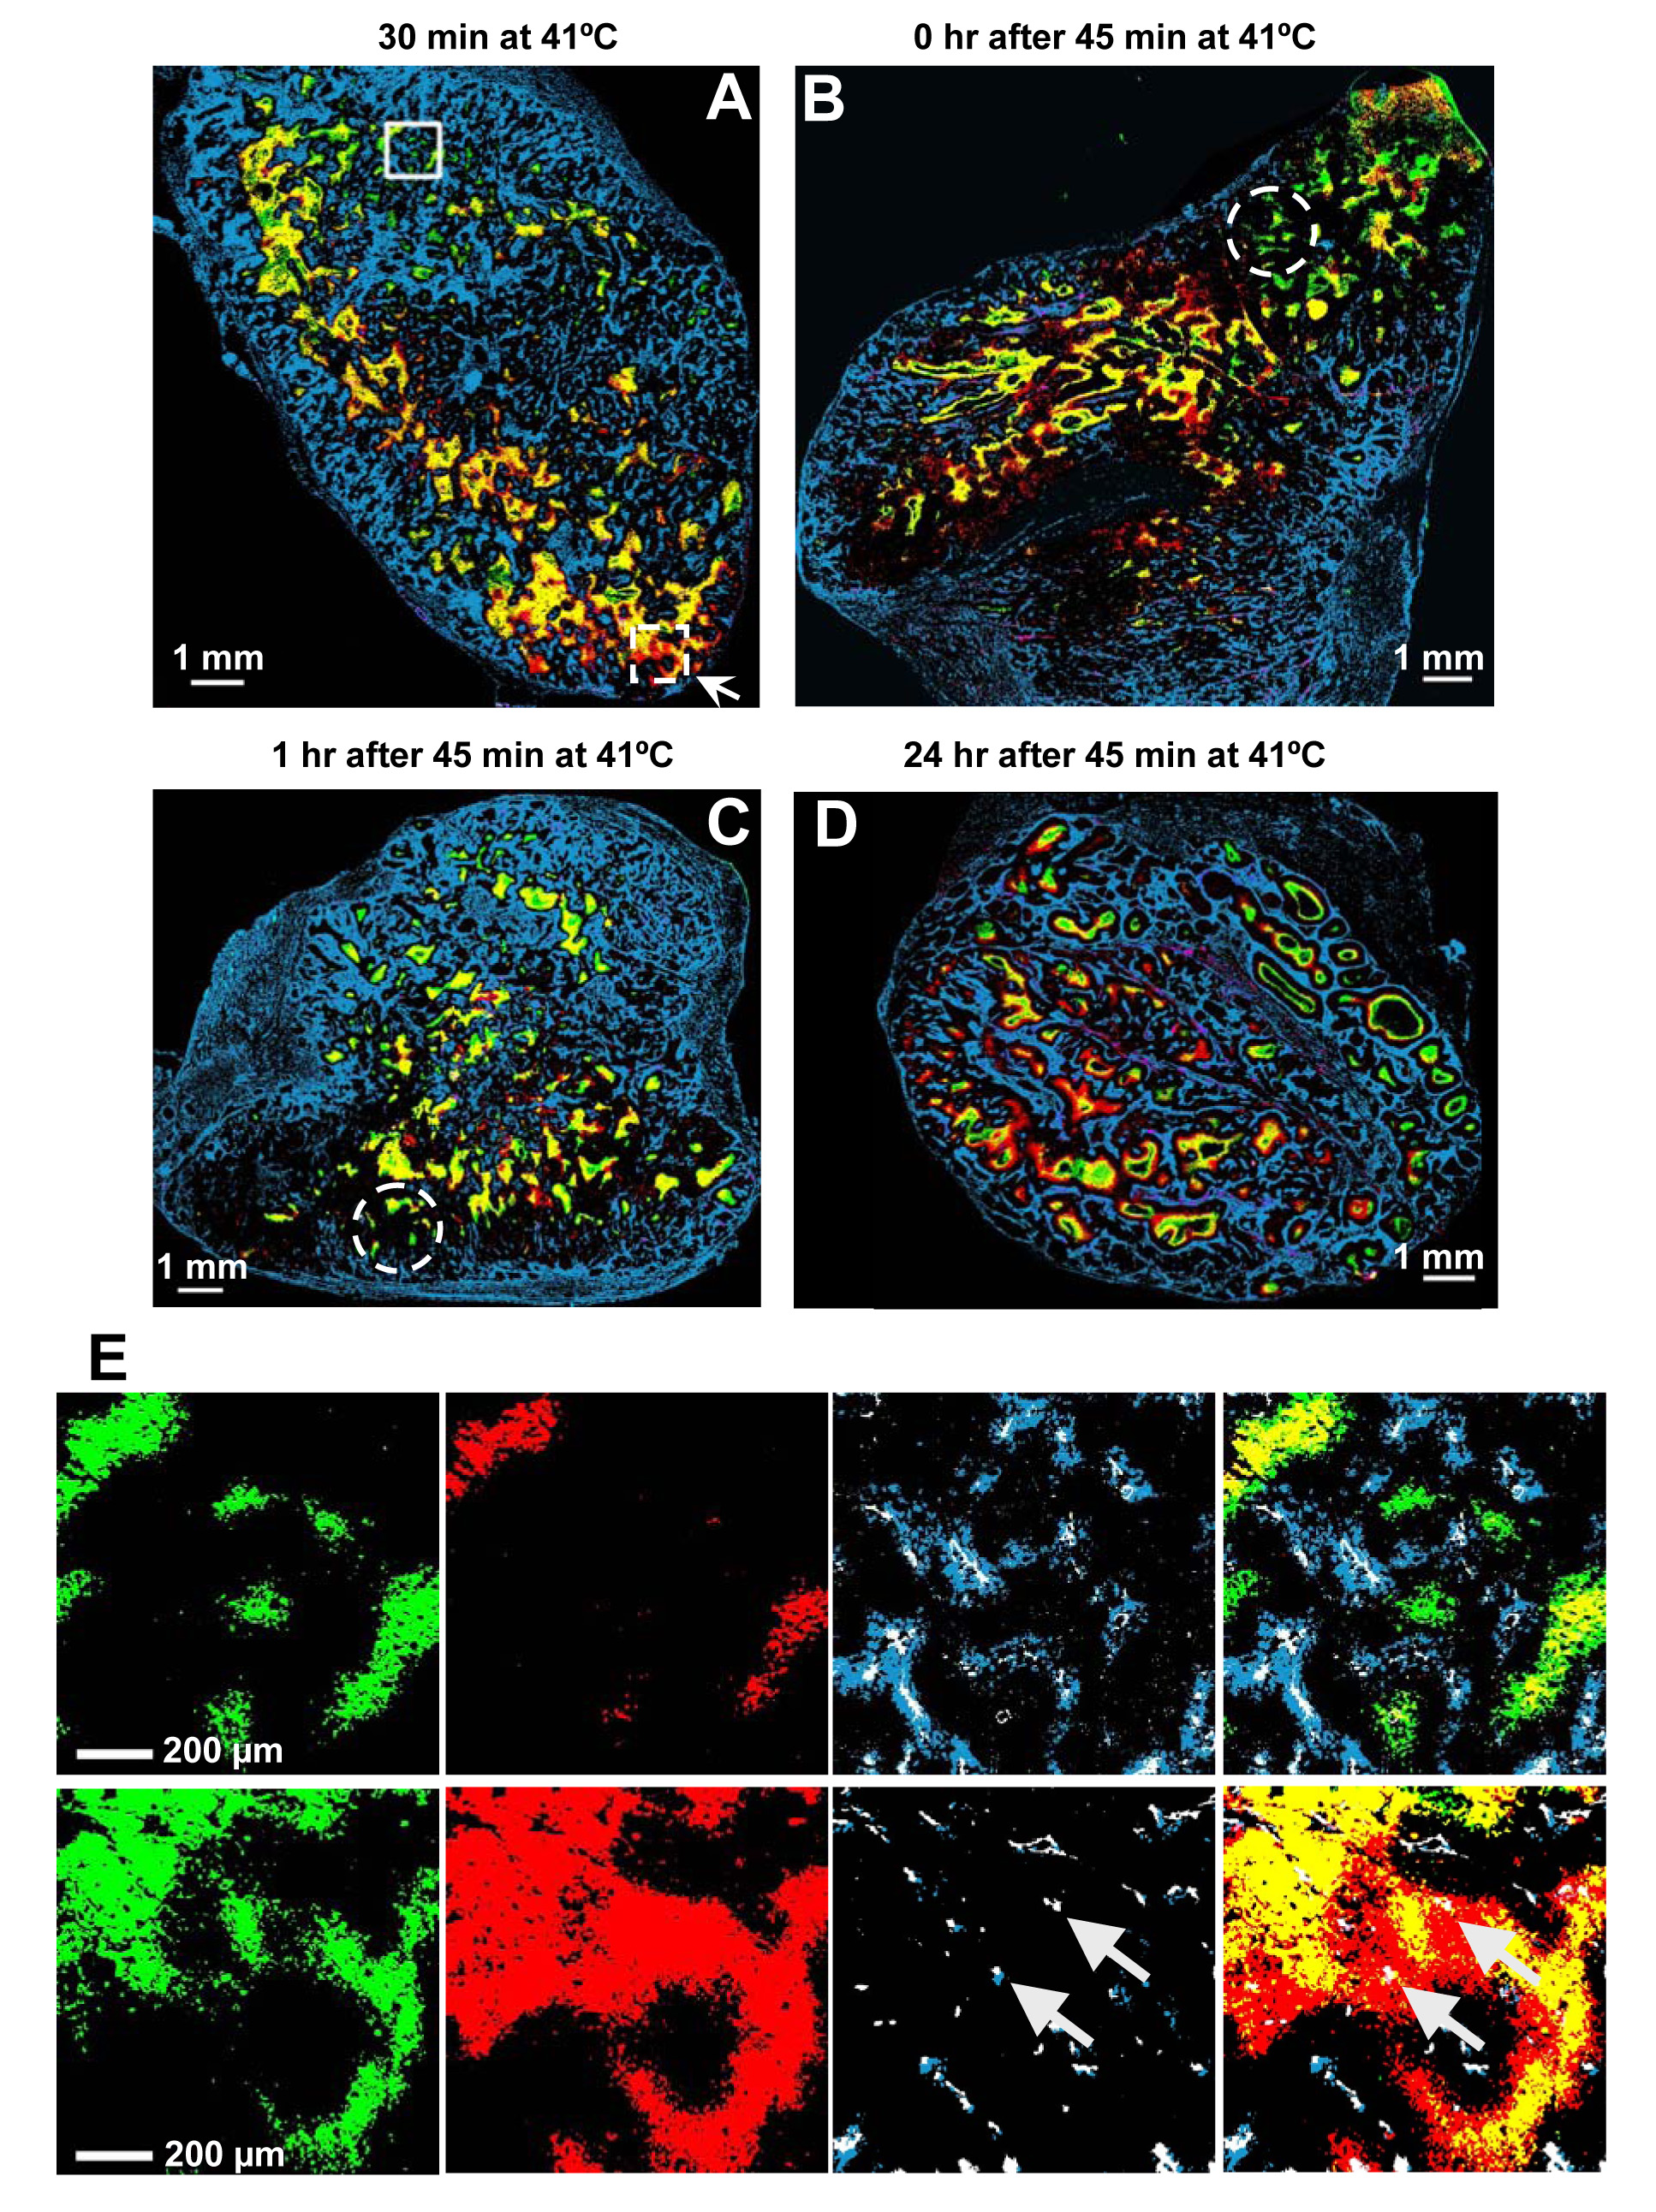
Effect of MTH on tumor hypoxia. A–D Representative composite binary images from heated tumors at different time points during and after heating. The color convention is the same as Figure 2. The interval between EF5 injection and heating is given above each image. Original magnification 50×, Scale bar = 1 mm. E. Comparison of binary image detail from the two different regions of the heated tumor shown in Figure 3A (solid-line square for the upper panel, dashed-line square for the lower panel). From left to right, pimonidazole, EF5, CD31 and Hoechst 33342 together, and the composite binary image showing all markers. The upper panel shows an example region where the hypoxic foci decrease during heating; the lower panel shows a region where the hypoxic foci increase during heating. Original magnification 50×, Scale bar = 200 µm.
MTH-induced changes in tumor hypoxia and microvasculature
Upon closer examination of the data, the regional differences of the changes in tumor hypoxia during MTH appear to be related to the functional status of the microvasculatures. Decreased hypoxia occurred in regions with strong Hoechst 33342 signals (solid-line square in Figure3A), and increased hypoxia in regions with weak Hoechst 33342 signals (dashed-line square in Figure3A). However, this relationship became less apparent post-treatment, where there was no prominent Hoechst 33342 staining observed in some regions of decreased hypoxia (dashed-line circles in Figure 3B and 3C).
Figure 3E shows, in expanded detail, features of the binary image taken from two example regions in one tumor. Comparing the green and red areas in the left two panels of the top row, it can be concluded that MTH reduced tumor hypoxia. This is also evident in the composite image on the right, which shows lesser yellow regions (overlap between red and green) relative to the pre-MTH pimonidazole-stained (green) area. In the third panel from the left, the co-localization of the perfusion marker Hoechst 33342 (blue) with blood vessels identified by CD31 staining (white) suggests that these vessels were fully functional in this region. In the composite image, the locations of the yellow regions are at a greater distance from the functioning vessels than the green regions.
The data in the bottom row of Figure 3E are in sharp contrast with that in the top row. First, tumor hypoxia is increased by the treatment (compare the green and red areas in the left two panels, and the red and yellow areas in the composite image on the right). Second, in the third panel from the left, there is little Hoechst 33342 (blue) surrounding the CD31 staining (white) suggesting that the blood vessels are dysfunctional in this region (arrows). In the composite image, the EF5-stained (red) areas surround the yellow areas, suggesting development of additional hypoxia around these non-functioning vessels (arrows) upon the application of MTH.
We quantitatively analyzed the image data in 1×1 mm ROIs to derive values of PFROI, HF1ROI, and HF2ROI, and generated scatter plots for these parameters (Figure 4). As expected, HF1ROI and HF2ROI are negatively correlated with PFROI in both control and heated tumors; HF2ROI/HF1ROI clustered around unity in unheated tumors, and did not vary with changes in PFROI or HF1ROI. In the plot of HF2ROI/HF1ROI vs HF1ROI of heated tumors, HF2ROI/HF1ROI values varied considerably at low HF1ROI, and less so at high HF1ROI. The most striking relationship was observed in the plot of HF2ROI/HF1ROI vs PFROI; with an increase in HF2ROI/HF1ROI at low PFROI, and decrease in HF2ROI/HF1ROI at high PFROI values, yielding a negative correlation of r = −0.376, p < 0.01.
Figure 4.

Analysis of the effect of MTH on tumor hypoxia. In total we analyzed 157 ROIs from 3 tumors that received EF5 after 30 minutes of MTH, and 127 ROIs from 3 unheated control tumors injected with two hypoxia markers 1.5-hour apart. Each point represents one 1×1 mm region of interest. Scatter plots show the relationship (A) between HF1ROI, HF2ROI or HF2ROI/HF1ROI and PFROI (from left to right) in unheated (upper row) and heated (lower row) tumors and (B) between HF2ROI or HF2/HF1ROI and HF1ROI in unheated (left two panels) and heated (right two panels) tumors.
Kinetics of MTH-induced changes in tumor hypoxia
Although MTH induced both region-dependent increases and decreases in tumor hypoxia, the overall effect was improved oxygenation, but the effect appeared to decay with time. The kinetics of these changes is summarized in Figure 5A and 5B (solid bars) with time-matched unheated control tumor (open bars). The greatest reduction in hypoxic fraction was observed at cohort I after 30 minutes heating (Figure 5A), the HF2/HF1 decreased from 0.95 ± 0.04 in unheated control tumors to 0.73 ± 0.08 in the heated tumors (p = 0.0001). For cohort II, the HF2/HF1 decreased to 0.83 ± 0.02 (p = 0.0299) immediately after 45 minutes heating, and from 1.00 ± 0.03 to 0.89 ± 0.03 (p = 0.0322) 1 hour afterwards. However, at 6 and 24 hours post-treatment, there were no statistically significant changes in HF2/HF1 relative to unheated control tumors.
Figure 5.

The kinetics of the effect of MTH on tumor hypoxia. The ratios of HF2/HF1 at different times during and after heating are shown in A and B. Open and solid bars represent unheated and heated tumors respectively. All values are mean ± SD from 3 to 6 mice/group. The control group for given 30 minutes of heating was also duplicated to be as the control (dashed open bars) for given 10 minutes of heating and immediately after the heating for 45 minutes.
DISCUSSION
Several previous studies using oxygen-measuring probes have demonstrated that MTH can increase pO2 level in experimental tumor models [12, 25–28] and human cancers [14, 15], presumably by dilating tumor blood vessels. The aim of this study was to investigate the changes in hypoxia induced by MTH using dual-tracer immunohistochemical technique. This technique allows the detection of relative changes in tumor hypoxia at the cellular level. It also provides spatial association of such changes with tumor histology (H&E staining), vasculature (anti CD31) and perfusion (Hoechst 33342). Considering its short plasma half-live (30-minute for pimonidazole versus 3-hour for EF5 in mice [16]), we used pimonidazole as first injected marker at 1 hour prior hyperthermia so that there will be only 25% of pimonidazole left in plasma when heating started.
To quantify the overall change in tumor oxygenation, we used HF2/HF1, i.e. the ratio of the areas stained positive for the second vis-à-vis the first marker in the same tumor section. Our results show an overall reduction in the area stained positive for second markers as compared to that stained positive for first markers after MTH, in overall agreement with the findings of other investigators [25, 26].
MTH is usually able to improve tumor oxygenation, an effect that occurs rapidly after the initiation of heating. However, the duration of this effect after hyperthermia is controversial. Okajima et al [27] found that the time to restoration to baseline oxygenation after MTH varied with the type of tumor and the heat dose. In SCK mammary carcinoma, tumor pO2 rapidly decreased to the preheating level within 1-hour after heating at 41.5°C for 60 minutes, but remained elevated for 3-hour following 30 minutes heating. However, in FSaII fibrosarcoma, the median pO2 remained significantly elevated for 24–48 hours after heating for 60 minutes. Recently, Thrall et al [28] investigated the pO2 changes during fractionated hyperthermia and radiation therapy in spontaneous canine sarcomas. Hyperthermia improved tumor oxygenation, an effect that persisted throughout the course of fractionated radiation therapy in some tumors; but caused a fluctuation or a permanent decrease in tumor oxygenation in other tumors. All these results demonstrated that the effect of hyperthermia on tumor pO2 and its reversal (or decay) depend on the heat dose and tumor type [11, 27]. In this study, we found that the effect was observable within 1 hour of MTH, but not at 6 hour post-treatment. The difference of our results relative to those of others could be due to the tumor model and the dual-tracer methods.
The most interesting observation of our study is that there are both decreases and increases of tumor hypoxia within the heated tumor, and that the decrease occurs in regions with high Hoechst 33342 staining, and increase in regions with low Hoechst 33342. This phenomenon was clearly and consistently observed during and at early time points after MTH, but not subsequently. While the mechanism for this observation is not clear at the present, it is possible that the direction of MTH-induced changes in hypoxia (increase or decrease) depends upon the functional status of loco-regional microvasculature. As has been reported, tumor vasculature is highly irregular e.g. dilated, bulged, constricted, twisted and sharply bent, and mostly lacking a smooth muscle layer and innervations, resulting in an inability to auto-regulate [29]. Normal tissue blood vessels (mainly arterioles) which are incorporated when the tumor invades the normal tissue, are fully capable of responding to external stimuli [30]. Therefore, the regional differences of abnormal tumor vasculature and normal tissue arterioles might influence the effect of MTH in modulating tumor hypoxia. Similarly, Ljungkvist et al in their dual marker studies also found that Carbogen breathing caused a drastic reduction in tumor hypoxia that was most marked close to well-perfused regions and less pronounced closed to necrotic tumor areas [18]. All these phenomena indicate the potential important role of functional status of regional vasculature on manipulation of tumor oxygenation.
One of the possible artifacts in the above observation was that the Hoechst 33342 distribution reflected blood perfusion at animal sacrifice, substantially later than the injection time of either hypoxia marker. Induced changes in cellular oxygen consumption rate [11] might also affect the experimental results. To address these concerns, at least in part, we are planning future experiments that use dual-perfusion markers (DiOC7 and Hoechst 33342) pre- and post-treatment.
In summary, in the HT29 tumor model, the overall effect of MTH is to improve tumor oxygenation, both during and immediately after the treatment. If translatable to clinical radiotherapy, MTH may improve tumor oxygenation status and therefore improve therapeutic efficacy. However, the radiobiological consequences of regional differences of changes in tumor hypoxia induced by MTH are not known and will require further study.
Acknowledgment
This research was supported by National Institutes of Health Grant PO1 CA115675
Footnotes
Publisher's Disclaimer: This is a PDF file of an unedited manuscript that has been accepted for publication. As a service to our customers we are providing this early version of the manuscript. The manuscript will undergo copyediting, typesetting, and review of the resulting proof before it is published in its final citable form. Please note that during the production process errors may be discovered which could affect the content, and all legal disclaimers that apply to the journal pertain.
Conflict of Interest Statement
The authors state that there are no actual or potential conflicts of interest regarding the contents of this manuscript.
REFERENCES
- 1.Harris AL. Hypoxia--a key regulatory factor in tumour growth. Nature reviews. 2002;2:38–47. doi: 10.1038/nrc704. [DOI] [PubMed] [Google Scholar]
- 2.Hockel M, Vaupel P. Tumor hypoxia: definitions and current clinical, biologic, and molecular aspects. Journal of the National Cancer Institute. 2001;93:266–276. doi: 10.1093/jnci/93.4.266. [DOI] [PubMed] [Google Scholar]
- 3.Vaupel P. Tumor microenvironmental physiology and its implications for radiation oncology. Seminars in radiation oncology. 2004;14:198–206. doi: 10.1016/j.semradonc.2004.04.008. [DOI] [PubMed] [Google Scholar]
- 4.Brizel DM, Scully SP, Harrelson JM, et al. Tumor oxygenation predicts for the likelihood of distant metastases in human soft tissue sarcoma. Cancer research. 1996;56:941–943. [PubMed] [Google Scholar]
- 5.Reinhold HS, Endrich B. Tumour microcirculation as a target for hyperthermia. Int J Hyperthermia. 1986;2:111–137. doi: 10.3109/02656738609012389. [DOI] [PubMed] [Google Scholar]
- 6.Hall EJ, Roizin-Towle L. Biological effects of heat. Cancer research. 1984;44:4708s–4713s. [PubMed] [Google Scholar]
- 7.Vernon CC, Hand JW, Field SB, et al. Radiotherapy with or without hyperthermia in the treatment of superficial localized breast cancer: results from five randomized controlled trials. International Collaborative Hyperthermia Group. International journal of radiation oncology, biology, physics. 1996;35:731–744. doi: 10.1016/0360-3016(96)00154-x. [DOI] [PubMed] [Google Scholar]
- 8.van der Zee J, Gonzalez Gonzalez D, van Rhoon GC, van Dijk JD, van Putten WL, Hart AA. Comparison of radiotherapy alone with radiotherapy plus hyperthermia in locally advanced pelvic tumours: a prospective, randomised, multicentre trial. Dutch Deep Hyperthermia Group. Lancet. 2000;355:1119–1125. doi: 10.1016/s0140-6736(00)02059-6. [DOI] [PubMed] [Google Scholar]
- 9.Harima Y, Nagata K, Harima K, Ostapenko VV, Tanaka Y, Sawada S. A randomized clinical trial of radiation therapy versus thermoradiotherapy in stage IIIB cervical carcinoma. Int J Hyperthermia. 2001;17:97–105. doi: 10.1080/02656730010001333. [DOI] [PubMed] [Google Scholar]
- 10.van der Zee J, van Rhoon GC. Cervical cancer: radiotherapy and hyperthermia. Int J Hyperthermia. 2006;22:229–234. doi: 10.1080/02656730600722578. [DOI] [PubMed] [Google Scholar]
- 11.Song CW, Park H, Griffin RJ. Improvement of tumor oxygenation by mild hyperthermia. Radiation research. 2001;155:515–528. doi: 10.1667/0033-7587(2001)155[0515:iotobm]2.0.co;2. [DOI] [PubMed] [Google Scholar]
- 12.Shakil A, Osborn JL, Song CW. Changes in oxygenation status and blood flow in a rat tumor model by mild temperature hyperthermia. International journal of radiation oncology, biology, physics. 1999;43:859–865. doi: 10.1016/s0360-3016(98)00516-1. [DOI] [PubMed] [Google Scholar]
- 13.Vujaskovic Z, Poulson JM, Gaskin AA, et al. Temperature-dependent changes in physiologic parameters of spontaneous canine soft tissue sarcomas after combined radiotherapy and hyperthermia treatment. International journal of radiation oncology, biology, physics. 2000;46:179–185. doi: 10.1016/s0360-3016(99)00362-4. [DOI] [PubMed] [Google Scholar]
- 14.Brizel DM, Scully SP, Harrelson JM, et al. Radiation therapy and hyperthermia improve the oxygenation of human soft tissue sarcomas. Cancer research. 1996;56:5347–5350. [PubMed] [Google Scholar]
- 15.Vujaskovic Z, Rosen EL, Blackwell KL, et al. Ultrasound guided pO2 measurement of breast cancer reoxygenation after neoadjuvant chemotherapy and hyperthermia treatment. Int J Hyperthermia. 2003;19:498–506. doi: 10.1080/0265673031000121517. [DOI] [PubMed] [Google Scholar]
- 16.Ljungkvist AS, Bussink J, Kaanders JH, van der Kogel AJ. Dynamics of tumor hypoxia measured with bioreductive hypoxic cell markers. Radiation research. 2007;167:127–145. doi: 10.1667/rr0719.1. [DOI] [PubMed] [Google Scholar]
- 17.Ljungkvist AS, Bussink J, Kaanders JH, et al. Hypoxic cell turnover in different solid tumor lines. International journal of radiation oncology, biology, physics. 2005;62:1157–1168. doi: 10.1016/j.ijrobp.2005.03.049. [DOI] [PubMed] [Google Scholar]
- 18.Ljungkvist AS, Bussink J, Rijken PF, Raleigh JA, Denekamp J, Van Der Kogel AJ. Changes in tumor hypoxia measured with a double hypoxic marker technique. International journal of radiation oncology, biology, physics. 2000;48:1529–1538. doi: 10.1016/s0360-3016(00)00787-2. [DOI] [PubMed] [Google Scholar]
- 19.Ljungkvist AS, Bussink J, Kaanders JH, Wiedenmann NE, Vlasman R, van der Kogel AJ. Dynamics of hypoxia, proliferation and apoptosis after irradiation in a murine tumor model. Radiation research. 2006;165:326–336. doi: 10.1667/rr3515.1. [DOI] [PubMed] [Google Scholar]
- 20.Lord EM, Harwell L, Koch CJ. Detection of hypoxic cells by monoclonal antibody recognizing 2-nitroimidazole adducts. Cancer research. 1993;53:5721–5726. [PubMed] [Google Scholar]
- 21.Kleiter MM, Thrall DE, Malarkey DE, et al. A comparison of oral and intravenous pimonidazole in canine tumors using intravenous CCI-103F as a control hypoxia marker. International journal of radiation oncology, biology, physics. 2006;64:592–602. doi: 10.1016/j.ijrobp.2005.09.010. [DOI] [PubMed] [Google Scholar]
- 22.Urano M, Gerweck LE, Epstein R, Cunningham M, Suit HD. Response of a spontaneous murine tumor to hyperthermia: factors which modify the thermal response in vivo. Radiation research. 1980;83:312–322. [PubMed] [Google Scholar]
- 23.Shin KH, Diaz-Gonzalez JA, Russell J, et al. Detecting changes in tumor hypoxia with carbonic anhydrase IX and pimonidazole. Cancer Biol Ther. 2007;6:70–75. doi: 10.4161/cbt.6.1.3550. [DOI] [PubMed] [Google Scholar]
- 24.Li XF, Carlin S, Urano M, Russell J, Ling CC, O'Donoghue JA. Visualization of hypoxia in microscopic tumors by immunofluorescent microscopy. Cancer research. 2007;67:7646–7653. doi: 10.1158/0008-5472.CAN-06-4353. [DOI] [PubMed] [Google Scholar]
- 25.Song CW, Shakil A, Osborn JL, Iwata K. Tumour oxygenation is increased by hyperthermia at mild temperatures. Int J Hyperthermia. 1996;12:367–373. doi: 10.3109/02656739609022525. [DOI] [PubMed] [Google Scholar]
- 26.Horsman MR, Overgaard J. Can mild hyperthermia improve tumour oxygenation? Int J Hyperthermia. 1997;13:141–147. doi: 10.3109/02656739709012378. [DOI] [PubMed] [Google Scholar]
- 27.Okajima K, Griffin RJ, Iwata K, Shakil A, Song CW. Tumor oxygenation after mild-temperature hyperthermia in combination with carbogen breathing: dependence on heat dose and tumor type. Radiation research. 1998;149:294–299. [PubMed] [Google Scholar]
- 28.Thrall DE, Larue SM, Pruitt AF, Case B, Dewhirst MW. Changes in tumour oxygenation during fractionated hyperthermia and radiation therapy in spontaneous canine sarcomas. Int J Hyperthermia. 2006;22:365–373. doi: 10.1080/02656730600836386. [DOI] [PubMed] [Google Scholar]
- 29.Song CW. Modification of blood flow. In: Molls M, Vauple P, editors. Blood perfusion and microenvironment of human tumors. Berlin: Springer-Verlag; 1998. pp. 193–207. [Google Scholar]
- 30.Song CW, Park HJ, Lee CK, Griffin R. Implications of increased tumor blood flow and oxygenation caused by mild temperature hyperthermia in tumor treatment. Int J Hyperthermia. 2005;21:761–767. doi: 10.1080/02656730500204487. [DOI] [PubMed] [Google Scholar]