

Abstract
Bacterial plasmids are extra-chromosomal genetic elements that code for a wide variety of phenotypes in their bacterial hosts and are maintained in bacterial communities through both vertical and horizontal transfer. Current mathematical models of plasmid–bacteria dynamics, based almost exclusively on mass-action differential equations that describe these interactions in completely mixed environments, fail to adequately explain phenomena such as the long-term persistence of plasmids in natural and clinical bacterial communities. This failure is, at least in part, due to the absence of any spatial structure in these models, whereas most bacterial populations are spatially structured in microcolonies and biofilms. To help bridge the gap between theoretical predictions and observed patterns of plasmid spread and persistence, an individual-based lattice model (interacting particle system) that provides a predictive framework for understanding the dynamics of plasmid–bacteria interactions in spatially structured populations is presented here. To assess the accuracy and flexibility of the model, a series of experiments that monitored plasmid loss and horizontal transfer of the IncP-1 β plasmid pB10 ∷ rfp in Escherichia coli K12 and other bacterial populations grown on agar surfaces were performed. The model-based visual patterns of plasmid loss and spread, as well as quantitative predictions of the effects of different initial parental strain densities and incubation time on densities of transconjugants formed on a 2D grid, were in agreement with this and previously published empirical data. These results include features of spatially structured populations that are not predicted by mass-action differential equation models.
INTRODUCTION
Recent genomic data indicate that horizontal gene transfer (HGT) is a major mechanism in the adaptive evolution of prokaryotes (Gogarten et al., 2002; Daubin et al., 2003). One of the three mechanisms of HGT is conjugation mediated by self-transmissible plasmids. Such plasmids are of particular interest because they are ubiquitous in bacterial populations, and many are able to replicate in a wide range of hosts (Hill & Top, 1998; Van Elsas et al., 2000; Funnell & Phillips, 2004). In addition, some genes carried on plasmids code for phenotypic traits that can confer strong fitness advantages to the host organism; these include resistance to antibiotics and heavy metals, degradation functions and various pathogenic traits (Top et al., 2000; Venkatesan & Burland, 2004). However, plasmids also suffer from segregative loss and often present a cost to their host in the absence of selective pressure for plasmid-encoded traits. In spite of the key role of conjugative plasmid transfer in the rapid adaptation of bacterial communities, for example in the alarming spread of antibiotic resistance, very little is known about the intricacies of patterns of plasmid spread and persistence over evolutionary time in the absence of selective pressure (Bergstrom et al., 2000; Simonsen, 1991). Mathematical models can now provide powerful tools for investigating the mechanisms that are central to these phenomena, as well as for generating useful predictions and helping to guide experimental and field work.
The interactions within and between species, and the selective pressures that push them along various evolutionary pathways, almost always have important spatial components. Bacterial communities in most clinical and natural environments – e.g. on medical implants, in the gastrointestinal tract and in soil – typically live and evolve in spatially structured environments, growing as either microcolonies or biofilms on surfaces, and not in well-mixed fluids (Costerton et al., 1994; Reisner et al., 2003; Tolker-Nielsen & Molin, 2004). In particular, since conjugative transfer of plasmids requires cell–cell contact, spatial structure appears to play an especially important role. In spite of this, theoretical insights into the mechanisms of horizontal and vertical plasmid transfer are currently based almost entirely on models relevant only to well-mixed liquid systems (chemostats and batch cultures).
Stewart & Levin (1977) produced the first such mathematical model of conjugative plasmid dynamics, and numerous variations of this model followed over the years (Levin et al., 1979; Levin & Stewart, 1980; Levin, 1981; Freter et al., 1983; Lundquist & Levin, 1986; Simonsen et al., 1990). These mass-action ordinary differential equation (ODE) models assume random encounters between members of the plasmid-bearing and plasmid-free populations at rates that are jointly proportional to the densities of the respective populations, with a fraction of these encounters resulting in the transmission of a copy of the plasmid, and thus the transformation of status from a plasmid-free cell to a plasmid-bearing cell. Levin et al. (1979) presented procedures for estimating the parameters in such a model and showed, using batch and chemostat culture experiments, that mass-action models simulate reasonably well the dynamics of plasmid transfer for these well-mixed populations. Common features of well-mixed systems include the complete absence of spatial dependence and stochasticity, with the rates of change depending only on bulk properties of the system. These assumptions are clearly not met in spatially structured populations, and hence mass-action models should be viewed with some scepticism for most natural microbial ecosystems.
Several empirical studies have demonstrated that mass-action models fail to explain the dynamics of plasmid transfer in spatially structured habitats. Simonsen (1990) showed for the plasmids R1 and R1drd19 that the final densities of transconjugants at stationary phase increased with increasing initial densities of donor and recipient cells inoculated at a 1 : 1 ratio on agar slides. This is in contrast to predictions of mass-action models and to experimental results based on liquid cultures, where only the ratio of initial densities – but not the overall densities – has a significant influence on the final transconjugant densities. Pinedo & Smets (2005) observed a dependence of plasmid transfer efficiency on the donor to recipient ratio in filter matings that is not captured by mass-action models. In another study (Licht et al., 1999), the dynamics of transconjugant formation in the mouse gut were shown to be quite similar to those in a laboratory-grown biofilm and different from those observed in a chemostat and expected from a mass-action model. In addition to these empirical results, it is now mathematically well established (Durrett & Levin, 1994b; Hanski & Gilpin, 1997; Tilman & Kareiva, 1997; Dieckmann et al., 2000; Wei & Krone, 2005) that ignoring spatial structure in biological systems can lead to inaccuracies that are sometimes dramatic. There is thus clearly a need to develop a new class of spatially explicit models for the study of plasmid–bacteria interactions in spatially structured populations.
Very few attempts to model plasmid transfer on surfaces have been made. Of these, one model (Lagido et al., 2003) considered the formation of separate colonies by donors and recipients, which grew ‘exponentially’ until nutrient exhaustion; when these colonies met, conjugation occurred instantly and all recipients in the contacted colony became transconjugants. Although the limited empirical data were well described by the model, the above model assumptions are clearly not correct, and would probably lead to inconsistencies if compared to more extensive empirical results. Another study modelled plasmid mobilization in a ‘one-dimensional’ biofilm using partial differential equations that are based on a type of local mass-action dynamics (Beaudoin et al., 1998). Spatial structure in this model was accounted for only in terms of biofilm depth. Mochizuki et al. (2006) analysed a particular aspect of plasmid population dynamics – invasion of a post-segregational killing phenotype – via pair approximations in a simplified spatial model that ignored a number of key features, such as plasmid cost and nutrient limitation. While several experimental studies on bacterial plasmid transfer show very interesting spatial aspects (Christensen et al., 1998; Haagensen et al., 2002; Reisner et al., 2003; Sørensen et al., 2005), and while even the simple models just mentioned are able to capture some spatial effects, to our knowledge there are no realistic, spatially explicit models in the literature for describing and predicting the dynamics of plasmid spread in structured bacterial populations. In particular, we will show that model features such as 2D (and 3D) structure, plasmid cost, nutrient limitation and spatial aspects of plasmid transfer can significantly affect what the model predicts.
Mathematical models that capture spatial structure and stochastic effects down to the level of individuals have now been applied widely to various biological systems (Durrett & Levin, 1994a, b; Hanski & Gilpin, 1997; Tilman & Kareiva, 1997; Durrett & Levin, 1998; Dieckmann et al., 2000), including some that involve microbial communities (Durrett & Levin, 1997; Wimpenny & Colasanti, 1997; Kreft et al., 1998; Picioreanu et al., 1998a, b, 2004; Kerr et al., 2002; Kreft & Bonhoeffer, 2005; Wei & Krone, 2005; Xavier et al., 2005; Krone & Guan, 2006; Mochizuki et al., 2006). These individual-based lattice models are of several types. Our model – and many of those cited above –belongs to the family of discrete-space continuous-time stochastic models known as interacting particle systems (IPS) or asynchronously updated stochastic cellular automata (CA). While the term CA is more familiar to biologists, some confusion can occur if one fails to distinguish between the different types of CA model. Hereafter, we will use the term IPS model. Such models are ideal for investigating the localized interactions that occur in natural microbial communities and can be thought of as providing a microscopic view of such a community down to the level of individual cells.
In this study, our objective was to develop an IPS model that provides a predictive framework for characterizing plasmid transfer and persistence in spatially structured bacterial populations. In order to estimate model parameters and determine how well the model captures these dynamics, we performed a series of experiments that monitored various aspects of plasmid–bacteria interactions on agar plates. The IPS model is shown to match both qualitative and quantitative aspects of experimental plate cultures, including features that are not present in liquid cultures and the mass-action differential equations that model them.
MODELS AND METHODS
In this section, we first describe the mathematical model and simulations. This is followed by a description of the parallel experimental procedures. We then link the two by explaining our protocols for parameter estimation and model fitting.
Interacting particle system model for plasmid transfer in spatially structured habitats
Our interacting particle system model is built on a 2D square lattice (of size 500 × 500 or 1000 × 1000) (Fig. 1) with periodic boundary; each site of the lattice can contain nutrients and cells of several types. The commonly used periodic boundary conditions, equating the top edge of the lattice to the bottom edge and the left edge to the right edge, eliminate complicating edge effects. To see how length scales in the IPS model compare to those in experiments, just note that lattice points correspond to the locations of individual cells. Thus accounting for a cell size of about 1 or 2 μm and intercellular distances also on the order of a micrometre, and with hundreds (up to 1000) of lattice points per side for a typical simulation grid in this paper, we should consider our viewing window to be one to several millimetres per side.
Fig. 1.
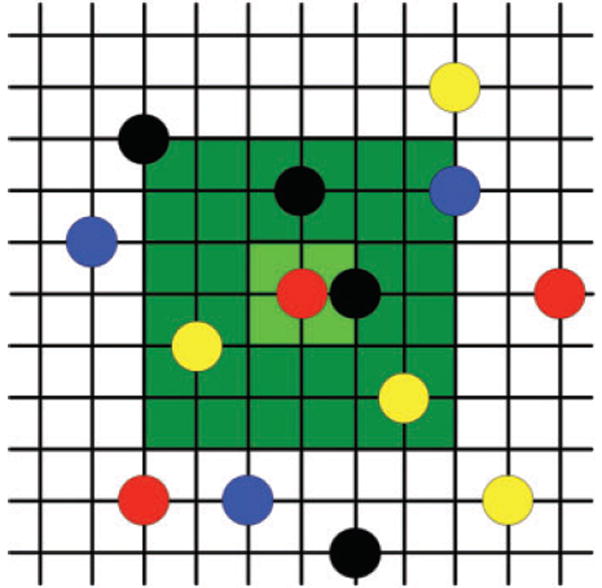
Lattice structure of IPS model. Coloured circles represent different cell types, the 9 sites in the light green square indicate the local growth neighbourhood for the central site, and the 49 sites combined in the light green and dark green regions constitute the nutrient neighbourhood for the central site. The model employs periodic boundary conditions.
The initial plasmid-bearing cells are called donors, the plasmid-free cells recipients, and recipients that have acquired a plasmid transconjugants. Throughout, we use the shorthand C, nutrient; R, recipient; D, donor and T, transconjugant. Bacteria do not form monolayers on agar plates; rather, diffusion of nutrients from the surrounding region and the bottom allows cells to ‘pile up’ somewhat. In addition, there are often gaps between sections of a large growing colony that are clearly visible to the unaided eye. These inhomogeneities in colony morphology play a role in determining the types of interactions that can occur. Thus, instead of working with a ‘flat’ 2D model that allows at most one cell per site, we give our model a hint of 3D structure by allowing up to two cells per site. This is a small change and does not slow down the simulations excessively, and it even provides some of the aforementioned gap structure that is not accounted for in a flat 2D model (data not shown). (A full 3D model is considerably more complex and requires large increases in simulation time. We will investigate such a model elsewhere. Our goal here is to determine the extent to which the dynamics can be accounted for by a 2D model.) Because of our restriction to a small number of cells per site and the desire to capture aspects of the gap formation observed within large colonies (see Fig. 2), we employ a simple device for allocating nutrients: we assume that nutrients come in discrete units with at most one per site. This restriction is not as severe as might first appear since cells are allowed to consume nutrients from within a fairly large neighbourhood.
Fig. 2.
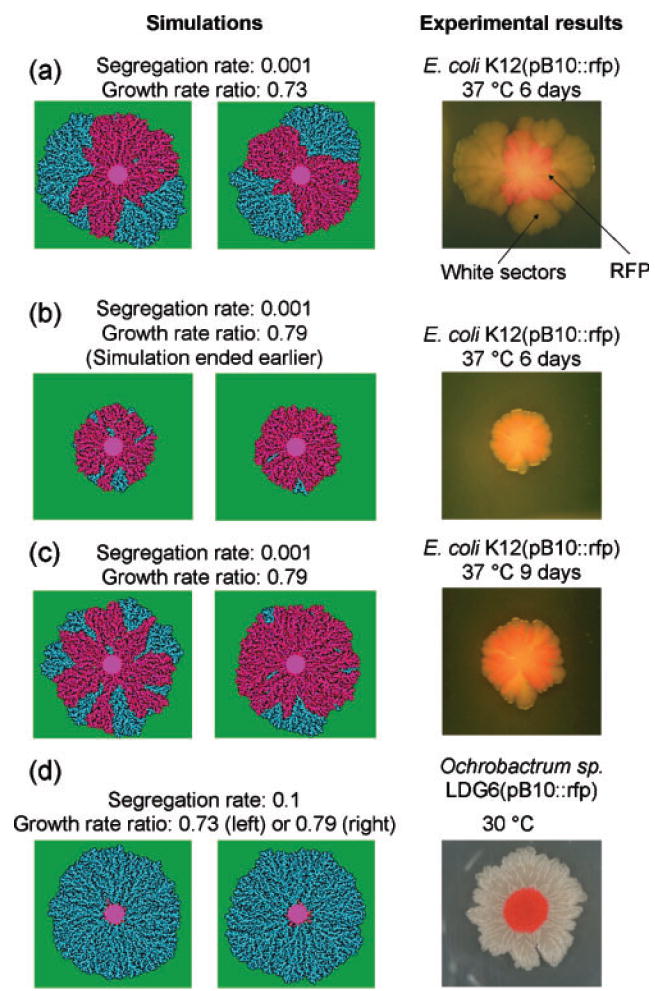
Simulations (left) and photographs (right) of patterns of plasmid loss in two different bacteria bearing plasmid pB10 ∷ rfp. In (a–c), two examples of simulation results are given to illustrate variability between runs. In experiments: white, segregants; pink, plasmid-bearing cells. In simulations: green, nutrients; light blue, 2 recipients; dark blue, 1 recipient; pink, 2 donors or transconjugants; red, 1 donor or transconjugant. The conjugation rate was set to 1 for all four simulations, recipient maximal growth rate was 1, and θ1=1, θ2=2. Spatial scales: for simulations and for experiments, the region shown corresponds to approximately 1 mm and 5 cm per side, respectively.
Thus, a given site can be empty, contain a single unit of nutrient, contain one cell or contain two cells, with the possibility of cells and nutrient at the same site. The cells can be of any type (R, D, T) and cells located at the same site need not have the same type. Since this is intended to be a 2D model, we do not consider any ordering of the cells (say, top and bottom) at a site; we keep track only of the number of cells of each type at a given site. A reproduction event is assumed to result in the consumption of one unit of nutrient. In the current model other events, such as conjugation, do not deplete nutrients, although their rates may depend on local nutrient concentrations.
To specify the rates at which a site changes its state, we employ two types of neighbourhood. A ‘local neighbourhood’ specifies which sites are neighbours for the purposes of determining conjugation events and the location of daughter cells after cell division. We use a ‘nutrient neighbourhood’ to determine the amount of nutrient accessible to a given site. To account for nutrient diffusion, we make the nutrient neighbourhood larger than the local neighbourhood. In the simulations presented here, we took the local neighbourhood of a given site x to be the 9 sites on the lattice consisting of the 8 adjacent sites plus the site itself (i.e. all the sites in the 3 × 3 box centred at x); the nutrient neighbourhood consisted of the 49 sites in the 7 × 7 box centred at x (see Fig. 1). Mathematically, this means that local neighbours are within an L∞ distance one of the site and nutrient neighbours are within distance three. (The L∞ distance, sometimes called the ‘city block’ distance, between two sites on the lattice is the smallest number of left–right plus up–down lattice steps it takes to go from one site to the other.) We remark that the exact shape of the neighbourhoods (square, round, etc.) has no significant effect on the behaviour of the system as long as neighbourhood sizes are not large (data not shown), so it is fairly common practice to use square neighbourhoods. The number of sites in a neighbourhood does have an effect.
When rates in the model depend on nutrient levels, we assume this functional dependence is of the following flexible form that we refer to as ‘sigmoidal’. We specify a minimum and a maximum growth rate, say ψmin (always taken to be 0 here) and ψmax, as well as two thresholds, θ1≤ θ2. For nutrient level C<θ1, ψ(C)=ψmin, denoting a minimum rate that does not require nutrients; for C>θ2, ψ(C)=ψmax; and in between the rate increases linearly with C. In addition to this general functional form (sometimes referred to as Blackman kinetics), which is a reasonable approximation to the usual Monod rate curves, note the following special cases. To get a constant rate, set θ1= θ2=0, yielding ψ(C)=ψmax; to get a rate that depends on C only in a threshold manner, set θ1= θ2= θ>0, yielding ψ(C)=ψmin for C<θ and ψ(C)=ψmax for C>θ. Now we are ready to specify the rules according to which sites change their states. Note that, unlike the case of mass-action models that are based on bulk concentrations and densities that must be specified in terms of units, the individual-based nature of the IPS model means that ‘rates’ simply signify (inverse) times until given events occur.
Reproduction
Cells are assumed to divide at rates that depend on the amount of nutrient in the nutrient neighbourhood of the cell, with a daughter cell deposited onto a site randomly chosen from among those in the local neighbourhood, and with the proviso that there can be no more than two cells per site; if there is no available space within the local neighbourhood, the reproduction event is suppressed and no nutrient is consumed. This assumption, while standard in 2D IPS models, is obviously an abstraction of reality. The intent is to provide a simple mechanism that prevents cells from piling up in the model – thus maintaining the 2D structure – via a kind of local carrying capacity (see the comments at the end of this subsection). We specify at a given site x a per cell growth rate ψ(x,C) that is a sigmoidal function of the number of nutrient sites C within the nutrient neighbourhood of such a cell at that site. Since the growth rate can be different for different cell types, we use subscripts to distinguish them. Thus, if a site x contains nR(x) recipient cells, nT(x) transconjugant cells and nD(x) donor cells (with nR(x)+ nT(x)+ nD(x)≤2), the total growth rate from that site will be nR(x)ψR(x,C)+nT(x)ψT(x,C)+nD(x)ψD(x,C), with the probability of a given type of offspring being given by the ratio of the appropriate rates. Note that the dependence of the above quantities [e.g. nR(x), ψT(x,C), etc.] on the site x is only due to the locations of the appropriate neighbourhoods. We sometimes suppress this part of the notation [e.g. nR, ψT(C), etc.] in the interest of brevity.
Segregative loss
Segregative plasmid loss occurs with probability τ when a daughter of a plasmid-bearing cell (D or T) fails to receive a plasmid molecule during cell doubling. Thus, when a transconjugant divides, the daughter cell will be a T with probability 1−τ (resulting in vertical transmission of the plasmid) and an R with probability τ. In this paper, we do not take into account the copy number of the plasmid within a cell; we only distinguish between plasmid-free and plasmid-containing cells.
Conjugation
We assume that horizontal transfer of plasmids occurs at conjugation rates γD(C) (for donors) and γT(C) (for transconjugants), where these rate functions are again assumed to have a general sigmoidal shape, as discussed above. Thus, a recipient cell at site x becomes a transconjugant at rate γD(x,C)nD(x)+γT(x,C)nT(x).
Repression
For F-like plasmids, conjugative pili synthesis can be repressed with a resultant reduction in plasmid burden and conjugation rate. Hence, when considering repressible plasmids, we will have two growth rates ψT(C)<ψT*(C) for derepressed and repressed transconjugants, respectively, where T* refers to repressed transconjugants. Cells that have recently acquired the plasmid by conjugation (horizontal transmission) are assumed to be transitorily derepressed and have a conjugation rate γT; at rate ρ, such a plasmid becomes repressed and the conjugation rate changes to a much smaller value γT*. This repression rate is assumed to be constant and can be thought of loosely as an age-dependent change in a transconjugant cell. In the case of repressible plasmids, all donor cells and transconjugants that arise via vertical transmission are assumed to have the repressed conjugation rate (Lundquist & Levin, 1986). Below, we mostly consider permanently derepressed plasmids, but also have some comments about modelling experiments involving repressible plasmids.
Time
In a typical ‘simulation time’ step, a site in the lattice is selected at random to be updated. Whether or not this happens, and how the site is updated if an update occurs, is determined by the appropriate rates described above. Thus, sites are updated asynchronously and at random. We matched simulation time with real-time by assuming a doubling time of 40 min for recipient cells at 30 °C when nutrients are not limited.
Nutrient diffusion
We implement this feature by allowing nutrients to be consumed from anywhere within the nutrient neighbourhood. To make consumption of nutrients somewhat similar to what occurs via actual nutrient diffusion, the model requires a reproducing cell to attempt to consume nearby nutrients first. More specifically, if the site of the daughter cell contains nutrients, then these are the nutrients that are consumed. If there are no nutrients at this focal site, one of the eight neighbouring sites is chosen at random to provide the nutrients. If no nutrients are found at this site, we move to a randomly chosen site in the ring of sites that are distance 2 away, etc. If no nutrients have been found after sampling a site from each ring (i.e. at distances 1, 2 and 3) in the nutrient neighbourhood around the focal site, we return to sample a site at distance 1 (that was not previously sampled), etc. If nutrients are available within the nutrient neighbourhood, they will eventually be found by this procedure. In addition, the nutrient search is symmetric and has the effect of making nearby nutrients much more likely to be consumed. Indirectly, it also leads to a net ‘flow’ of nutrients being towards clusters of cells due to the disproportionate consumption of resources based on proximity and abundance of cells. While this simple approach to nutrient diffusion is not nearly as sophisticated as those currently being used in biofilm simulations (see Xavier et al., 2005; Chambless et al., 2006, and the references within for two recent approaches), it has the advantage of being computationally less expensive – something we are keenly interested in due to our long-range plans for large-scale simulations that require much larger grid sizes. The discrete units of nutrient, while a crude approximation to reality, have the effect of generating an incipient fractal structure similar to what we and others have observed in bacterial colonies during extended growth on LB agar (Matsuyama & Matsushita, 1992); in particular, the simulated colony morphologies have clusters of cells separated by gaps.
Experimental setup
Strains and media
Escherichia coli K12 MG1655 (ATCC 47076) was used as the main bacterial plasmid host throughout this study. To be able to distinguish isogenic donor and recipient strains by selective plating, we constructed two antibiotic-resistant mutants of this strain. As donor, a mutant was used that was made resistant to rifampicin (Rif) by inoculating a colony of MG1655 in LB broth amended with Rif (50 mg l−1) (LBRif50) and incubating the culture until growth was observed. RifR mutants were then isolated and purified on LB agar with 50 mg Rif l−1. One such mutant strain was designated K12Rif. A similar approach was used for obtaining nalidixic acid resistant (NalR) mutants using LB with a final concentration of 30 mg Nal l−1 (LBNal30), yielding strain K12Nal, which was used as recipient.
Our model plasmid was the 64.5 kb broad-host-range IncP-1β plasmid pB10, which confers resistance to four antibiotics (tetracycline, amoxicillin, streptomycin and sulfonamides) and mercury, transfers to various hosts at very high rates (Dröge et al., 2000), and has been completely sequenced (Schlüter et al., 2003). A marked derivative of pB10 (pB10 ∷ rfp) has been constructed previously by insertion of the dsRed gene cassette (rfp) to visually distinguish between plasmid-containing (red fluorescent) and plasmid-free (white) cells (De Gelder et al., 2005). Plasmid pB10 ∷ rfp was transferred to K12Rif in plate matings as described previously (Lejeune et al., 1983), with selection on LB amended with Rif (100 mg l−1) and tetracycline (Tc) (10 mg l−1). From this point on, medium abbreviations include the type of medium (LB), the antibiotic(s) and their respective concentrations, e.g. LBRif100Tc10.
Ochrobactrum sp. LDG6(pB10 ∷ rfp) was obtained previously as an activated sludge isolate that acquired the plasmid in matings between a sludge sample and Pseudomonas putida SM1443(pB10 ∷ rfp) (De Gelder et al., 2005; L. De Gelder & E. M. Top, unpublished). Based on a 1132 bp 16S rRNA sequence, the phylogenetic affiliation of LDG6 was in the vicinity of the genus Ochrobactrum (I. Cleenwerk, personal communication), with Pseudochrobactrum asaccharolyticum and Pseudochrobactrum saccharolyticum as its phylogenetically closest neighbours (99.9 and 99.8 % 16S rDNA sequence similarity, respectively) (data not shown).
Monitoring of sector formation
To monitor the appearance and spread of plasmid-free segregants in colonies growing on agar plates (15 g agar l−1), liquid cultures of cells containing pB10 ∷ rfp, grown overnight in LB with Tc (10 mg l−1 for K12 strains, 20 mg l−1 for LDG6) and kanamycin (50 mg l−1) were centrifuged, resuspended in saline and diluted 10 times, and 1 μl was dropped onto LB agar plates, which were subsequently incubated at 30 or 37 °C. The appearance of white sectors in the expanding colonies was indicative of subpopulations that had lost the plasmid. At different time points photographs were taken with a Nikon D100 digital camera, and colour contrast and brightness adjusted using Adobe Photoshop CS2 (9.0.2).
Filter mating procedures
Plasmid transfer experiments for which quantitative results are reported were performed using 0.45 μm pore, 25 mm diameter filters (Whatman) on LB agar plates (15 g agar l−1) essentially as described before (Top et al., 1992). Liquid cultures of donor and recipient strains were grown overnight at 30 °C in LB broth (with Tc 10 μg ml−1 for the donor), and centrifuged and resuspended in an equal volume of LB broth. These suspensions were further diluted to obtain the desired initial densities of parental strains. First, 5 μl recipient suspension was placed in the centre of a sterile filter on top of an LB agar plate and allowed to dry, then the donor suspension was placed on top. Sufficient replicate filters were prepared to allow sampling of at least triplicate filters at various time points. The plates were incubated at 30 °C. The droplet of cells dried in less than 1 min, thus limiting the amount of time cells spent in a liquid environment. The diameter of the circular surface covered by cells was measured, and later used to calculate the population densities per mm2. To count the donor, recipient and transconjugant populations at time t, the filters were resuspended in 3 ml or 1 ml saline, and the respective population densities were enumerated by serially diluting the suspensions in saline and plating the appropriate dilutions on three different selective media using a spiral plater (Spiral Biotech). The colony counts were determined using a QCount automatic colony counter (Spiral Biotech). C.f.u. of donors were enumerated by plating on LBRif50Tc10, recipients on LBNal30 and transconjugants on LBNal30Tc10. Since Nal is an immediate inhibitor of DNA synthesis and conjugal DNA transfer, it helps to eliminate erroneous results due to transconjugant formation on the selective plates after the filter mating (Cozzarelli, 1977; Bradley et al., 1980). Appropriate controls of donor and recipient cultures placed separately on filters were always included, and no or insignificant numbers of colonies (antibiotic resistant mutants) were observed on the selective medium when plating these undiluted control suspensions.
Measurements of doubling time and radius expansion rates
To determine the approximate doubling times of the E. coli strains in pure cultures on filters, essentially the same set-up was used as described under ‘filter mating procedures’. Separate cultures were inoculated on filters at low initial densities (1000-fold diluted overnight cultures) and numbers of c.f.u. per mm2 were determined every hour by diluting and plating. The lag phase (the period after inoculation during which no significant growth was observed) was approximately 3 h, and the average doubling time for recipients during the exponential growth phase was approximately 40 min.
The colony radius expansion rate, also called radial growth rate, was determined as a relative measure for the growth rate parameters used in the model (see parameter estimations below). This was done by inoculating an overnight-grown culture on LB agar or on a filter on top of agar (depending on the corresponding experiment for which growth rates were estimated, Fig. 2 or 5), and monitoring the growth of the colony, an approach very similar to that of Pirt (1967). For the cultures grown on filters (corresponding to data in Fig. 5), six replicate colonies were monitored. Cultures grown overnight in LB (with or without Tc) were centrifuged and resuspended in saline and diluted tenfold, and 5 μl was spotted in the middle of filters on separate agar plates, which were incubated at 37 °C. The growing colonies were photographed twice daily during 5 days using the QCount colony-counter camera (Spiral Biotech), and the colony diameters were measured on printed photographs. The average radial growth rate was calculated from the average slope of the linear regression curve for colony radius plotted vs time (5 days). For the radial growth rate measurements of colonies grown directly on the surface of LB agar plates (corresponding to data shown in Fig. 2), a different method was used, since at 37 °C plasmid-free white sectors were already forming in the E. coli colonies as soon as 24 h after inoculation, which prevented accurate measurements of diameters over consecutive days. Here, cultures were centrifuged and resuspended in saline, diluted ten times and 1 μl was spotted onto LB agar plates in triplicate, and incubated at 30 or 37 °C (corresponding to colony patterns shown in Fig. 2), and the surface area was measured every 2 h between 12 and 24 h after inoculation. This was done by taking photographs using the QCount colony-counter camera (Spiral Biotech), importing the images into ImageJ (http://rsb.info.nih.gov/ij/), determining the pixel area and calculating the colony radius from that area. In contrast to the observations of Pirt (1967), the colony radius growth rates were constant not only on plain agar within 24 h, but also on filters during 5 days.
Fig. 5.
Time series of (a) donor, (b) recipient, and (c) transconjugant densities during transfer of plasmid pB10 ∷ rfp between E. coli strains on filters. Solid lines, simulations; dotted lines, experimental data (means from duplicate mating experiments). Grid, 1000 × 1000. Grids were initialized with a fraction 0.00068 of T, 0.0202 of R and 0.0202 of D. Maximum growth rates, ψR=1, ψD=1.01, ψT=0.98; minimum growth rates: 0; τ=0.00001; γDmax=γTmax=1; γDmax=γTmax=0.1 θ1=0, θ2=4. Subscripts are as in Fig. 3.
Estimating parameters for IPS models via spatial data
The rates of horizontal transfer, growth, etc. in the IPS model are fundamentally different from those in the mathematical models for well-mixed liquid systems; indeed, a central theme of this paper is that spatial structure has a profound effect on the population dynamics of plasmid–bacteria systems. Thus, the corresponding rates found in mass-action models (Simonsen et al., 1990) are not a priori appropriate for use in IPS models for plasmid–bacteria dynamics on surfaces, and we must estimate these rates for our model based on spatial empirical data. Another reason for scepticism in applying parameter estimates from liquid experiments to surface populations is the fact that surface-attached bacteria can be physiologically quite different from their planktonic counterparts (Beloin et al., 2004).
We employed two approaches to obtain empirical estimates of the parameters in the IPS model. The first approach was to use visual observations of the patterns of plasmid loss during bacterial growth on an agar surface to make qualitative comparisons of colony morphology. Once our model captured the essential qualitative features of the experimental system, we then further fine-tuned it using a second approach. This involved enumeration of the densities of the donor, recipient and transconjugant populations over time and under different conditions after they have been mixed on membrane filters on top of agar plates.
The IPS model contains many more degrees of freedom than a typical ODE model. This is useful for capturing the microscopic mechanisms that drive the system, but it also means that one must use multiple ‘points of view’ to narrow the possibilities. For example, by fitting the model – using a fixed set of parameters – to experimental measurements at multiple time points, and starting from multiple configurations (e.g. plasmid-bearing cells mixed with plasmid-free cells on the plate vs localized clusters of plasmid-bearing cells) and different cell densities, one can guard against over-parameterization. The key is that, while well-mixed liquid cultures and their ODE models are only able to treat bulk averages, spatial cultures and their (stochastic) IPS models provide an abundance of distinguishable patterns and measurements (cf. Fig. 2).
To a certain extent, one can use macroscopic observations for inference about microscopic processes. Bacterial growth on an agar surface is probably only ‘exponential’ for a short period of time, when nutrients are locally plentiful, and the cells grow in three dimensions, away from the agar surface (vertically) as well as horizontally over the surface. After a short time, vertical growth slows down locally due to nutrient depletion, and most of the growth is horizontally directed (Pirt, 1967; Wimpenny, 1979). Because of this growth pattern, maximum growth rates of bacterial populations determined in the exponential growth phase of a liquid culture may not be relevant.
The roughly circular shape and constant rate of radial spread that is a standard feature of most bacterial colonies growing on agar plates (at least over moderate time intervals; Pirt, 1967) is consistent with a well-known mathematical result known as the ‘shape theorem’ in IPS models (Durrett, 1988). In the IPS model, this circular shape is easy to understand. Since the colony spreads due to reproduction events by cells bordering unoccupied sites, the rate at which an unoccupied site on the boundary of an expanding colony becomes occupied is proportional to the number of neighbouring lattice sites that contain a cell. Alternatively, one can think of the cells on the advancing wavefront as racing to claim unoccupied sites. Unoccupied sites that are lagging behind the wave (corresponding to dents in the wavefront) will typically be in contact with more cells than a typical unoccupied site at a smooth part of the wave, and hence it has a higher ‘birth’ rate. This acts to fill in the dents along the wavefront. Similarly, protrusions in the wave lead to neighbouring vacant sites that are in contact with very few cells. Thus the average speed of such a part of the wavefront will be lower than the smooth part of the wave. In other words, although stochasticity results in the wavefront being irregularly shaped, the aforementioned differences in local reproduction rates result in the wavefront being self-correcting, thus maintaining the global circular shape of the wave. This ‘emergent behaviour’ is quite robust and does not depend much on the specific details of the model. The fact that such behaviour can be captured by a variety of models says something important about how prevalent it should be in nature; namely, it is a very general phenomenon and not one that applies only to a few species under strict environmental conditions. For a discussion of experimental aspects of this constant rate of radial growth – including the effects of various environmental variables – and an alternative modelling approach, see Pirt (1967) and Wimpenny (1979).
Our estimates of relative growth rate parameters for the different plasmid-bearing (p+) and plasmid-free (p−) strains (ψp+/ψp−) were based on relative radius expansion rates (also called wave speeds) of the respective colonies growing on filters or on agar. We hereby assumed that the rate of radial spread of a single-species colony is proportional to the growth rate of the constituent bacteria. This corresponds to model-based considerations; for further details and some experimental evidence of this linear relationship, refer to the Discussion section. We verified the linear dependence of wave speed on growth rate in the model by physically measuring rates of spread on the computer screen for different values of growth rates (data not shown). That this is to be expected in the simulations can also be seen by considering the wave front of a colony that is spreading to the right. Since the environment at the leading edge of the expanding colony is essentially unchanging, new offspring are produced at the wavefront at a rate proportional to the maximum growth rate, and each such offspring has a positive probability of being deposited one lattice site to the right. Thus, if the wavefront is observed at times t1<t2, the distance travelled should be d(t1, t2)≈c (t2−t1), and so the wave speed can be estimated by c=d(t1,t2)/(t2−t1). If this measurement is made for two different growth rates, ψ1 and ψ2, one can estimate the corresponding speeds, c(ψ1) and c(ψ2); hence, the relative growth rates are obtained by ψ2/ψ1= c(ψ2)/c(ψ1). Plasmid cost to the host can be estimated from these relative growth rate calculations. If ψp+ and ψp− are the estimated growth rates for plasmid-containing and plasmid-free populations, respectively, in the above equation, then 1−(ψp+/ψp−) represents the plasmid cost (Lenski, 1988). Since radius measurements were done over only 1 or 5 day periods and the radius increased linearly with time, no significant host-plasmid adaptation confounding the measurements was expected.
Steps in parameter estimation and model fitting
1. Calibrating the clock in simulations
In simulations of our own experiments, we synchronized the timescale in the simulations with actual time in the experiments (Fig. 5) so as to facilitate comparison of observations at specific time points. To do this, we measured the doubling time of recipient cells at low cell densities under the same experimental conditions as the plasmid transfer experiments (on top of filters on LB agar), and then compared it to the mean time it took to double an equivalent population in the simulation.
2. Growth rates of pure cultures
We estimated the relative growth rates of D, R and T by measuring the wave front velocity as described above.
3. Segregation rates
The segregation rate was chosen to match the rate of appearance of (white) plasmid-free sectors that arose during the radial expansion of a colony of (red) plasmid-bearing cells (Fig. 2). Since these radially expanding colonies are significantly thicker than the one or two cells per site in our model, the ‘effective’ segregation rate that must be used is one or two orders of magnitude larger than what one would use per cell in a fully 3D model. For short-time, low-cell-density simulations (Fig. 5), the segregation rate need not be inflated so much; in fact, these more uniformly dispersed simulations were very insensitive to changes in segregation rates (data not shown).
4. Conjugation and repression rates
This was the final step in parameter estimation and required the most fine-tuning. Conjugation rates were chosen to provide simultaneous matches to densities of D, R and T under the experimental conditions of the corresponding experiments, including both time-series and stationary-phase measurements. F-like plasmids are known to be repressed for transfer, except for transitory derepression in newly formed transconjugants immediately after plasmid transfer (Willetts, 1974). This was built into the model for the data from Simonsen (1990) on the plasmid R1, known to be repressed for conjugative transfer, but not for those of the permanently derepressed mutant R1drd19 (Simonsen, 1990), nor for our empirical data obtained with pB10, since IncP-1 plasmids do not undergo repression of conjugative transfer the way F-like plasmids do (Zechner et al., 2000). An important part of estimating rates of conjugation, repression and growth, was to incorporate the proper nutrient dependence within the framework of the sigmoidal rate functions. Details of nutrient dependence used in each simulation are listed in the corresponding figure legends.
Simulation of plasmid transfer data
When comparing model simulations to experimental data that tracked densities of T, D and R on agar plates and on filters, it was necessary to convert the nominally 3D experimental data to a form that was relevant for the 2D model. This was done both for the stationary-phase densities reported in Simonsen (1990) and obtained by us, and for time-series densities we obtained in our own experiments.
Based on the information of the experimental set-up of previously published experiments (Simonsen, 1990), we transformed transconjugant densities (c.f.u.) per ml into densities per mm2. Our own experimental data were expressed as c.f.u. mm−2, based on the surface area of the filters covered by the cells, which was recorded for each experiment. The 1000 × 1000 grid in the simulations corresponds to an area of approximately 1 mm2, assuming the average size of a cell is 1 μm2. Thus, the initial cell densities in the model (proportion of sites occupied by cells at t=0) were matched with initial densities per mm2 from experiments by assuming that a one-layer lawn of cells on a 1 mm2 agar surface contains about 106 cells. An initial density in the model of 0.01, corresponding to 1 % of the sites being occupied, was thus equivalent to 104 c.f.u. mm−2. Obviously, we were not able to estimate parameters for Simonsen’s experiments to the extent outlined above since we were limited to the measurements reported in the paper. For both Simonsen’s and our experiments the ‘recipient’ densities that are reported represent strict plasmid-free recipient cells. In our study this was done by subtracting the densities of transconjugants from the densities of cells that grew on the selective medium for recipients (which included transconjugants).
RESULTS
The adequacy of the model was tested in two different ways. First, qualitative observations of segregative plasmid loss and other macroscopic aspects of colony morphology in various growing colonies were used to demonstrate the flexibility of the model in capturing essential large-scale components of these colonies. Such qualitative comparisons between experiment and theory are important for establishing the roles of various parameters and ensuring that the model is at least approximately correct. Second, several quantitative data such as densities of transconjugants, donors and recipients as functions of time and of initial cell densities were compared to data simulated by the model using various parameter estimates. The matching of model simulations to observed behaviour in a variety of settings provided insight into the biological mechanisms underlying patterns of plasmid loss and transfer.
Modelling and monitoring patterns of plasmid loss
One of the most readily observable features of radially expanding colonies of cells that harbour a plasmid with a fluorescent marker is the appearance of clonal sectors of non-fluorescent plasmid-free cells, also referred to as segregants. These arise along the colony wavefront when segregation leads to a plasmid-free cell whose progeny have a growth rate that is greater than or equal to that of the majority plasmid-bearing cells. Such sectors, or clonal wedges, are natural in radially expanding colonies and have been investigated with related IPS models in Wei & Krone (2005). We compared the patterns of segregational plasmid loss after cultures of E. coli MG1655 and Ochrobactrum sp. LDG6, bearing plasmid pB10 ∷ rfp, were dropped onto an LB agar plate. The expression of the rfp gene turned the strains bright red in daylight, allowing visual distinction between red fluorescent (‘red’) plasmid-bearing (p+) and white plasmid-free (p−) cells. These observed patterns were then simulated using the IPS model, with parameter values for plasmid loss rate and conjugation rate chosen to give the best fit, whereas the relative growth rates were determined by the radius growth experiments.
Formation of sectors of segregants was monitored for E. coli K12 at 30 and 37 °C, and for Ochrobactrum sp. LDG6 at 30 °C. Within 1–2 days of growth of E. coli K12(pB10 ∷ rfp) at 37 °C, white sectors were detected at the edge of the red circle, and these gradually outgrew the plasmid-bearing cells, forming wide-angled wedges that grew out as ‘fans’ (Fig. 2a). Complete plasmid loss, rather than partial deletion or lack of rfp expression, was confirmed by verifying the loss of at least two plasmid-encoded antibiotic resistance traits (data not shown). Interestingly, the outgrowth of plasmid-free segregants at 30 °C was slightly less dramatic than at 37 °C, with sectors that were narrower, and did not have a fan-like shape (Fig. 2b, c). These narrower sectors at 30 °C suggest a smaller difference in growth rate between p+ and p− cells than at 37 °C, and thus a smaller plasmid cost. This was confirmed in separate experiments that measured the radial growth rate for the p+ and p− cells on LB agar plates at 37 and 30 °C. Based on our measurements and the mathematical relations between radial growth and growth rates, the ratio ψp+/ψp− was estimated to be 0.73 at 37 °C, whereas it was 0.79 at 30 °C. The plasmid cost was therefore 0.27 and 0.21, respectively. It should be noted that part of this cost was due to the expression of the rfp gene (data not shown), since the cost of wild-type pB10 in E. coli K12 in liquid LB was equal to or less than 0.02 (Heuer et al., 2007). Fig. 2(d) clearly shows that Ochrobactrum sp. LDG6 very rapidly lost its plasmid. Since the hosts were naïve to the plasmid, differences in sector formation and growth ratios are the result of host-specific plasmid dynamics. This is consistent with a study in our laboratory using liquid cultures (De Gelder et al., 2007), which showed that plasmid stability was host-dependent.
Using the IPS model, we simulated the observed patterns of plasmid loss and outgrowth of segregants. While the conjugation rate was kept constant in all patterns (γ=1), various growth rate ratios ψp+/ψp− and segregation rates (τ) were tested (Fig. 2). Although these simulations represent a different length scale than the experimental observations (in Fig. 2, centimetres in the photographs, and millimetres in the simulations), the correlations between them were striking. For example, Fig. 2(a–c) show replicate runs of the IPS model for two different ratios of growth rates between p+ and p− cells [0.73 in (a) vs 0.79 in (b)]. The important conclusion from this comparison of the simulation and empirical patterns is that a slightly higher plasmid cost (i.e. lower growth rate ratio) at 37 °C compared to 30 °C resulted in faster growing sectors of p− segregants with wider angles that fanned out very rapidly, while a lower cost resulted in more narrow sectors that fanned out less. Simulations in Fig. 2(d) are results from runs of the model with the same values for ψp+/ψp− as in Fig. 2(a–c), but with a much higher segregation rate. These results show that a very high segregation rate (τ=0.1) results in the red p+ centre being almost immediately and entirely surrounded by segregants (Fig. 2d), while a lower segregation rate (τ=0.001) results in a much more limited number of p− sectors (Fig. 2a–c). Since the very high segregation rate determined the pattern, there was no effect of the cost of the plasmid, and the simulations shown here are for a plasmid cost of 0.27 and 0.21 (Fig. 2d). A comparison with the corresponding colonies of E. coli K12(pB10 ∷ rfp) and Ochrobactrum sp. LDG6(pB10 ∷ rfp) indicates that the segregation rate in the latter isolate is much higher than in E. coli. The models thus helped to interpret the observed patterns of plasmid loss and to provide rough estimates for model parameters associated with plasmid loss and transfer.
We remark that the effect of conjugation rate on the size and shape of the segregant sectors was minimal in the simulations, unless conjugation could occur without nutrients (results not shown); thus, we kept the conjugation rate constant in the simulations shown in Fig. 2. This lack of sensitivity to conjugation rate in sector formation (but not in other experiments, e.g. Fig. 5) appears to be due to the fact that the interface between plasmid-free segregants and plasmid-bearing cells is only briefly exposed to sufficient nutrient levels for conjugation to occur, i.e. while this region is near the wave front. This explanation certainly holds for the simulations and is consistent with the fact that the sectors in the bacterial colonies do not ‘close up’ even after many days. The effect of nutrient availability on conjugation rate and plasmid stability will be addressed more fully in future work. Our goal in modelling the above qualitative patterns was to check the flexibility of the model and the extent to which these patterns could be captured with a simple 2D model. A more detailed analysis will require a model that allows for some 3D structure as well as a matching of length scales by incorporating much larger lattice sizes.
Stationary-phase transconjugant densities as a function of initial cell density
Next, we used our model to simulate some empirical results of Simonsen (1990), who measured the densities of transconjugants, donors, and recipients on agar slides at stationary phase as a function of initial parental cell densities. These experiments were carried out with the IncFII plasmid R1 and its permanently derepressed mutant R1drd19. Plasmid R1 is naturally repressed for conjugative transfer, but known to transfer at higher rates during a temporary derepressed phase in recently formed transconjugants (Willetts, 1974; Lundquist & Levin, 1986). Simonsen found that, for both plasmids, the final densities of transconjugants increased with increasing initial densities of donors and recipients, when the initial relative densities of donor and recipient cells were held constant. This effect was most pronounced for plasmid R1drd19. In contrast, liquid cultures did not exhibit a strong dependence on initial parental cell density, as expected from the mass-action models (Simonsen, 1990). A very similar dramatic effect of spatial structure on plasmid transfer dynamics was also observed by us for the IncP-1 plasmid pB10 ∷ rfp in similar experiments (data not shown). Since IncP-1 plasmids are very different from IncFII plasmids, for example because they transfer much more efficiently on surfaces than in liquid (Bradley et al., 1980), both findings emphasize the importance of spatial structure on the fate of plasmids, and therefore the need for spatially explicit models to predict plasmid dynamics. We have run stationary-phase simulations (stopping the simulation a fixed time after cessation of growth due to nutrient depletion) of the agar slide data of Simonsen (1990) with our IPS model. The simulation results were in good agreement with the experimental data for certain values of the conjugation rate (Fig. 3) in the case of R1drd19, but not for the repressible plasmid R1 (see below). These simulations were not very sensitive to relative growth rates (plasmid cost).
Fig. 3.
Experimental data and model simulations for transfer of plasmid R1drd19 between E. coli cells on agar slides after 30 h of incubation, as a function of initial densities of donor and recipient populations. Dashed lines with open symbols, data from Simonsen (1990); solid lines with filled symbols, data from simulations. □ and ■, recipient; ○and ●, donor; △ and ▲, transconjugants; grid size for simulation, 1000×1000. Maximum growth rates are ψR=1, ψD=ψT=0.9, minimum growth rates are all 0; τ=0.005, θ1=0, θ2=4, γDmax=γTmax=3,γDmin =γDmin=0.03; subscripts are D, donor; (derepressed) transconjugant; R, recipient.
It is worth mentioning that, while we did not have access to sufficient data to fit all of the parameters in our model, the general result of this exercise was that the model captured the most important feature of Simonsen’s experiments; namely, the dependence of transconjugant densities on initial cell density that is absent in liquid cultures and in the corresponding mean-field ODE results. The presence of this feature was evident for a large range of parameters, indicating that it is primarily an effect of the spatial structure. In fact, a look at several snapshots of the simulations starting from different initial densities (Fig. 4) provides a clear understanding of this effect and agrees with Simonsen’s intuition. Indeed, at low cell densities, the dynamics are dominated by the spread of isolated microcolonies of recipients and donors, which only rarely make contact to initiate a round of conjugation. This results in fewer transconjugants than when donor and recipient cells are already in contact from time t=0, which is the case at high initial parental cell densities. This is very different from the situation in a completely mixed liquid system where cells encounter each other randomly, and most conjugation occurs at high cell densities.
Fig. 4.
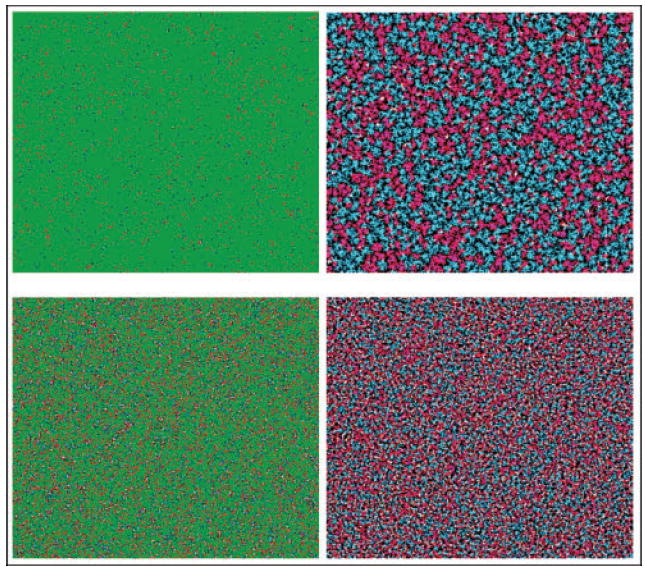
Simulations showing microscopic development of plasmid-bearing (T) and plasmid-free (R) microcolonies. Colours: red, T; white, Ts that arose through conjugation; blue, R; green, nutrient. Pictures are taken from two time points of the same run: left side is just after the start of the simulation, right side is at final (stationary) time. Simulations were initialized at low cell density (top) with a fraction 0.005 of T and 0.005 of R, and at higher cell density (bottom) with fraction 0.05 of T and 0.05 of R. Grid size, 500×500. Maximum growth rates: ψR=1, ψD=ψT=0.73; minimum growth rates: 0; τ=0.005; conjugation rate: 2; θ1=1, θ2=2. The final densities yielded about 44 % T, 56 % R (top) and 57 % T, 43 % R (bottom), with roughly four times as many conjugation events when the initial density of cells was higher (bottom).
We were unable to obtain good fits to Simonsen’s data for the repressed plasmid R1 in the simulations; in particular, the simulations did not produce the significantly less steep curve for T densities as a function of initial cell density (including a three orders of magnitude lower final T density compared to plasmid R1drd19 at the highest initial parental cell density). We see several possible reasons for this. Firstly, accurately modelling repression requires the estimation of twice the number of growth and conjugation rates than for the derepressed mutant and, again, we did not have data that allowed for this. Secondly, our 2D simulations were not expected to perform as well in capturing the behaviour of long-term experiments. This is because the lack of 3D structure in the model limits the amount of growth possible and precludes an accurate depiction of nutrient dependence, at least when the cells are piling up. Finally, the dynamics of repression might be more complex than what we modelled. We plan to investigate this further, starting with our own experiments with a repressible plasmid, and incorporating into the model features such as three-dimensional structure and the initial clustering of cells that are used to inoculate the plate.
Temporal dynamics of plasmid transfer on membrane filters
We compared the population densities of E. coli donors, recipients and transconjugants, measured empirically at several time points during filter matings, with those obtained by the IPS model, using various values for the plasmid conjugation rate. Based on empirical determination of cell numbers during the first hours after inoculation (data not shown), we included a lag phase of 3 h in the model, during which no cell divisions occurred, whereas conjugative transfer could take place. Fig. 5 shows that the simulated transconjugant population densities were in very good agreement with the measured densities during the first 5–6 h. That the simulations underestimated the densities at later time points was expected, since the IPS model does not allow cells to pile up nearly as much as they do on the filters. The simulated data were not very sensitive to changes in the relative growth rates of the three populations. In the simulation shown, the relative growth rates were based on colony radius growth data from parallel experiments with separate cultures of donors, recipients and transconjugants (see legend of Fig. 5 for values). The higher growth rate for the donor strain compared to the recipient, even when carrying the plasmid, is due to the differential effects of the mutations that render the strains RifR and NalR, where K12Nal grows more slowly than K12Rif. (Note that this is different from the results presented in Fig. 2, which were obtained with isogenic non-marked E. coli K12 MG1655 strains grown on LB agar without filters.) In conclusion, the good fit of the simulations of the temporal population dynamics with the data during the first 5 h confirms that our IPS model captures the time-course of formation of transconjugants by conjugative transfer and growth.
DISCUSSION
Self-transmissible plasmids are known to play an important role in rapid bacterial adaptation to changing environmental conditions, e.g. due to the presence of antibiotics or man-made toxic pollutants, but the question of how they are maintained in natural bacterial communities is still unresolved. Do they rely on periodic selection for the host-beneficial traits they encode, or can they persist solely as genetic parasites, i.e. thanks to their ability to horizontally transfer at sufficiently high rates? Although Stewart & Levin (1977) concluded – based on ODE models and experiments with F-like plasmids in completely mixed liquid chemostat systems – that plasmids cannot persist as infectious agents, this conclusion cannot be simply extended to the efficiently transferring promiscuous plasmids of the IncP-1 group. The high transferability of these plasmids on solid surfaces, and the inability of ODE models to simulate bacterial populations in a structured habitat, requires a revision of this nearly 30-year-old point of view. In this study we developed and tested a new mathematical model that represents a first step toward predicting the fate of conjugative plasmids in spatially structured populations.
Mass-action models have helped address many issues pertaining to the spread and persistence of conjugative plasmids in well-mixed liquid cultures, but they do not –and cannot – account for spatial structure; nor can they account for the stochasticity that underlies all biological systems. Models will never provide a perfect fit to the dynamics of laboratory or natural communities, but one valuable asset afforded by the simulations of our IPS models is an opportunity to observe the in silico community with full clarity. Unlike real bacterial communities, which can only be observed and measured incompletely and with considerable difficulty, we can observe cell-for-cell all the details of the simulated community. Thus, an IPS model that accurately reflects the dynamics of the bacterial community under consideration can provide insight into the effects of the various mechanisms that characterize that community.
Note that in specifying the IPS model we only need to specify the rates at which sites change their states. Unlike differential equation models, we do not have to write down equations for how the densities change on larger length scales. The simulation will ‘solve’ this automatically. In a differential equation model, one begins by approximating the real (discrete) system with a continuous system modelling densities on some length scale. This continuous system is then typically ‘solved’ on a computer by running a discretized version of the continuous system in a second layer of approximation (that is typically not a problem). Not only does the IPS model give a more detailed description that is spatially explicit, but also it avoids these approximations.
We emphasize that qualitative comparisons of visual observations are an essential component in fitting a stochastic spatial model to spatially structured experiments. To ignore them on the grounds that they are ‘only qualitative’ would be to exclude valuable information. The fact that our system is spatially structured gives us access to starting configurations that are not available in a liquid setting. Inhomogeneous configurations (e.g. a cluster of plasmid-bearing cells in the centre of a plate containing nutrient medium) can lead to inhomogeneous and random colony morphologies. This allows an aspect of model fitting that is not possible in deterministic models and has the potential to reveal something fundamental about the biological mechanisms involved. For example, liquid cultures and the ODEs that model them can only deal with bulk averages. We consider the visual matching of behaviour in the IPS model with experimental observations to be an important first pass at tuning the model parameters. Indeed, if the model cannot reflect these macroscopic features, then it will have failed to capture critical biological mechanisms. See Grimm et al. (2005) for a survey of recent work in ecology where such matching of spatial patterns has been termed ‘pattern-oriented modelling’.
An example of the usefulness of the semi-quantitative modelling approach was the comparison of the parameter estimates obtained from the IPS simulations of segregant formation in colonies (Fig. 2) between the different bacterial strains or incubation conditions. This approach has provided valuable insight into the relative importance of each of the underlying mechanisms of plasmid loss. Besides the obvious role of segregation in plasmid loss, the importance of differences in fitness between segregants and plasmid-containing cells for the overall stability of a plasmid in a bacterial population is often underestimated. As we showed recently, even when the rate of segregational plasmid loss is low, a plasmid-containing population can be outcompeted by rarely formed segregants when the plasmid cost is significant enough to result in a sweep of segregants (De Gelder et al., 2007). We showed here in Fig. 2(a) that, also on an agar surface, plasmid cost was responsible for the rapid sweep of segregants, represented by the wide white sectors in the colony. Since plasmid cost measurements in liquid cultures are not necessarily representative of dynamics in spatially structured ecosystems, the visual observation and mathematical simulation of plasmid dynamics in bacterial colonies or biofilms may provide a quick way to predict plasmid fate in bacterial populations.
In our simulations, we used relative colony radial growth rates of plasmid-bearing (p+) and plasmid-free (p−) strains, c(ψp+)/c(ψp−), as estimates of the relative growth rate parameters used in the model c(ψp+/c(ψp−). This assumption of a linear relationship between radius and cell growth rates is in contrast with work by Pirt (1967), who concluded a square-root dependence between c and ψ. We based our assumption on both mathematical considerations and empirical observations. For two sets of E. coli K12 strains with and without pB10 ∷ rfp, we compared the relative colony radius expansion rates, c(ψp+)/c(ψp−) with the relative maximum specific growth rates of populations grown separately on agar or filters, ψp+/ψp−. Even though the values of these two ratios were not identical, they were consistently more similar than c(ψp+)/c(ψp−) was to (square-root dependence) (data not shown). Even though our results were not completely conclusive and need further investigation, the data shown in the study of Pirt (1967), a standard reference paper for the assumed square-root dependence, were rather noisy, and there was no rigorous statistical testing of the hypothesis. Mathematically, square root dependence is what would be suggested if the bacteria were able to diffuse. Indeed, by adding diffusion of cells to the IPS model, one obtains an approximate ‘reaction-diffusion equation’ (Durrett & Neuhauser, 1994; Kipnis & Landim, 1999; Krone, 2004) that includes a square root dependence on growth rate in the wave speed (i.e. colony expansion rate) of travelling wave solutions (Murray, 1989). The cells in our experiments do not diffuse or otherwise move in any detectable way. The only movement of cells appears to occur due to displacement of daughter cells at times of reproduction (and some pushing of cells due to reproduction in the interior of the colony). As described in the section Models and Methods, this is consistent with linear dependence on growth rate. A final – and perhaps the most compelling – reason for our claim of linear dependence occurred in the modelling of spatial patterns of plasmid loss (Fig. 2). The simulations were able to capture the empirical observations when we used a linear relationship between relative radius expansion rates and relative growth rates; using square root dependence did not allow adequate simulation of the experimental results, even when other parameters were adjusted. As described in the Model section, because of the fundamental differences in the dynamics of populations grown in spatially structured and homogeneous environments, the empirical determination of parameters such as growth rates, conjugative transfer rate and segregational loss rate cannot simply be based on classical yet well-accepted methods used for liquid cultures, and thus needs further investigation. Moreover, even traditional methods of estimating growth rates, such as c.f.u. counts from resuspended colonies, are known to induce stresses in bacteria that might lead to inaccurate results (Cuny et al., 2007). In future work, we will further explore the relationship between radius expansion rate and growth rate both empirically and mathematically (Neubert & Caswell, 2000).
The observation first made by Simonsen (1990), and now confirmed by us in a different model system, that initial cell densities in spatially structured populations greatly influence the degree of horizontal plasmid transfer, was adequately simulated by our spatial IPS model, while it is not predicted by ODE models. This is a very good example of why spatial models are needed to correctly predict the fate of plasmids in bacterial communities. We can now further investigate whether spatial structure positively or negatively influences the overall survival of a plasmid in the absence or intermittent presence of selection. In other words, is plasmid persistence and even invasion more or less likely in structured than unstructured habitats? The absence of global competition in biofilms or microcolonies may well allow for pockets of plasmid-containing populations that would otherwise be outcompeted in mixed systems. Moreover, plasmids have been shown to stimulate biofilm formation (Ghigo, 2001; Reisner et al., 2003), and efficiently transfer in such structures (Ehlers & Bouwer, 1999; Hausner & Wuertz, 1999; Ehlers, 2000; Molin & Tolker-Nielsen, 2003). A further extension of our model to three dimensions should allow us to make predictions about the fate of plasmids in biofilms.
In conclusion, we have demonstrated that our IPS model for plasmid population dynamics in spatially structured habitats adequately simulates spatial patterns of plasmid loss and horizontal transfer. The model performed especially well in matching results of short-time plasmid transfer experiments (up to about 5 h), and captured essential features of plasmid loss in bacterial colonies. Our goal was to provide only essential aspects of the overall spatial structure observed for bacterial populations on agar plates. Such a model has advantages over a more detailed model since we are able to see that even this (basically 2D) level of spatial structure, with coarse nutrients and a simple approximation to diffusion, is able to account for a great deal of the structure and temporal dynamics we observe experimentally. In particular, we found that the short-term spatio-temporal dynamics did not require modelling 3D structure, whereas this was not always true for long-term dynamics. Further development of this model, and extensions to three dimensions and to multi-strain and multi-species ecosystems, will be helpful in improving our understanding and predictions of the fate of plasmids in spatially structured microbial communities. This may further contribute to the search for ways to limit the spread of plasmids that confer antibiotic resistance or, conversely, to stimulate the dissemination of plasmids that encode useful traits, such as pollutant degradation.
Acknowledgments
This project was supported by NIH Grant 1 R01 GM73821, NIH Grant P20 RR16448 from the COBRE Program of the National Center for Research Resources and by NIH Grant P20 RR016454 from the INBRE Program. We wish to thank Stacey Poler for technical assistance, Leen De Gelder for providing strains LDG6 with pB10 ∷ rfp, Yongtao Guan and Xue Zhong for help with the code and Larry Forney for helpful discussions. Finally, we thank several anonymous referees and the associate editor for their detailed suggestions that led to improvements of this manuscript.
Abbreviations
- C
nutrient
- CA
asynchronously updated stochastic cellular automata
- D
donor
- HGT
horizontal gene transfer
- IPS
interacting particle systems
- ODE
ordinary differential equation
- R
recipient
- T
transconjugant
References
- Beaudoin DL, Bryers JD, Cunningham AB, Peretti SW. Mobilization of broad host range plasmid from Pseudomonas putida to established biofilm of Bacillus azotoformans. II. Modeling. Biotechnol Bioeng. 1998;57:280–286. [PubMed] [Google Scholar]
- Beloin C, Valle J, Latour-Lambert P, Faure P, Kzreminski M, Balestrino D, Haagensen JA, Molin S, Prensier G, et al. Global impact of mature biofilm lifestyle on Escherichia coli K-12 gene expression. Mol Microbiol. 2004;51:659–674. doi: 10.1046/j.1365-2958.2003.03865.x. [DOI] [PubMed] [Google Scholar]
- Bergstrom CT, Lipsitch M, Levin BR. Natural selection, infectious transfer and the existence conditions for bacterial plasmids. Genetics. 2000;155:1505–1519. doi: 10.1093/genetics/155.4.1505. [DOI] [PMC free article] [PubMed] [Google Scholar]
- Bradley DE, Taylor DE, Cohen DR. Specification of surface mating systems among conjugative drug resistance plasmids in Escherichia coli K-12. J Bacteriol. 1980;143:1466–1470. doi: 10.1128/jb.143.3.1466-1470.1980. [DOI] [PMC free article] [PubMed] [Google Scholar]
- Chambless JD, Hunt SM, Stewart PS. A three-dimensional computer model of four hypothetical mechanisms protecting biofilms from antimicrobials. Appl Environ Microbiol. 2006;72:2005–2013. doi: 10.1128/AEM.72.3.2005-2013.2006. [DOI] [PMC free article] [PubMed] [Google Scholar]
- Christensen BB, Sternberg C, Andersen JB, Eberl L, Moller S, Givskov M, Molin S. Establishment of new genetic traits in a microbial biofilm community. Appl Environ Microbiol. 1998;64:2247–2255. doi: 10.1128/aem.64.6.2247-2255.1998. [DOI] [PMC free article] [PubMed] [Google Scholar]
- Costerton JW, Lewandowski Z, De Beer D, Caldwell D, Korber D, James G. Minireview: biofilms, the customized microniche. J Bacteriol. 1994;176:2137–2142. doi: 10.1128/jb.176.8.2137-2142.1994. [DOI] [PMC free article] [PubMed] [Google Scholar]
- Cozzarelli NR. The mechanism of action of inhibitors of DNA synthesis. Annu Rev Biochem. 1977;46:641–668. doi: 10.1146/annurev.bi.46.070177.003233. [DOI] [PubMed] [Google Scholar]
- Cuny C, Lesbats M, Dukan S. Induction of a global stress response during the first step of Escherichia coli plate growth. Appl Environ Microbiol. 2007;73:885–889. doi: 10.1128/AEM.01874-06. [DOI] [PMC free article] [PubMed] [Google Scholar]
- Daubin V, Moran NA, Ochman H. Phylogenetics and the cohesion of bacterial genomes. Science. 2003;301:829–832. doi: 10.1126/science.1086568. [DOI] [PubMed] [Google Scholar]
- De Gelder L, Vandecasteele FPJ, Brown CJ, Forney LJ, Top EM. Plasmid donor affects host range of the promiscuous IncP-1β plasmid pB10 in an activated sludge microbial community. Appl Environ Microbiol. 2005;71:5309–5317. doi: 10.1128/AEM.71.9.5309-5317.2005. [DOI] [PMC free article] [PubMed] [Google Scholar]
- De Gelder L, Ponciano JM, Joyce P, Top EM. Stability of a promiscuous plasmid in different hosts: no guarantee for a long-term relationship. Microbiology. 2007;153:452–463. doi: 10.1099/mic.0.2006/001784-0. [DOI] [PubMed] [Google Scholar]
- Dieckmann U, Law R, Metz JAJ. The Geometry of Ecological Interactions: Simplifying Spatial Complexity. Cambridge: Cambridge University Press; 2000. [Google Scholar]
- Dröge M, Pühler A, Selbitschka W. Phenotypic and molecular characterization of conjugative antibiotic resistance plasmids isolated from bacterial communities of activated sludge. Mol Gen Genet. 2000;263:471–482. doi: 10.1007/s004380051191. [DOI] [PubMed] [Google Scholar]
- Durrett R. Lecture Notes on Particle Systems and Percolation. Belmont, CA: Wadsworth; 1988. [Google Scholar]
- Durrett R, Levin SA. The importance of being discrete (and spatial) Theor Popul Biol. 1994a;46:363–394. [Google Scholar]
- Durrett R, Levin SA. Stochastic spatial models: a user’s guide to ecological applications. Philos Trans R Soc Lond B Biol Sci. 1994b;343:329–350. [Google Scholar]
- Durrett R, Levin SA. Allelopathy in spatially distributed populations. J Theor Biol. 1997;185:165–172. doi: 10.1006/jtbi.1996.0292. [DOI] [PubMed] [Google Scholar]
- Durrett R, Levin SA. Spatial aspects of interspecific competition. Theor Popul Biol. 1998;53:30–43. doi: 10.1006/tpbi.1997.1338. [DOI] [PubMed] [Google Scholar]
- Durrett R, Neuhauser C. Particle systems and reaction diffusion equations. Ann Probab. 1994;22:289–333. [Google Scholar]
- Ehlers LJ. Gene transfer in biofilms. In: Allison DG, Gilbert P, Lappin-Scott HM, Wilson HB, editors. Community Structure and Co-operation in Biofilms (Society for General Microbiology Symposium no. 59) Cambridge: Cambridge University Press; 2000. pp. 215–256. [Google Scholar]
- Ehlers LJ, Bouwer EJ. RP4 plasmid transfer among species of pseudomonas in a biofilm reactor. Water Sci Technol. 1999;39:163–171. [Google Scholar]
- Freter R, Freter RR, Brickner H. Experimental and mathematical models of Escherichia coli plasmid transfer in vivo and in vitro. Infect Immun. 1983;39:60–84. doi: 10.1128/iai.39.1.60-84.1983. [DOI] [PMC free article] [PubMed] [Google Scholar]
- Funnell BE, Phillips GJ. Plasmid Biology. Washington, DC: American Society for Microbiology; 2004. [Google Scholar]
- Ghigo JM. Natural conjugative plasmids induce bacterial biofilm development. Nature. 2001;412:442–445. doi: 10.1038/35086581. [DOI] [PubMed] [Google Scholar]
- Gogarten JP, Doolittle WF, Lawrence JR. Prokaryotic evolution in the light of gene transfer. Mol Biol Evol. 2002;19:2226–2238. doi: 10.1093/oxfordjournals.molbev.a004046. [DOI] [PubMed] [Google Scholar]
- Grimm V, Revilla E, Berger U, Jeltsch F, Mooij WM, Railsback SF, Thulke HH, Weiner J, Wiegand T, DeAngelis DL. Pattern-oriented modeling of agent-based complex systems: lessons from ecology. Science. 2005;310:987–991. doi: 10.1126/science.1116681. [DOI] [PubMed] [Google Scholar]
- Haagensen JAJ, Hansen SK, Johansen T, Molin S. In situ detection of horizontal transfer of mobile genetic elements. FEMS Microbiol Ecol. 2002;42:261–268. doi: 10.1111/j.1574-6941.2002.tb01016.x. [DOI] [PubMed] [Google Scholar]
- Hanski IA, Gilpin ME. Metapopulation Biology: Ecology, Genetics, and Evolution. San Diego, CA: Academic Press; 1997. [Google Scholar]
- Hausner M, Wuertz S. High rates of conjugation in bacterial biofilms as determined by quantitative in situ analysis. Appl Environ Microbiol. 1999;65:3710–3713. doi: 10.1128/aem.65.8.3710-3713.1999. [DOI] [PMC free article] [PubMed] [Google Scholar]
- Heuer H, Fox R, Top EM. Frequent conjugative transfer accelerates adaptation of a broad-host-range plasmid to an unfavourable Pseudomonas putida host. FEMS Microbiol Ecol. 2007;59:738–748. doi: 10.1111/j.1574-6941.2006.00223.x. [DOI] [PubMed] [Google Scholar]
- Hill KE, Top EM. Gene transfer in soil systems using microcosms. FEMS Microbiol Ecol. 1998;25:319–329. [Google Scholar]
- Kerr B, Riley MA, Feldman MW, Bohannan BJM. Local dispersal promotes biodiversity in a real-life game of rock-paper-scissors. Nature. 2002;418:171–174. doi: 10.1038/nature00823. [DOI] [PubMed] [Google Scholar]
- Kipnis C, Landim C. Scaling Limits of Interacting Particle Systems. Berlin: Springer-Verlag; 1999. [Google Scholar]
- Kreft J-U, Bonhoeffer S. The evolution of groups of cooperating bacteria and the growth rate versus yield trade-off. Microbiology. 2005;151:637–641. doi: 10.1099/mic.0.27415-0. [DOI] [PubMed] [Google Scholar]
- Kreft J-U, Booth G, Wimpenny JW. BacSim, a simulator for individual-based modelling of bacterial colony growth. Microbiology. 1998;144:3275–3287. doi: 10.1099/00221287-144-12-3275. [DOI] [PubMed] [Google Scholar]
- Krone SM. Spatial models: stochastic and deterministic. Math Comput Model. 2004;40:393–409. [Google Scholar]
- Krone SM, Guan Y. Spatial self-organization in a cyclic resource-species model. J Theor Biol. 2006;241:14–25. doi: 10.1016/j.jtbi.2005.11.005. [DOI] [PubMed] [Google Scholar]
- Lagido C, Wilson IJ, Glover LA, Prosser JI. A model for bacterial conjugal gene transfer on solid surfaces. FEMS Microbiol Ecol. 2003;44:67–78. doi: 10.1016/S0168-6496(02)00453-1. [DOI] [PubMed] [Google Scholar]
- Lejeune P, Mergeay M, Van Gijsegem F, Faelen M, Gerits J, Toussaint A. Chromosome transfer and R-prime plasmid formation mediated by plasmid pULB113 (RP4 ∷ mini-Mu) in Alcaligenes eutrophus CH 34 and Pseudomonas fluorescens 6.2. J Bacteriol. 1983;155:1015–1026. doi: 10.1128/jb.155.3.1015-1026.1983. [DOI] [PMC free article] [PubMed] [Google Scholar]
- Lenski RE. Experimental studies of pleiotropy and epistasis in Escherichia coli. I. Variation in competitive fitness among mutants resistant to virus T4. Evolution. 1988;42:425–432. doi: 10.1111/j.1558-5646.1988.tb04149.x. [DOI] [PubMed] [Google Scholar]
- Levin BR. Periodic selection, infectious gene exchange, and the genetic structure of E. coli populations. Genetics. 1981;99:1–23. doi: 10.1093/genetics/99.1.1. [DOI] [PMC free article] [PubMed] [Google Scholar]
- Levin BR, Stewart FM. The population biology of bacterial plasmids: a priori conditions for the existence of mobilizable nonconjugative factors. Genetics. 1980;94:425–443. doi: 10.1093/genetics/94.2.425. [DOI] [PMC free article] [PubMed] [Google Scholar]
- Levin BR, Stewart FM, Rice VA. The kinetics of conjugative plasmid transmission: fit of a simple mass action model. Plasmid. 1979;2:247–260. doi: 10.1016/0147-619x(79)90043-x. [DOI] [PubMed] [Google Scholar]
- Licht TR, Christensen BB, Krogfelt KA, Molin S. Plasmid transfer in the animal intestine and other dynamic bacterial populations: the role of community structure and environment. Microbiology. 1999;145:2615–2622. doi: 10.1099/00221287-145-9-2615. [DOI] [PubMed] [Google Scholar]
- Lundquist PD, Levin BR. Transitory derepression and the maintenance of conjugative plasmids. Genetics. 1986;113:483–497. doi: 10.1093/genetics/113.3.483. [DOI] [PMC free article] [PubMed] [Google Scholar]
- Matsuyama T, Matsushita M. Self-similar colony morphogenesis by Gram-negative rods as the experimental model of fractal growth by a cell population. Appl Environ Microbiol. 1992;58:1227–1232. doi: 10.1128/aem.58.4.1227-1232.1992. [DOI] [PMC free article] [PubMed] [Google Scholar]
- Mochizuki A, Yahara K, Kobayashi I, Iwasa Y. Genetic addiction: selfish gene’s strategy for symbiosis in the genome. Genetics. 2006;172:1309–1323. doi: 10.1534/genetics.105.042895. [DOI] [PMC free article] [PubMed] [Google Scholar]
- Molin S, Tolker-Nielsen T. Gene transfer occurs with enhanced efficiency in biofilms and induces enhanced stabilisation of the biofilm structure. Curr Opin Biotechnol. 2003;14:255–261. doi: 10.1016/s0958-1669(03)00036-3. [DOI] [PubMed] [Google Scholar]
- Murray JD. Mathematical Biology. Berlin: Springer-Verlag; 1989. [Google Scholar]
- Neubert MG, Caswell H. Demography and dispersal: calculation and sensitivity analysis of invasion speed for structured populations. Ecology. 2000;81:1613–1628. [Google Scholar]
- Picioreanu C, van Loosdrecht MC, Heijnen JJ. Mathematical modeling of biofilm structure with a hybrid differential-discrete cellular automaton approach. Biotechnol Bioeng. 1998a;58:101–116. doi: 10.1002/(sici)1097-0290(19980405)58:1<101::aid-bit11>3.0.co;2-m. [DOI] [PubMed] [Google Scholar]
- Picioreanu C, Van Loosdrecht MCM, Heijnen JJ. A new combined differential-discrete cellular automaton approach for biofilm modeling: application for growth in gel beads. Biotechnol Bioeng. 1998b;58:101–116. [PubMed] [Google Scholar]
- Picioreanu C, Kreft J-U, Van Loosdrecht MCM. Particle-based multidimensional multispecies biofilm model. Appl Environ Microbiol. 2004;70:3024–3040. doi: 10.1128/AEM.70.5.3024-3040.2004. [DOI] [PMC free article] [PubMed] [Google Scholar]
- Pinedo CA, Smets BF. Conjugal TOL transfer from Pseudomonas putida to Pseudomonas aeruginosa: effects of restriction proficiency, toxicant exposure, cell density ratios, and conjugation detection method on observed transfer efficiencies. Appl Environ Microbiol. 2005;71:51–57. doi: 10.1128/AEM.71.1.51-57.2005. [DOI] [PMC free article] [PubMed] [Google Scholar]
- Pirt SJ. A kinetic study of the mode of growth of surface colonies of bacteria and fungi. J Gen Microbiol. 1967;47:181–197. doi: 10.1099/00221287-47-2-181. [DOI] [PubMed] [Google Scholar]
- Reisner A, Haagensen JAJ, Schembri MA, Zechner EL, Molin S. Development and maturation of Escherichia coli K-12 biofilms. Mol Microbiol. 2003;48:933–946. doi: 10.1046/j.1365-2958.2003.03490.x. [DOI] [PubMed] [Google Scholar]
- Schlüter A, Heuer H, Szczepanowski R, Forney LJ, Thomas CM, Puehler A, Top EM. The 64 508 bp IncP-1β antibiotic multiresistance plasmid pB10 isolated from a waste-water treatment plant provides evidence for recombination between members of different branches of the IncP-1β group. Microbiology. 2003;149:3139–3153. doi: 10.1099/mic.0.26570-0. [DOI] [PubMed] [Google Scholar]
- Simonsen L. Dynamics of plasmid transfer on surfaces. J Gen Microbiol. 1990;136:1001–1007. doi: 10.1099/00221287-136-6-1001. [DOI] [PubMed] [Google Scholar]
- Simonsen L. The existence conditions for bacterial plasmids: theory and reality. Microb Ecol. 1991;22:187–205. doi: 10.1007/BF02540223. [DOI] [PubMed] [Google Scholar]
- Simonsen L, Gordon DM, Stewart FM, Levin BR. Estimating the rate of plasmid transfer: an end-point method. J Gen Microbiol. 1990;136:2319–2325. doi: 10.1099/00221287-136-11-2319. [DOI] [PubMed] [Google Scholar]
- Sørensen SJ, Bailey M, Hansen LH, Krower N, Wuertz S. Studying plasmid horizontal transfer in situ: a critical review. Nat Rev Microbiol. 2005;3:700–710. doi: 10.1038/nrmicro1232. [DOI] [PubMed] [Google Scholar]
- Stewart FM, Levin BR. The population biology of bacterial plasmids: a priori conditions for the existence of conjugally transmitted factors. Genetics. 1977;87:209–228. doi: 10.1093/genetics/87.2.209. [DOI] [PMC free article] [PubMed] [Google Scholar]
- Tilman D, Kareiva PM. Spatial Ecology: The Role of Space in Population Dynamics and Interspecific Interactions. Princeton, NY: Princeton University Press; 1997. [Google Scholar]
- Tolker-Nielsen T, Molin S. Biofilm development by pseudomonas. In: Verstraete W, editor. European Symposium on Environmental Biotechnology – ESEB 2004. Oostende, Belgium: A.A. Balkema Publishers; 2004. p. 909. [Google Scholar]
- Top E, Vanrolleghem P, Mergeay M, Verstraete W. Determination of the mechanism of retrotransfer by mechanistic mathematical modeling. J Bacteriol. 1992;174:5953–5960. doi: 10.1128/jb.174.18.5953-5960.1992. [DOI] [PMC free article] [PubMed] [Google Scholar]
- Top EM, Moënne-Loccoz Y, Pembroke T, Thomas CM. Phenotypic traits conferred by plasmids. In: Thomas CM, editor. The Horizontal Gene Pool: Bacterial Plasmids and Gene Spread. Amsterdam: Harwood Academic Publishers; 2000. pp. 249–285. [Google Scholar]
- Van Elsas JD, Fry JC, Hirsch P, Molin S. Ecology of plasmid transfer and spread. In: Thomas CM, editor. The Horizontal Gene Pool: Bacterial Plasmids and Gene Spread. Amsterdam: Harwood Academic Publishers; 2000. pp. 175–206. [Google Scholar]
- Venkatesan MM, Burland V. Genome-scale analysis of virulence plasmids: the contribution of plasmid-borne virulence genes to enterobacterial pathogenesis. In: Funnell BE, Phillips GJ, editors. Plasmid Biology. Washington, DC: American Society for Microbiology; 2004. p. 614. [Google Scholar]
- Wei W, Krone SM. Spatial invasion by a mutant pathogen. J Theor Biol. 2005;236:335–348. doi: 10.1016/j.jtbi.2005.03.016. [DOI] [PMC free article] [PubMed] [Google Scholar]
- Willetts NS. The kinetics of F’lac transfer by R100 in Escherichia coli K-12. Mol Gen Genet. 1974;129:123–130. doi: 10.1007/BF00268626. [DOI] [PubMed] [Google Scholar]
- Wimpenny JWT. The growth and form of bacterial colonies. J Gen Microbiol. 1979;114:483–486. doi: 10.1099/00221287-114-2-483. [DOI] [PubMed] [Google Scholar]
- Wimpenny JWT, Colasanti R. A unifying hypothesis for the structure of microbial biofilms based on cellular automaton models. FEMS Microbiol Ecol. 1997;22:1–16. [Google Scholar]
- Xavier JB, Picioreanu C, van Loosdrecht MCM. A framework for multidimensional modelling of activity and structure of multispecies biofilms. Environ Microbiol. 2005;7:1085–1103. doi: 10.1111/j.1462-2920.2005.00787.x. [DOI] [PubMed] [Google Scholar]
- Zechner EL, de la Cruz F, Eisenbrandt R, et al. Conjugative-DNA transfer processes. In: Thomas CM, editor. The Horizontal Gene Pool: Bacterial Plasmids and Gene Spread. Amsterdam: Harwood Academic Publishers; 2000. pp. 87–174. [Google Scholar]